6 raymond a serway, john w jewett physics for scientists and engineers with modern physics 04
Bạn đang xem bản rút gọn của tài liệu. Xem và tải ngay bản đầy đủ của tài liệu tại đây (40.05 MB, 20 trang )
44
Chapter 2
Motion in One Dimension
A N A LYS I S M O D E L S F O R P R O B L E M - S O LV I N G
Particle Under Constant Velocity. If a particle moves in a straight
line with a constant speed vx, its constant velocity is given by
vx ϭ
¢x
¢t
(2.6)
Particle Under Constant Acceleration. If a particle moves in a straight line with a constant
acceleration ax, its motion is described by the
kinematic equations:
vxf ϭ vxi ϩ axt
and its position is given by
xf ϭ xi ϩ vxt
vx,¬avg ϭ
(2.7)
v
Particle Under Constant Speed. If a particle moves a distance d
along a curved or straight path with a constant speed, its constant speed is given by
vϭ
d
¢t
vxi ϩ vxf
2
(2.13)
(2.14)
xf ϭ xi ϩ 12 1vxi ϩ vxf 2t
(2.15)
xf ϭ xi ϩ vxit ϩ 12axt 2
(2.16)
v xf 2 ϭ v xi 2 ϩ 2ax 1xf Ϫ xi 2
(2.17)
v
(2.8)
a
v
Questions
Ⅺ denotes answer available in Student Solutions Manual/Study Guide; O denotes objective question
1. O One drop of oil falls straight down onto the road from
the engine of a moving car every 5 s. Figure Q2.1 shows
the pattern of the drops left behind on the pavement.
What is the average speed of the car over this section
of its motion? (a) 20 m/s (b) 24 m/s (c) 30 m/s
(d) 100 m/s (e) 120 m/s
600 m
Figure Q2.1
2. If the average velocity of an object is zero in some time
interval, what can you say about the displacement of the
object for that interval?
3. O Can the instantaneous velocity of an object at an
instant of time ever be greater in magnitude than the
average velocity over a time interval containing the
instant? Can it ever be less?
4. O A cart is pushed along a straight horizontal track. (a) In
a certain section of its motion, its original velocity is vxi ϭ
ϩ3 m/s and it undergoes a change in velocity of ⌬vx ϭ
ϩ4 m/s. Does it speed up or slow down in this section of
its motion? Is its acceleration positive or negative? (b) In
another part of its motion, vxi ϭ Ϫ3 m/s and ⌬vx ϭ
ϩ4 m/s. Does it undergo a net increase or decrease in
speed? Is its acceleration positive or negative? (c) In a
third segment of its motion, vxi ϭ ϩ3 m/s and ⌬vx ϭ
Ϫ4 m/s. Does it have a net gain or loss in speed? Is its
acceleration positive or negative? (d) In a fourth time
interval, vxi ϭ Ϫ3 m/s and ⌬vx ϭ Ϫ4 m/s. Does the cart
gain or lose speed? Is its acceleration positive or negative?
5. Two cars are moving in the same direction in parallel
lanes along a highway. At some instant, the velocity of car
A exceeds the velocity of car B. Does that mean that the
acceleration of A is greater than that of B? Explain.
6. O When the pilot reverses the propeller in a boat moving
north, the boat moves with an acceleration directed
south. If the acceleration of the boat remains constant in
magnitude and direction, what would happen to the boat
(choose one)? (a) It would eventually stop and then
remain stopped. (b) It would eventually stop and then
start to speed up in the forward direction. (c) It would
eventually stop and then start to speed up in the reverse
direction. (d) It would never quite stop but lose speed
more and more slowly forever. (e) It would never stop but
continue to speed up in the forward direction.
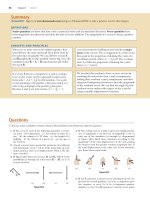
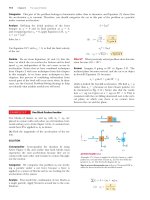
7. O Each of the strobe photographs (a), (b), and (c) in Figure Q2.7 was taken of a single disk moving toward the
right, which we take as the positive direction. Within each
photograph, the time interval between images is constant.
(i) Which photograph(s), if any, shows constant zero
velocity? (ii) Which photograph(s), if any, shows constant
zero acceleration? (iii) Which photograph(s), if any,
shows constant positive velocity? (iv) Which photograph(s), if any, shows constant positive acceleration?
(v) Which photograph(s), if any, shows some motion with
negative acceleration?
Problems
(a)
(b)
(c)
Figure Q2.7
Question 7 and Problem 17.
8. Try the following experiment away from traffic where you
can do it safely. With the car you are driving moving
slowly on a straight, level road, shift the transmission into
neutral and let the car coast. At the moment the car
comes to a complete stop, step hard on the brake and
notice what you feel. Now repeat the same experiment on
a fairly gentle uphill slope. Explain the difference in what
a person riding in the car feels in the two cases. (Brian
Popp suggested the idea for this question.)
9. O A skateboarder coasts down a long hill, starting from
rest and moving with constant acceleration to cover a certain distance in 6 s. In a second trial, he starts from rest
and moves with the same acceleration for only 2 s. How is
his displacement different in this second trial compared
with the first trial? (a) one-third as large (b) three times
larger (c) one-ninth as large (d) nine times larger
(e) 1> 1 3 times as large (f) 1 3 times larger (g) none
of these answers
10. O Can the equations of kinematics (Eqs. 2.13–2.17) be
used in a situation in which the acceleration varies in
time? Can they be used when the acceleration is zero?
11. A student at the top of a building of height h throws one
ball upward with a speed of vi and then throws a second
ball downward with the same initial speed |vi|. How do the
final velocities of the balls compare when they reach the
ground?
45
12. O A pebble is released from rest at a certain height and
falls freely, reaching an impact speed of 4 m/s at the
floor. (i) Next, the pebble is thrown down with an initial
speed of 3 m/s from the same height. In this trial, what is
its speed at the floor? (a) less than 4 m/s (b) 4 m/s
(c) between 4 m/s and 5 m/s (d) 1 32 ϩ 42 m>s ϭ 5 m>s
(e) between 5 m/s and 7 m/s (f) (3 ϩ 4) m/s ϭ 7 m/s
(g) greater than 7 m/s (ii) In a third trial, the pebble is
tossed upward with an initial speed of 3 m/s from the
same height. What is its speed at the floor in this trial?
Choose your answer from the same list (a) through (g).
13. O A hard rubber ball, not affected by air resistance in its
motion, is tossed upward from shoulder height, falls to
the sidewalk, rebounds to a somewhat smaller maximum
height, and is caught on its way down again. This motion
is represented in Figure Q2.13, where the successive positions of the ball Ꭽ through ൶ are not equally spaced in
time. At point ൴ the center of the ball is at its lowest
point in the motion. The motion of the ball is along a
straight line, but the diagram shows successive positions
offset to the right to avoid overlapping. Choose the positive y direction to be upward. (i) Rank the situations Ꭽ
through ൶ according to the speed of the ball |vy| at each
point, with the largest speed first. (ii) Rank the same situations according to the velocity of the ball at each point.
(iii) Rank the same situations according to the acceleration ay of the ball at each point. In each ranking, remember that zero is greater than a negative value. If two values
are equal, show that they are equal in your ranking.
Ꭾ
൶
Ꭽ
Ꭿ
൳
൵
൴
Figure Q2.13
14. O You drop a ball from a window located on an upper
floor of a building. It strikes the ground with speed v. You
now repeat the drop, but you ask a friend down on the
ground to throw another ball upward at speed v. Your
friend throws the ball upward at the same moment that
you drop yours from the window. At some location, the
balls pass each other. Is this location (a) at the halfway
point between window and ground, (b) above this point,
or (c) below this point?
Problems
The Problems from this chapter may be assigned online in WebAssign.
Sign in at www.thomsonedu.com and go to ThomsonNOW to assess your understanding of this chapter’s topics
with additional quizzing and conceptual questions.
1, 2, 3 denotes straightforward, intermediate, challenging; Ⅺ denotes full solution available in Student Solutions Manual/Study
Guide ; ᮡ denotes coached solution with hints available at www.thomsonedu.com; Ⅵ denotes developing symbolic reasoning;
ⅷ denotes asking for qualitative reasoning;
denotes computer useful in solving problem
46
Chapter 2
Motion in One Dimension
Section 2.1 Position, Velocity, and Speed
1. The position versus time for a certain particle moving
along the x axis is shown in Figure P2.1. Find the average
velocity in the following time intervals. (a) 0 to 2 s (b) 0
to 4 s (c) 2 s to 4 s (d) 4 s to 7 s (e) 0 to 8 s
x (m)
10
8
6
4
2
0
Ϫ2
Ϫ4
Ϫ6
1 2 3 4 5 6
Figure P2.1
7
8
t (s)
Problems 1 and 8.
2. The position of a pinewood derby car was observed at various moments; the results are summarized in the following table. Find the average velocity of the car for (a) the
first 1-s time interval, (b) the last 3 s, and (c) the entire
period of observation.
t (s)
x (m)
0
0
1.0
2.3
2.0
9.2
3.0
20.7
4.0
36.8
5.0
57.5
3. A person walks first at a constant speed of 5.00 m/s along
a straight line from point A to point B and then back
along the line from B to A at a constant speed of
3.00 m/s. (a) What is her average speed over the entire
trip? (b) What is her average velocity over the entire trip?
4. A particle moves according to the equation x ϭ 10t 2,
where x is in meters and t is in seconds. (a) Find the average velocity for the time interval from 2.00 s to 3.00 s.
(b) Find the average velocity for the time interval from
2.00 s to 2.10 s.
meters and t is in seconds. Evaluate its position (a) at t ϭ
3.00 s and (b) at 3.00 s ϩ ⌬t. (c) Evaluate the limit of
⌬x/⌬t as ⌬t approaches zero to find the velocity at t ϭ
3.00 s.
7. (a) Use the data in Problem 2.2 to construct a smooth
graph of position versus time. (b) By constructing tangents to the x(t) curve, find the instantaneous velocity of
the car at several instants. (c) Plot the instantaneous
velocity versus time and, from the graph, determine the
average acceleration of the car. (d) What was the initial
velocity of the car?
8. Find the instantaneous velocity of the particle described
in Figure P2.1 at the following times: (a) t ϭ 1.0 s (b) t ϭ
3.0 s (c) t ϭ 4.5 s (d) t ϭ 7.5 s
Section 2.3 Analysis Models: The Particle
Under Constant Velocity
9. A hare and a tortoise compete in a race over a course
1.00 km long. The tortoise crawls straight and steadily at
its maximum speed of 0.200 m/s toward the finish line.
The hare runs at its maximum speed of 8.00 m/s toward
the goal for 0.800 km and then stops to tease the tortoise.
How close to the goal can the hare let the tortoise
approach before resuming the race, which the tortoise wins
in a photo finish? Assume both animals, when moving,
move steadily at their respective maximum speeds.
Section 2.4 Acceleration
10. A 50.0-g Super Ball traveling at 25.0 m/s bounces off a
brick wall and rebounds at 22.0 m/s. A high-speed camera records this event. If the ball is in contact with the
wall for 3.50 ms, what is the magnitude of the average
acceleration of the ball during this time interval? Note:
1 ms ϭ 10Ϫ3 s.
11. A particle starts from rest and accelerates as shown in Figure P2.11. Determine (a) the particle’s speed at t ϭ 10.0 s
and at t ϭ 20.0 s and (b) the distance traveled in the first
20.0 s.
Section 2.2 Instantaneous Velocity and Speed
5. ᮡ A position–time graph for a particle moving along the
x axis is shown in Figure P2.5. (a) Find the average velocity in the time interval t ϭ 1.50 s to t ϭ 4.00 s. (b) Determine the instantaneous velocity at t ϭ 2.00 s by measuring
the slope of the tangent line shown in the graph. (c) At
what value of t is the velocity zero?
a x (m/s2)
2
1
t (s)
0
Ϫ1
5
10
15
20
Ϫ2
x (m)
Ϫ3
12
10
Figure P2.11
8
6
4
2
0
1
2
3
4
5
6
t (s)
Figure P2.5
6. The position of a particle moving along the x axis varies
in time according to the expression x ϭ 3t 2, where x is in
2 = intermediate;
3 = challenging;
Ⅺ = SSM/SG;
ᮡ
12. A velocity–time graph for an object moving along the x
axis is shown in Figure P2.12. (a) Plot a graph of the
acceleration versus time. (b) Determine the average acceleration of the object in the time intervals t ϭ 5.00 s to t ϭ
15.0 s and t ϭ 0 to t ϭ 20.0 s.
13. ᮡ A particle moves along the x axis according to the
equation x ϭ 2.00 ϩ 3.00t Ϫ 1.00t 2, where x is in meters
and t is in seconds. At t ϭ 3.00 s, find (a) the position of
the particle, (b) its velocity, and (c) its acceleration.
= ThomsonNOW;
Ⅵ = symbolic reasoning;
ⅷ = qualitative reasoning
Problems
47
vx (m/s)
vx (m/s)
8
10
8
4
6
4
5
0
10
15
20
t (s)
2
0
Ϫ4
2
4
6
8
10
12
t (s)
Figure P2.16
Ϫ8
Figure P2.12
14. A child rolls a marble on a bent track that is 100 cm long
as shown in Figure P2.14. We use x to represent the position of the marble along the track. On the horizontal sections from x ϭ 0 to x ϭ 20 cm and from x ϭ 40 cm to x ϭ
60 cm, the marble rolls with constant speed. On the sloping sections, the speed of the marble changes steadily. At
the places where the slope changes, the marble stays on
the track and does not undergo any sudden changes in
speed. The child gives the marble some initial speed at
x ϭ 0 and t ϭ 0 and then watches it roll to x ϭ 90 cm,
where it turns around, eventually returning to x ϭ 0 with
the same speed with which the child initially released it.
Prepare graphs of x versus t, vx versus t, and ax versus t,
vertically aligned with their time axes identical, to show
the motion of the marble. You will not be able to place
numbers other than zero on the horizontal axis or on the
velocity or acceleration axes, but show the correct relative
sizes on the graphs.
v
Figure P2.14
15. An object moves along the x axis according to the equation x(t) ϭ (3.00t 2 Ϫ 2.00t ϩ 3.00) m, where t is in seconds. Determine (a) the average speed between t ϭ 2.00 s
and t ϭ 3.00 s, (b) the instantaneous speed at t ϭ 2.00 s
and at t ϭ 3.00 s, (c) the average acceleration between
t ϭ 2.00 s and t ϭ 3.00 s, and (d) the instantaneous acceleration at t ϭ 2.00 s and t ϭ 3.00 s.
16. Figure P2.16 shows a graph of vx versus t for the motion
of a motorcyclist as he starts from rest and moves along
2 = intermediate;
3 = challenging;
Ⅺ = SSM/SG;
ᮡ
the road in a straight line. (a) Find the average acceleration for the time interval t ϭ 0 to t ϭ 6.00 s. (b) Estimate
the time at which the acceleration has its greatest positive
value and the value of the acceleration at that instant.
(c) When is the acceleration zero? (d) Estimate the maximum negative value of the acceleration and the time at
which it occurs.
Section 2.5 Motion Diagrams
17. ⅷ Each of the strobe photographs (a), (b), and (c) in
Figure Q2.7 was taken of a single disk moving toward the
right, which we take as the positive direction. Within each
photograph the time interval between images is constant.
For each photograph, prepare graphs of x versus t, vx versus t, and ax versus t, vertically aligned with their time axes
identical, to show the motion of the disk. You will not be
able to place numbers other than zero on the axes, but
show the correct relative sizes on the graphs.
18. Draw motion diagrams for (a) an object moving to the
right at constant speed, (b) an object moving to the
right and speeding up at a constant rate, (c) an object
moving to the right and slowing down at a constant rate,
(d) an object moving to the left and speeding up at a
constant rate, and (e) an object moving to the left and
slowing down at a constant rate. (f) How would your
drawings change if the changes in speed were not uniform; that is, if the speed were not changing at a constant rate?
Section 2.6 The Particle Under Constant Acceleration
19. ⅷ Assume a parcel of air in a straight tube moves with a
constant acceleration of Ϫ4.00 m/s2 and has a velocity of
13.0 m/s at 10:05:00 a.m. on a certain date. (a) What is its
velocity at 10:05:01 a.m.? (b) At 10:05:02 a.m.? (c) At
10:05:02.5 a.m.? (d) At 10:05:04 a.m.? (e) At 10:04:59
a.m.? (f) Describe the shape of a graph of velocity versus
time for this parcel of air. (g) Argue for or against the
statement, “Knowing the single value of an object’s constant acceleration is like knowing a whole list of values for
its velocity.”
20. A truck covers 40.0 m in 8.50 s while smoothly slowing
down to a final speed of 2.80 m/s. (a) Find its original
speed. (b) Find its acceleration.
21. ᮡ An object moving with uniform acceleration has a
velocity of 12.0 cm/s in the positive x direction when its x
coordinate is 3.00 cm. If its x coordinate 2.00 s later is
Ϫ5.00 cm, what is its acceleration?
= ThomsonNOW;
Ⅵ = symbolic reasoning;
ⅷ = qualitative reasoning
Motion in One Dimension
22. Figure P2.22 represents part of the performance data of a
car owned by a proud physics student. (a) Calculate the
total distance traveled by computing the area under the
graph line. (b) What distance does the car travel between
the times t ϭ 10 s and t ϭ 40 s? (c) Draw a graph of its
acceleration versus time between t ϭ 0 and t ϭ 50 s.
(d) Write an equation for x as a function of time for each
phase of the motion, represented by (i) 0a, (ii) ab, and
(iii) bc. (e) What is the average velocity of the car between
t ϭ 0 and t ϭ 50 s?
vx (m/s)
a
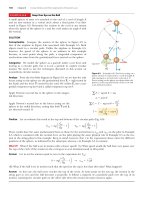
50
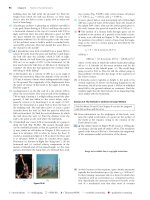
sled were safely brought to rest in 1.40 s (Fig. P2.27).
Determine (a) the negative acceleration he experienced
and (b) the distance he traveled during this negative
acceleration.
b
40
30
Photri, Inc.
Chapter 2
Courtesy U.S. Air Force
48
Figure P2.27 (Left) Col. John Stapp on rocket sled. (Right) Stapp’s
face is contorted by the stress of rapid negative acceleration.
20
10
0
c t (s)
10 20 30 40 50
Figure P2.22
23. ⅷ A jet plane comes in for a landing with a speed of
100 m/s, and its acceleration can have a maximum magnitude of 5.00 m/s2 as it comes to rest. (a) From the
instant the plane touches the runway, what is the minimum time interval needed before it can come to rest?
(b) Can this plane land on a small tropical island airport
where the runway is 0.800 km long? Explain your
answer.
24. ⅷ At t ϭ 0, one toy car is set rolling on a straight track
with initial position 15.0 cm, initial velocity Ϫ3.50 cm/s,
and constant acceleration 2.40 cm/s2. At the same
moment, another toy car is set rolling on an adjacent
track with initial position 10.0 cm, an initial velocity of
ϩ5.50 cm/s, and constant acceleration zero. (a) At what
time, if any, do the two cars have equal speeds? (b) What
are their speeds at that time? (c) At what time(s), if any,
do the cars pass each other? (d) What are their locations
at that time? (e) Explain the difference between question
(a) and question (c) as clearly as possible. Write (or
draw) for a target audience of students who do not immediately understand the conditions are different.
25. The driver of a car slams on the brakes when he sees a
tree blocking the road. The car slows uniformly with an
acceleration of Ϫ5.60 m/s2 for 4.20 s, making straight
skid marks 62.4 m long ending at the tree. With what
speed does the car then strike the tree?
26. Help! One of our equations is missing! We describe constantacceleration motion with the variables and parameters vxi,
vxf, ax, t, and xf Ϫ xi. Of the equations in Table 2.2, the
first does not involve xf Ϫ xi, the second does not contain
ax, the third omits vxf, and the last leaves out t. So, to complete the set there should be an equation not involving vxi.
Derive it from the others. Use it to solve Problem 25 in
one step.
27. For many years Colonel John P. Stapp, USAF, held the
world’s land speed record. He participated in studying
whether a jet pilot could survive emergency ejection. On
March 19, 1954, he rode a rocket-propelled sled that
moved down a track at a speed of 632 mi/h. He and the
2 = intermediate;
3 = challenging;
Ⅺ = SSM/SG;
ᮡ
28. A particle moves along the x axis. Its position is given by
the equation x ϭ 2 ϩ 3t Ϫ 4t 2, with x in meters and t in
seconds. Determine (a) its position when it changes direction and (b) its velocity when it returns to the position it
had at t ϭ 0.
29. An electron in a cathode-ray tube accelerates from a
speed of 2.00 ϫ 104 m/s to 6.00 ϫ 106 m/s over 1.50 cm.
(a) In what time interval does the electron travel this
1.50 cm? (b) What is its acceleration?
30. ⅷ Within a complex machine such as a robotic assembly
line, suppose one particular part glides along a straight
track. A control system measures the average velocity of
the part during each successive time interval ⌬t0 ϭ t0 Ϫ 0,
compares it with the value vc it should be, and switches a
servo motor on and off to give the part a correcting pulse
of acceleration. The pulse consists of a constant acceleration am applied for time interval ⌬tm ϭ tm Ϫ 0 within the
next control time interval ⌬t0. As shown in Figure P2.30,
the part may be modeled as having zero acceleration
when the motor is off (between tm and t0). A computer in
the control system chooses the size of the acceleration so
that the final velocity of the part will have the correct
value vc. Assume the part is initially at rest and is to have
instantaneous velocity vc at time t0. (a) Find the required
value of am in terms of vc and tm. (b) Show that the displacement ⌬x of the part during the time interval ⌬t0 is
given by ⌬x ϭ vc (t0 Ϫ 0.5tm). For specified values of vc
and t0, (c) what is the minimum displacement of the part?
(d) What is the maximum displacement of the part?
(e) Are both the minimum and maximum displacements
physically attainable?
a
am
0
t0
tm
t
Figure P2.30
31. ⅷ A glider on an air track carries a flag of length ᐉ
through a stationary photogate, which measures the time
= ThomsonNOW;
Ⅵ = symbolic reasoning;
ⅷ = qualitative reasoning
Problems
33.
34.
35.
Section 2.7 Freely Falling Objects
Note: In all problems in this section, ignore the effects of air
resistance.
36. In a classic clip on America’s Funniest Home Videos, a sleeping cat rolls gently off the top of a warm TV set. Ignoring
air resistance, calculate (a) the position and (b) the velocity of the cat after 0.100 s, 0.200 s, and 0.300 s.
37. ⅷ Every morning at seven o’clock
There’s twenty terriers drilling on the rock.
The boss comes around and he says, “Keep still
And bear down heavy on the cast-iron drill
And drill, ye terriers, drill.” And drill, ye terriers, drill.
It’s work all day for sugar in your tea
Down beyond the railway. And drill, ye terriers, drill.
2 = intermediate;
3 = challenging;
Ⅺ = SSM/SG;
ᮡ
The foreman’s name was John McAnn.
By God, he was a blamed mean man.
One day a premature blast went off
And a mile in the air went big Jim Goff. And drill . . .
Then when next payday came around
Jim Goff a dollar short was found.
When he asked what for, came this reply:
“You were docked for the time you were up in the sky.”
And drill . . .
—American folksong
What was Goff’s hourly wage? State the assumptions you
make in computing it.
38. A ball is thrown directly downward, with an initial speed
of 8.00 m/s, from a height of 30.0 m. After what time
interval does the ball strike the ground?
39. ᮡ A student throws a set of keys vertically upward to her
sorority sister, who is in a window 4.00 m above. The keys
are caught 1.50 s later by the sister’s outstretched hand.
(a) With what initial velocity were the keys thrown?
(b) What was the velocity of the keys just before they were
caught?
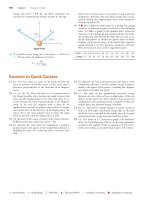
40. ⅷ Emily challenges her friend David to catch a dollar bill
as follows. She holds the bill vertically, as shown in Figure
P2.40, with the center of the bill between David’s index
finger and thumb. David must catch the bill after Emily
releases it without moving his hand downward. If his reaction time is 0.2 s, will he succeed? Explain your reasoning.
George Semple
32.
interval ⌬td during which the flag blocks a beam of
infrared light passing across the photogate. The ratio vd ϭ
ᐉ/⌬td is the average velocity of the glider over this part of
its motion. Suppose the glider moves with constant acceleration. (a) Argue for or against the idea that vd is equal
to the instantaneous velocity of the glider when it is
halfway through the photogate in space. (b) Argue for or
against the idea that vd is equal to the instantaneous
velocity of the glider when it is halfway through the photogate in time.
ⅷ Speedy Sue, driving at 30.0 m/s, enters a one-lane tunnel. She then observes a slow-moving van 155 m ahead
traveling at 5.00 m/s. Sue applies her brakes but can
accelerate only at Ϫ2.00 m/s2 because the road is wet.
Will there be a collision? State how you decide. If yes,
determine how far into the tunnel and at what time the
collision occurs. If no, determine the distance of closest
approach between Sue’s car and the van.
Vroom, vroom! As soon as a traffic light turns green, a car
speeds up from rest to 50.0 mi/h with constant acceleration 9.00 mi/h и s. In the adjoining bike lane, a cyclist
speeds up from rest to 20.0 mi/h with constant acceleration 13.0 mi/h и s. Each vehicle maintains constant velocity after reaching its cruising speed. (a) For what time
interval is the bicycle ahead of the car? (b) By what maximum distance does the bicycle lead the car?
Solve Example 2.8 (Watch Out for the Speed Limit!) by a
graphical method. On the same graph plot position versus time for the car and the police officer. From the intersection of the two curves read the time at which the
trooper overtakes the car.
ⅷ A glider of length 12.4 cm moves on an air track with
constant acceleration. A time interval of 0.628 s elapses
between the moment when its front end passes a fixed
point Ꭽ along the track and the moment when its back
end passes this point. Next, a time interval of 1.39 s
elapses between the moment when the back end of the
glider passes point Ꭽ and the moment when the front
end of the glider passes a second point Ꭾ farther down
the track. After that, an additional 0.431 s elapses until
the back end of the glider passes point Ꭾ. (a) Find the
average speed of the glider as it passes point Ꭽ. (b) Find
the acceleration of the glider. (c) Explain how you can
compute the acceleration without knowing the distance
between points Ꭽ and Ꭾ.
49
Figure P2.40
41. A baseball is hit so that it travels straight upward after
being struck by the bat. A fan observes that it takes 3.00 s
for the ball to reach its maximum height. Find (a) the
ball’s initial velocity and (b) the height it reaches.
42. ⅷ An attacker at the base of a castle wall 3.65 m high
throws a rock straight up with speed 7.40 m/s at a height
of 1.55 m above the ground. (a) Will the rock reach the
top of the wall? (b) If so, what is its speed at the top? If not,
what initial speed must it have to reach the top? (c) Find
the change in speed of a rock thrown straight down from
the top of the wall at an initial speed of 7.40 m/s and
moving between the same two points. (d) Does the
change in speed of the downward-moving rock agree with
the magnitude of the speed change of the rock moving
upward between the same elevations? Explain physically
why it does or does not agree.
ᮡ
43.
A daring ranch hand sitting on a tree limb wishes to
drop vertically onto a horse galloping under the tree. The
constant speed of the horse is 10.0 m/s, and the distance
= ThomsonNOW;
Ⅵ = symbolic reasoning;
ⅷ = qualitative reasoning
50
Chapter 2
Motion in One Dimension
from the limb to the level of the saddle is 3.00 m. (a) What
must the horizontal distance between the saddle and limb
be when the ranch hand makes his move? (b) For what
time interval is he in the air?
44. The height of a helicopter above the ground is given by h
ϭ 3.00t 3, where h is in meters and t is in seconds. After
2.00 s, the helicopter releases a small mailbag. How long
after its release does the mailbag reach the ground?
45. A freely falling object requires 1.50 s to travel the last
30.0 m before it hits the ground. From what height above
the ground did it fall?
4 s? (b) What is the acceleration of the object between 4 s
and 9 s? (c) What is the acceleration of the object
between 13 s and 18 s? (d) At what time(s) is the object
moving with the lowest speed? (e) At what time is the
object farthest from x ϭ 0? (f) What is the final position x
of the object at t ϭ 18 s? (g) Through what total distance
has the object moved between t ϭ 0 and t ϭ 18 s?
vx (m/s)
20
10
Section 2.8 Kinematic Equations Derived from Calculus
46. A student drives a moped along a straight road as
described by the velocity-versus-time graph in Figure
P2.46. Sketch this graph in the middle of a sheet of graph
paper. (a) Directly above your graph, sketch a graph of
the position versus time, aligning the time coordinates of
the two graphs. (b) Sketch a graph of the acceleration
versus time directly below the vx–t graph, again aligning
the time coordinates. On each graph, show the numerical
values of x and ax for all points of inflection. (c) What is
the acceleration at t ϭ 6 s? (d) Find the position (relative
to the starting point) at t ϭ 6 s. (e) What is the moped’s
final position at t ϭ 9 s?
vx (m/s)
8
4
0
1 2 3 4 5 6 7 8 9 10
0
5
10
15
t (s)
Ϫ10
Figure P2.49
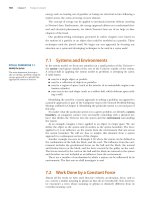
50. ⅷ The Acela (pronounced ah-SELL-ah and shown in Fig.
P2.50a) is an electric train on the Washington–New
York–Boston run, carrying passengers at 170 mi/h. The
carriages tilt as much as 6° from the vertical to prevent
passengers from feeling pushed to the side as they go
around curves. A velocity–time graph for the Acela is
shown in Figure P2.50b. (a) Describe the motion of the
train in each successive time interval. (b) Find the peak
positive acceleration of the train in the motion graphed.
(c) Find the train’s displacement in miles between t ϭ 0
and t ϭ 200 s.
t (s)
Ϫ4
Ϫ8
Additional Problems
49. An object is at x ϭ 0 at t ϭ 0 and moves along the x axis
according to the velocity–time graph in Figure P2.49.
(a) What is the acceleration of the object between 0 and
2 = intermediate;
3 = challenging;
Ⅺ = SSM/SG;
ᮡ
(a)
200
150
v (mi/h)
47. Automotive engineers refer to the time rate of change of
acceleration as the “jerk.” Assume an object moves in one
dimension such that its jerk J is constant. (a) Determine
expressions for its acceleration ax(t), velocity vx(t), and
position x(t), given that its initial acceleration, velocity,
and position are axi, vxi, and xi, respectively. (b) Show that
a x 2 ϭ a xi 2 ϩ 2J 1vx Ϫ vxi 2.
48. The speed of a bullet as it travels down the barrel of a rifle
toward the opening is given by v ϭ (Ϫ5.00 ϫ 107)t 2 ϩ
(3.00 ϫ 105)t, where v is in meters per second and t is in
seconds. The acceleration of the bullet just as it leaves
the barrel is zero. (a) Determine the acceleration and
position of the bullet as a function of time when the bullet is in the barrel. (b) Determine the time interval over
which the bullet is accelerated. (c) Find the speed at
which the bullet leaves the barrel. (d) What is the length
of the barrel?
Associated Press
Figure P2.46
100
50
0
Ϫ50
Ϫ50
t (s)
0
50
100 150 200 250 300 350 400
Ϫ100
(b)
Figure P2.50 (a) The Acela: 1 171 000 lb of cold steel thundering
along with 304 passengers. (b) Velocity-versus-time graph for the Acela.
51. A test rocket is fired vertically upward from a well. A catapult gives it an initial speed of 80.0 m/s at ground level.
= ThomsonNOW;
Ⅵ = symbolic reasoning;
ⅷ = qualitative reasoning
Problems
Its engines then fire and it accelerates upward at 4.00 m/s2
until it reaches an altitude of 1 000 m. At that point its
engines fail and the rocket goes into free fall, with an
acceleration of Ϫ9.80 m/s2. (a) For what time interval is
the rocket in motion above the ground? (b) What is its
maximum altitude? (c) What is its velocity just before it
collides with the Earth? (You will need to consider the
motion while the engine is operating separate from the
free-fall motion.)
52. ⅷ In Active Figure 2.11b, the area under the velocity versus time curve and between the vertical axis and time t
(vertical dashed line) represents the displacement. As
shown, this area consists of a rectangle and a triangle.
Compute their areas and state how the sum of the two
areas compares with the expression on the right-hand
side of Equation 2.16.
53. Setting a world record in a 100-m race, Maggie and Judy
cross the finish line in a dead heat, both taking 10.2 s.
Accelerating uniformly, Maggie took 2.00 s and Judy took
3.00 s to attain maximum speed, which they maintained
for the rest of the race. (a) What was the acceleration of
each sprinter? (b) What were their respective maximum
speeds? (c) Which sprinter was ahead at the 6.00-s mark,
and by how much?
54. ⅷ How long should a traffic light stay yellow? Assume you are
driving at the speed limit v0. As you approach an intersection 22.0 m wide, you see the light turn yellow. During
your reaction time of 0.600 s, you travel at constant speed
as you recognize the warning, decide whether to stop or
to go through the intersection, and move your foot to the
brake if you must stop. Your car has good brakes and can
accelerate at Ϫ2.40 m/s2. Before it turns red, the light
should stay yellow long enough for you to be able to get
to the other side of the intersection without speeding up,
if you are too close to the intersection to stop before
entering it. (a) Find the required time interval ⌬ty that
the light should stay yellow in terms of v0. Evaluate your
answer for (b) v0 ϭ 8.00 m/s ϭ 28.8 km/h, (c) v0 ϭ
11.0 m/s ϭ 40.2 km/h, (d) v0 ϭ 18.0 m/s ϭ 64.8 km/h,
and (e) v0 ϭ 25.0 m/s ϭ 90.0 km/h. What If? Evaluate
your answer for (f) v0 approaching zero, and (g) v0
approaching infinity. (h) Describe the pattern of variation of ⌬ty with v0. You may wish also to sketch a graph
of it. Account for the answers to parts (f) and (g) physically. (i) For what value of v0 would ⌬ty be minimal,
and (j) what is this minimum time interval? Suggestion:
You may find it easier to do part (a) after first doing
part (b).
55. A commuter train travels between two downtown stations.
Because the stations are only 1.00 km apart, the train
never reaches its maximum possible cruising speed. During rush hour the engineer minimizes the time interval
⌬t between two stations by accelerating for a time interval
⌬t1 at a rate a1 ϭ 0.100 m/s2 and then immediately braking with acceleration a2 ϭ Ϫ0.500 m/s2 for a time interval
⌬t2. Find the minimum time interval of travel ⌬t and the
time interval ⌬t1.
56. A Ferrari F50 of length 4.52 m is moving north on a roadway that intersects another perpendicular roadway. The
width of the intersection from near edge to far edge is
28.0 m. The Ferrari has a constant acceleration of magni2 = intermediate;
3 = challenging;
Ⅺ = SSM/SG;
ᮡ
51
tude 2.10 m/s2 directed south. The time interval required
for the nose of the Ferrari to move from the near (south)
edge of the intersection to the north edge of the intersection is 3.10 s. (a) How far is the nose of the Ferrari from
the south edge of the intersection when it stops? (b) For
what time interval is any part of the Ferrari within the
boundaries of the intersection? (c) A Corvette is at rest
on the perpendicular intersecting roadway. As the nose of
the Ferrari enters the intersection, the Corvette starts
from rest and accelerates east at 5.60 m/s2. What is the
minimum distance from the near (west) edge of the intersection at which the nose of the Corvette can begin its
motion if the Corvette is to enter the intersection after
the Ferrari has entirely left the intersection? (d) If the
Corvette begins its motion at the position given by your
answer to part (c), with what speed does it enter the
intersection?
57. An inquisitive physics student and mountain climber
climbs a 50.0-m cliff that overhangs a calm pool of
water. He throws two stones vertically downward, 1.00 s
apart, and observes that they cause a single splash. The
first stone has an initial speed of 2.00 m/s. (a) How
long after release of the first stone do the two stones hit
the water? (b) What initial velocity must the second
stone have if they are to hit simultaneously? (c) What is
the speed of each stone at the instant the two hit the
water?
58. ⅷ A hard rubber ball, released at chest height, falls to the
pavement and bounces back to nearly the same height.
When it is in contact with the pavement, the lower side of
the ball is temporarily flattened. Suppose the maximum
depth of the dent is on the order of 1 cm. Compute an
order-of-magnitude estimate for the maximum acceleration of the ball while it is in contact with the pavement.
State your assumptions, the quantities you estimate, and
the values you estimate for them.
59. Kathy Kool buys a sports car that can accelerate at the
rate of 4.90 m/s2. She decides to test the car by racing
with another speedster, Stan Speedy. Both start from
rest, but experienced Stan leaves the starting line 1.00 s
before Kathy. Stan moves with a constant acceleration of
3.50 m/s2 and Kathy maintains an acceleration of
4.90 m/s2. Find (a) the time at which Kathy overtakes
Stan, (b) the distance she travels before she catches him,
and (c) the speeds of both cars at the instant she overtakes him.
60. A rock is dropped from rest into a well. (a) The sound of
the splash is heard 2.40 s after the rock is released from
rest. How far below the top of the well is the surface of
the water? The speed of sound in air (at the ambient temperature) is 336 m/s. (b) What If? If the travel time for
the sound is ignored, what percentage error is introduced
when the depth of the well is calculated?
61. ⅷ In a California driver’s handbook, the following data
were given about the minimum distance a typical car
travels in stopping from various original speeds. The
“thinking distance” represents how far the car travels during the driver’s reaction time, after a reason to stop can
be seen but before the driver can apply the brakes. The
“braking distance” is the displacement of the car after
the brakes are applied. (a) Is the thinking-distance data
= ThomsonNOW;
Ⅵ = symbolic reasoning;
ⅷ = qualitative reasoning
52
Chapter 2
Motion in One Dimension
consistent with the assumption that the car travels with
constant speed? Explain. (b) Determine the best value
of the reaction time suggested by the data. (c) Is the
braking-distance data consistent with the assumption
that the car travels with constant acceleration? Explain.
(d) Determine the best value for the acceleration suggested by the data.
Speed
(mi/h)
Thinking
Distance (ft)
Braking
Distance (ft)
Total Stopping
Distance (ft)
25
35
45
55
65
27
38
49
60
71
34
67
110
165
231
61
105
159
225
302
62. ⅷ Astronauts on a distant planet toss a rock into the air.
With the aid of a camera that takes pictures at a steady
rate, they record the height of the rock as a function of
time as given in the table in the next column. (a) Find the
average velocity of the rock in the time interval between
each measurement and the next. (b) Using these average
velocities to approximate instantaneous velocities at the
midpoints of the time intervals, make a graph of velocity
as a function of time. Does the rock move with constant
acceleration? If so, plot a straight line of best fit on the
graph and calculate its slope to find the acceleration.
Time (s)
Height (m)
Time (s)
Height (m)
0.00
0.25
0.50
0.75
1.00
1.25
1.50
1.75
2.00
2.25
2.50
5.00
5.75
6.40
6.94
7.38
7.72
7.96
8.10
8.13
8.07
7.90
2.75
3.00
3.25
3.50
3.75
4.00
4.25
4.50
4.75
5.00
7.62
7.25
6.77
6.20
5.52
4.73
3.85
2.86
1.77
0.58
63. Two objects, A and B, are connected by a rigid rod that has
length L. The objects slide along perpendicular guide rails
as shown in Figure P2.63. Assume A slides to the left with a
constant speed v. Find the velocity of B when u ϭ 60.0°.
y
B
x
L
y
v
u
O
A
x
Figure P2.63
Answers to Quick Quizzes
2.1 (c). If the particle moves along a line without changing
direction, the displacement and distance traveled over
any time interval will be the same. As a result, the magnitude of the average velocity and the average speed will be
the same. If the particle reverses direction, however, the
displacement will be less than the distance traveled. In
turn, the magnitude of the average velocity will be smaller
than the average speed.
2.2 (b). Regardless of your speeds at all other times, if your
instantaneous speed at the instant it is measured is higher
than the speed limit, you may receive a speeding ticket.
2.3 (b). If the car is slowing down, a force must be pulling in
the direction opposite to its velocity.
2.4 False. Your graph should look something like the following.
6
vx (m/s)
4
2
0
Ϫ2
10
20
30
40
t (s)
50
Ϫ4
Ϫ6
This vx–t graph shows that the maximum speed is about
5.0 m/s, which is 18 km/h (ϭ 11 mi/h), so the driver was
not speeding.
2 = intermediate;
3 = challenging;
Ⅺ = SSM/SG;
ᮡ
2.5 (c). If a particle with constant acceleration stops and its
acceleration remains constant, it must begin to move
again in the opposite direction. If it did not, the acceleration would change from its original constant value to
zero. Choice (a) is not correct because the direction of
acceleration is not specified by the direction of the velocity. Choice (b) is also not correct by counterexample; a
car moving in the Ϫx direction and slowing down has a
positive acceleration.
2.6 Graph (a) has a constant slope, indicating a constant
acceleration; it is represented by graph (e).
Graph (b) represents a speed that is increasing constantly but not at a uniform rate. Therefore, the acceleration must be increasing, and the graph that best indicates
that is (d).
Graph (c) depicts a velocity that first increases at a
constant rate, indicating constant acceleration. Then the
velocity stops increasing and becomes constant, indicating
zero acceleration. The best match to this situation is
graph (f).
2.7 (i), (e). For the entire time interval that the ball is in free
fall, the acceleration is that due to gravity. (ii), (d). While
the ball is rising, it is slowing down. After reaching the
highest point, the ball begins to fall and its speed
increases.
= ThomsonNOW;
Ⅵ = symbolic reasoning;
ⅷ = qualitative reasoning
3.1
Coordinate Systems
3.2
Vector and Scalar Quantities
3.3
Some Properties of Vectors
3.4
Components of a Vector and Unit Vectors
These controls in the cockpit of a commercial aircraft assist the pilot in
maintaining control over the velocity of the aircraft—how fast it is traveling and in what direction it is traveling—allowing it to land safely. Quantities that are defined by both a magnitude and a direction, such as velocity,
are called vector quantities. (Mark Wagner/Getty Images)
3
Vectors
In our study of physics, we often need to work with physical quantities that have
both numerical and directional properties. As noted in Section 2.1, quantities of
this nature are vector quantities. This chapter is primarily concerned with general
properties of vector quantities. We discuss the addition and subtraction of vector
quantities, together with some common applications to physical situations.
Vector quantities are used throughout this text. Therefore, it is imperative that
you master the techniques discussed in this chapter.
3.1
Coordinate Systems
Many aspects of physics involve a description of a location in space. In Chapter 2,
for example, we saw that the mathematical description of an object’s motion
requires a method for describing the object’s position at various times. In two
dimensions, this description is accomplished with the use of the Cartesian coordinate system, in which perpendicular axes intersect at a point defined as the origin
(Fig. 3.1). Cartesian coordinates are also called rectangular coordinates.
Sometimes it is more convenient to represent a point in a plane by its plane
polar coordinates (r, u) as shown in Active Figure 3.2a (see page 54). In this polar
coordinate system, r is the distance from the origin to the point having Cartesian
coordinates (x, y) and u is the angle between a fixed axis and a line drawn from
the origin to the point. The fixed axis is often the positive x axis, and u is usually
measured counterclockwise from it. From the right triangle in Active Figure 3.2b,
y
(x, y)
Q
P
(Ϫ3, 4)
(5, 3)
O
x
Figure 3.1 Designation of points
in a Cartesian coordinate system.
Every point is labeled with coordinates (x, y).
53
54
Chapter 3
Vectors
y
y
sin u = r
(x, y)
cos u = xr
r
tan u =
r
y
y
x
u
u
x
O
x
(a)
(b)
ACTIVE FIGURE 3.2
(a) The plane polar coordinates of a point are represented by the distance r and the angle u, where u is
measured counterclockwise from the positive x axis. (b) The right triangle used to relate (x, y) to (r, u).
Sign in at www.thomsonedu.com and go to ThomsonNOW to move the point and see the changes to the
rectangular and polar coordinates as well as to the sine, cosine, and tangent of angle u.
we find that sin u ϭ y/r and that cos u ϭ x/r. (A review of trigonometric functions
is given in Appendix B.4.) Therefore, starting with the plane polar coordinates of
any point, we can obtain the Cartesian coordinates by using the equations
x ϭ r cos u
(3.1)
y ϭ r sin u
(3.2)
Furthermore, the definitions of trigonometry tell us that
tan u ϭ
y
x
r ϭ 2x2 ϩ y2
(3.3)
(3.4)
Equation 3.4 is the familiar Pythagorean theorem.
These four expressions relating the coordinates (x, y) to the coordinates (r, u)
apply only when u is defined as shown in Active Figure 3.2a—in other words, when
positive u is an angle measured counterclockwise from the positive x axis. (Some
scientific calculators perform conversions between Cartesian and polar coordinates
based on these standard conventions.) If the reference axis for the polar angle u is
chosen to be one other than the positive x axis or if the sense of increasing u is chosen differently, the expressions relating the two sets of coordinates will change.
E XA M P L E 3 . 1
Polar Coordinates
The Cartesian coordinates of a point in the xy plane are (x, y) ϭ (Ϫ3.50, Ϫ2.50) m
as shown in Active Figure 3.3. Find the polar coordinates of this point.
y (m)
u
x (m)
r
(–3.50, –2.50)
ACTIVE FIGURE 3.3
(Example 3.1) Finding polar
coordinates when Cartesian
coordinates are given.
Sign in at www.thomsonedu.com
and go to ThomsonNOW to
move the point in the xy plane
and see how its Cartesian and
polar coordinates change.
SOLUTION
Conceptualize
problem.
The drawing in Active Figure 3.3 helps us conceptualize the
Categorize Based on the statement of the problem and the Conceptualize step,
we recognize that we are simply converting from Cartesian coordinates to polar
coordinates. We therefore categorize this example as a substitution problem. Substitution problems generally do not have an extensive Analyze step other than the
substitution of numbers into a given equation. Similarly, the Finalize step consists
primarily of checking the units and making sure that the answer is reasonable.
Therefore, for substitution problems, we will not label Analyze or Finalize steps.
Section 3.3
Some Properties of Vectors
55
r ϭ 2x2 ϩ y2 ϭ 2 1Ϫ3.50 m 2 2 ϩ 1Ϫ2.50 m 2 2 ϭ 4.30 m
Use Equation 3.4 to find r:
tan u ϭ
Use Equation 3.3 to find u:
y
Ϫ2.50 m
ϭ
ϭ 0.714
x
Ϫ3.50 m
u ϭ 216°
Notice that you must use the signs of x and y to find that the point lies in the third quadrant of the coordinate system. That is, u ϭ 216°, not 35.5°.
3.2
Vector and Scalar Quantities
We now formally describe the difference between scalar quantities and vector
quantities. When you want to know the temperature outside so that you will know
how to dress, the only information you need is a number and the unit “degrees C”
or “degrees F.” Temperature is therefore an example of a scalar quantity:
A scalar quantity is completely specified by a single value with an appropriate
unit and has no direction.
Other examples of scalar quantities are volume, mass, speed, and time intervals.
The rules of ordinary arithmetic are used to manipulate scalar quantities.
If you are preparing to pilot a small plane and need to know the wind velocity,
you must know both the speed of the wind and its direction. Because direction is
important for its complete specification, velocity is a vector quantity:
A vector quantity is completely specified by a number and appropriate units
plus a direction.
Another example of a vector quantity is displacement, as you know from Chapter 2. Suppose a particle moves from some point Ꭽ to some point Ꭾ along a
straight path as shown in Figure 3.4. We represent this displacement by drawing an
arrow from Ꭽ to Ꭾ, with the tip of the arrow pointing away from the starting
point. The direction of the arrowhead represents the direction of the displacement, and the length of the arrow represents the magnitude of the displacement.
If the particle travels along some other path from Ꭽ to Ꭾ, such as shown by the
broken line in Figure 3.4, its displacement is still the arrow drawn from Ꭽ to Ꭾ.
Displacement depends only on the initial and final positions, so the displacement
vector is independent of the path taken by the particle between these two points.
S
In this text, we use a boldface letter with an arrow over the letter, such as A, to
represent a vector. Another common notation for vectors with which youS should
be familiar is a simple
boldface character: A. The magnitude of the vector A is writS
ten either A or 0 A 0 . The magnitude of a vector has physical units, such as meters
for displacement or meters per second for velocity. The magnitude of a vector is
always a positive number.
Quick Quiz 3.1 Which of the following are vector quantities and which are scalar
quantities? (a) your age
3.3
(b) acceleration
(c) velocity
(d) speed
(e) mass
Some Properties of Vectors
In this section, we shall investigate general properties of vectors representing physical quantities. We also discuss how to add and subtract vectors using both algebraic and geometric methods.
Ꭾ
Ꭽ
Figure 3.4 As a particle moves from
Ꭽ to Ꭾ along an arbitrary path represented by the broken line, its displacement is a vector quantity shown
by the arrow drawn from Ꭽ to Ꭾ.
56
Chapter 3
Vectors
Equality of Two Vectors
y
S
O
x
Figure 3.5 These four vectors are
equal because they have equal
lengths and point in the same
direction.
PITFALL PREVENTION 3.1
Vector Addition versus Scalar Addition
S
S
S
For many purposes, two vectors A and B may be defined to be equalS if they
have
S
the same magnitude
and
if
they
point
in
the
same
direction.
That
is,
A
ϭ
B
only
if
S
S
A ϭ B and if A and B point in the same direction along parallel lines. For example, all the vectors in Figure 3.5 are equal even though they have different starting
points. This property allows us to move a vector to a position parallel to itself in a
diagram without affecting the vector.
S
Notice that A ϩ B ϭ C is very different from A ϩ B ϭ C. The first
equation is a vector sum, which
must be handled carefully, such as
with the graphical method. The
second equation is a simple algebraic addition of numbers that is
handled with the normal rules of
arithmetic.
Adding Vectors
The rules for
adding vectors
are conveniently
described by a graphical method. To
S
S
S
add vector B to vector A, first draw vector A on graph paper, withSits magnitude
represented by a convenient length scale, Sand then draw vector B to the same
scale, with its tail
starting
from the tip of A, as shown in Active
Figure 3.6. The
S
S
S
S
S
resultant vector R ϭ A ϩ B is the vector drawn from the tail of A to the tip of B.
A geometric construction can also be used to add more than two vectors as
is shown Sin Figure
3.7 for the case of four vectors. The resultant vector
S
S
S
S
S
R ϭ A ϩ B ϩ C ϩ D is the vector that completes the polygon. In other words, R is
the vector drawn from the tail of the first vector to the tip of the last vector. This
technique for adding vectors is often called the “head to tail method.”
When two vectors are added, the sum is independent of the order of the addition. (This fact may seem trivial, but as you will see in Chapter 11, the order is
important when vectors are multiplied. Procedures for multiplying vectors are discussed in Chapters 7 and 11). This property, which can be seen from the geometric construction in Figure 3.8, is known as the commutative law of addition:
S
S
S
S
AϩBϭBϩA
(3.5)
When three or more vectors are added, their sum is independent of the way in
which the individual vectors are grouped together. A geometric proof of this rule
for three vectors is given in Figure 3.9. This property is called the associative law
of addition:
A ϩ 1B ϩ C 2 ϭ 1A ϩ B 2 ϩ C
S
S
S
S
S
S
(3.6)
In summary, a vector quantity has both magnitude and direction and also obeys
the laws of vector addition as described in Figures 3.6 to 3.9. When two or more
vectors are added together, they must all have the same units and they must all be
the same type of quantity. It would be meaningless to add a velocity vector (for
example, 60 km/h to the east) to a displacement vector (for example, 200 km to
the north) because these vectors represent different physical quantities. The same
+B
B
ϭ
A
R
ϩ
B
+A
C
=B
B
=A
C
B
ϩ
Aϩ
B
Rϭ
ϩ
D
A
D
R
A
B
ACTIVE FIGURE 3.6
S
S
When vector B
is added to vector A,
S
the resultant R isS the vector that
runs
S
from the tail of A to the tip of B.
Sign in at www.thomsonedu.com and
go to ThomsonNOW to explore the
addition of two vectors.
A
Figure 3.7 Geometric construction
for summing four vectors. The resulS
tant vector R is by definition the one
that completes the polygon.
A
Figure 3.8 This construction shows
S
S
S
S
that A ϩ B ϭ B ϩ A or, in other
words, that vector addition is
commutative.
Section 3.3
C
ϩ
B)
ϩ
(B
AϩB
(A
ϩ
BϩC
A
C
ϩ
C)
C
B
B
A
A
Figure 3.9
Geometric constructions for verifying the associative law of addition.
rule also applies to scalars. For example, it would be meaningless to add time
intervals to temperatures.
Negative of a Vector
S
S
The negative of the vector A is defined as the vector that when added to A gives
S
S
S
S
zero for the vector sum. That is, A ϩ 1ϪA 2 ϭ 0. The vectors A and ϪA have the
same magnitude but point in opposite directions.
Subtracting Vectors
The operation of vector subtraction makes use of the definition of the negative of
S
S
S
S
a vector. We define the operation A Ϫ B as vector ϪB added to vector A:
A Ϫ B ϭ A ϩ 1ϪB 2
S
S
S
S
(3.7)
The geometric construction for subtracting two vectors in this way is illustrated in
Figure 3.10a.
Another way of looking at vector subtraction is to notice that the difference
S
S
S
S
vector
A Ϫ B between two vectors A and B is what you have to add to the second
S
S
to obtain the first. In this case, as Figure 3.10b shows, the vector A Ϫ B points
from the tip of the second vector to the tip of the first.
Multiplying a Vector by a Scalar
S
S
If vector A is multiplied by a positive
scalar quantity m, the product
m A is a vector
S
S
that has the same direction as A and magnitude
m
A.
If
vector
A
is
multiplied
by a
S
S
negative scalar quantity
Ϫm,
the
product
Ϫm
A
is
directed
opposite
A
.
For
examS
S
S
ple, the vectorS 5A is five times as long as SA and points in the same direction as SA;
1
the vector Ϫ 3 A is one-third the length of A and points in the direction opposite A.
B
A
ϪB
CϭAϪB
CϭAϪB
B
A
(a)
(b)
ϪB is
Figure 3.10 (a) This construction
shows how to subtract vector B from vector A.SThe vector
S
S
equal in magnitude to vector B and points in the
opposite
direction.
To subtract B from A, apply the
S
S
S
A along
rule of vector addition to
the combination
of A and ϪB: first draw
some convenient axis and
S
S
S
S
then place the tail of ϪB at the tip of A, and
CS is the
difference A Ϫ B. (b) A second Sway of looking
at
S
S
S
vector subtraction. The difference vector C ϭ A Ϫ B is the vector that we must add to B to obtain A.
S
S
S
Some Properties of Vectors
57
58
Chapter 3
Vectors
Quick Quiz 3.2 The magnitudes of two vectors A and B are A ϭ 12 units and
S
S
B ϭ 8 units. Which of the following pairs of numbers represents theS largest
and
S
S
smallest possible values for the magnitude of the resultant vector R ϭ A ϩ B?
(a) 14.4 units, 4 units (b) 12 units, 8 units (c) 20 units, 4 units (d) none of
these answers
S
S
Quick Quiz 3.3 If vector B is added to vector A, which two of the
following
S
S
choices must be true for the resultant vector
to
be equal to zero? (a) A and B are
S
S
parallel and
in
the
same
direction.
(b)
A
and
B
are
parallel
and in opposite direcS
S
S
S
tions. (c) A and B have the same magnitude. (d) A and B are perpendicular.
E XA M P L E 3 . 2
A Vacation Trip
A car travels 20.0 km due north and then 35.0 km in
a direction 60.0° west of north as shown in Figure
3.11a. Find the magnitude and direction of the car’s
resultant displacement.
y (km)
y (km)
N
40
B
60.0Њ
W
S
20
SOLUTION
R
S
Categorize We can categorize this example as a simple analysis problem in vector addition. The displaceS
ment R is the resultant when the two individual disS
S
placements A and B are added. We can further
categorize it as a problem about the analysis of triangles, so we appeal to our expertise in geometry and
trigonometry.
R
A
20
u
S
Conceptualize The vectors A and B drawn in Figure
3.11a help us conceptualize the problem.
40
E
b A
Ϫ20
0
x (km)
B
b
Ϫ20
0
(a)
x (km)
(b)
Figure 3.11 (Example 3.2)
(a)
Graphical
method for finding the resulS
S
S
tant displacement
vector R ϭ A ϩ B. (b)S Adding the vectors in reverse
S
S
order 1B ϩ A 2 gives the same result for R.
Analyze In this example, we show two ways to analyze the problem of finding the resultant of two vectors. SThe first
way is to solve the problem geometrically, using graph paper and a protractor to measure the magnitude of R and its
direction in Figure 3.11a. (In fact, even when you know you are going to be carrying out a calculation, you should
sketch the vectors to check your results.) With an ordinary ruler and protractor, a large diagram typically gives
answers to two-digit but not to three-digit precision.
S
The second way to solve the problem is to analyze it algebraically. The magnitude of R can be obtained from the
law of cosines as applied to the triangle (see Appendix B.4).
R ϭ 2A 2 ϩ B 2 Ϫ 2AB cos u
Use R 2 ϭ A2 ϩ B 2 Ϫ 2AB cos u from the
law of cosines to find R:
Substitute numerical values, noting that
u ϭ 180° Ϫ 60° ϭ 120°:
Use the law of sines (Appendix
B.4) to
S
find the direction of R measured from
the northerly direction:
R ϭ 2 120.0 km 2 2 ϩ 135.0 km 2 2 Ϫ 2 120.0 km 2 135.0 km 2 cos 120°
ϭ 48.2 km
sin b
sin u
ϭ
B
R
sin b ϭ
B
35.0 km
sin u ϭ
sin 120° ϭ 0.629
R
48.2 km
b ϭ 38.9°
Section 3.4
Components of a Vector and Unit Vectors
59
The resultant displacement of the car is 48.2 km in a direction 38.9° west of north.
Finalize Does the angle b that we calculated agree
with an estimate made by looking at Figure 3.11a or
with an actual angle measured from the diagram using
the graphical
method? Is it reasonableS that the
magniS
S
tude of R
is
larger
than
that
of
both
A
and
B
?
Are
the
S
units of R correct?
Although the graphical method of adding vectors
works well, it suffers from two disadvantages. First, some
people find using the laws of cosines and sines to be
awkward. Second, a triangle only results if you are
adding two vectors. If you are adding three or more vectors, the resulting geometric shape is usually not a triangle. In Section 3.4, we explore a new method of adding
vectors that will address both of these disadvantages.
What If? Suppose the trip were taken with the two vectors in reverse order: 35.0 km at 60.0° west of north first and
then 20.0 km due north. How would the magnitude and the direction of the resultant vector change?
Answer They would not change. The commutative law for vector addition tells us that the order of vectors in an
addition is irrelevant. Graphically, Figure 3.11b shows that the vectors added in the reverse order give us the same
resultant vector.
3.4
Components of a Vector and Unit Vectors
The graphical method of adding vectors is not recommended whenever high accuracy is required or in three-dimensional problems. In this section, we describe a
method of adding vectors that makes use of the projections of vectors along coordinate axes. These projections are called the components of the vector or its rectangular components.SAny vector can be completely described by its components.
Consider a vector A lying in the xy plane and making an arbitrary angle u with
the positive x axis as shown in Figure
3.12a. This vector can be expressed
as the
S
S
sum of two other component vectors Ax , which is parallel to the x axis, and Ay , which
is parallel to the y axis.SFrom
Figure
3.12b, we see that the three vectors form a
S
S
right triangle
and
that
A
ϭ
A
ϩ
A
.
We
shall often refer to the “components of a
x
y
S
vector A,” written Ax and Ay S(without the boldface notation). The component Ax
represents the projection
of A along the x axis, and the component Ay represents
S
the projection of A along the y axis. These components canS be positive or negative. The component Ax is positive
if the component vector Ax points in the posiS
tive x direction and is negative if Ax points in the negative x direction. The same is
true for the component Ay.
From Figure 3.12 and the definition of sine and cosine,
we see that cos u ϭ
S
Ax/A and that sin u ϭ Ay/A. Hence, the components of A are
Ax ϭ A cos u
(3.8)
Ay ϭ A sin u
(3.9)
PITFALL PREVENTION 3.2
Component Vectors versus Components
S
S
The vectors Ax and
Ay are the comS
ponent vectors of A. They should not
be confused with the quantities
Ax and Ay , which we shall always
S
refer to as the components of A.
ᮤ
S
Components of the vector A
PITFALL PREVENTION 3.3
x and y Components
y
y
A
A
Ay
u
u
x
O
O
Ax
(a)
Ay
x
Ax
(b)
S
S
S
Figure 3.12 (a) A vector A lying
in the xy plane can be represented by its component
vectors Ax and Ay.
S
S
(b) The y componentSvector Ay can be moved to the right so that it adds to Ax. The vector sum of the
component vectors is A. These three vectors form a right triangle.
Equations 3.8 and 3.9 associate the
cosine of the angle with the x component and the sine of the angle
with the y component. This association is true only because we measured the angle u with respect to
the x axis, so do not memorize
these equations. If u is measured
with respect to the y axis (as in
some problems), these equations
will be incorrect. Think about
which side of the triangle containing the components is adjacent to
the angle and which side is opposite and then assign the cosine and
sine accordingly.
60
Chapter 3
Vectors
The magnitudes of these components are the lengths of the two sides of a right triS
angle with a hypotenuse of length A. Therefore, the magnitude and direction of A
are related to its components through the expressions
y
Ax negative
Ax positive
Ay positive
Ay positive
Ax negative
Ax positive
Ay negative
Ay negative
x
Figure 3.13 TheSsigns of the components of a vector A depend on the
quadrant in which the vector is
located.
y
x
ˆj
ˆi
kˆ
z
A ϭ 2Ax 2 ϩ Ay 2
u ϭ tanϪ1 a
Ay
b
Ax
(3.10)
(3.11)
Notice that the signs of the components Ax and Ay depend on the angle u. For
example, if u ϭ 120°, Ax is negative and Ay is positive. If u ϭ 225°, both Ax and Ay
S
are negative. Figure 3.13 summarizes the signs of the components when A lies in
the various quadrants.
S
When solving problems, you can specify a vector A either with its components
Ax and Ay or with its magnitude and direction A and u.
Suppose you are working a physics problem that requires resolving a vector into
its components. In many applications, it is convenient to express the components
in a coordinate system having axes that are not horizontal and vertical but that are
still perpendicular to each other. For example, we will consider the motion of
objects sliding down inclined planes. For these examples, it is often convenient to
orient the x axis parallel to the plane and the y axis perpendicular to the plane.
Quick Quiz 3.4 Choose the correct response to make the sentence true: A component of a vector is (a) always, (b) never, or (c) sometimes larger than the magnitude of the vector.
(a)
y
Unit Vectors
A y ˆj
A
x
A x ˆi
(b)
ACTIVE FIGURE 3.14
(a) The unit vectors ˆi , ˆj , and ˆ
k
are directed along the x, y, and
zS axes, respectively. (b) Vector
A ϭ Axˆi ϩ Ayˆj lying in the xy plane
has components Ax and Ay.
Sign in at www.thomsonedu.com and
go to ThomsonNOW to rotate the
coordinate axes in three-dimensional
space and
view a representation of
S
vector A in three dimensions.
Vector quantities often are expressed in terms of unit vectors. A unit vector is a
dimensionless vector having a magnitude of exactly 1. Unit vectors are used to
specify a given direction and have no other physical significance. They are used
solely as a bookkeeping convenience in describing a direction in space. We shall
use the symbols ˆi , ˆj , and ˆ
k to represent unit vectors pointing in the positive x, y,
and z directions, respectively. (The “hats,” or circumflexes, on the symbols are a
standard notation for unit vectors.) The unit vectors ˆi , ˆj , and ˆ
k form a set of
mutually perpendicular vectors in a right-handed coordinate system as shown in
Active Figure 3.14a. The magnitude of each unit vector equals 1; that is,
0 ˆi 0 ϭ 0 ˆj 0 ϭ 0 ˆ
k 0 ϭ 1. S
Consider a vector A lying in the xy plane as shown in Active Figure 3.14b. The
product
of the component Ax and the unit vector ˆi is the component
vector
S
S
S
Ax ϭ Axˆi , which lies on the x axis and has magnitude 0 Ax 0 . Likewise, Ay ϭ Ay j is the
component vector of magnitude
0 Ay 0 lying on the y axis. Therefore, the unit–vector
S
notation for the vector A is
A ϭ Axˆi ϩ Ayˆj
S
For example, consider a point lying in the xy plane and having Cartesian coordiS
nates (x, y) as in Figure 3.15. The point can be specified by the position vector r ,
which in unit–vector form is given by
y
(x, y)
r ϭ xˆi ϩ yˆj
S
r
x ˆi
O
(3.12)
y ˆj
x
Figure 3.15 The point whose Cartesian coordinates are (x, y) can be
represented by the position vector
S
r ϭ xˆi ϩ yˆj .
(3.13)
S
This notation tells us that the components of r are the coordinates x and y.
Now let us see how to use components to add vectors whenS the graphical
S
method is not sufficiently accurate.
Suppose we wish to add vector B to vector A in
S
Equation 3.12, where vector B has components Bx and By . Because of the bookkeeping convenience of the unitS vectors,
all we do is add the x and y components
S
S
separately. The resultant vector R ϭ A ϩ B is
R ϭ 1Axˆi ϩ Ayˆj 2 ϩ 1Bxˆi ϩ Byˆj 2
S
Section 3.4
61
Components of a Vector and Unit Vectors
or
y
R ϭ 1A x ϩ Bx 2 ˆi ϩ 1A y ϩ By 2 ˆj
S
(3.14)
Because R ϭ Rxˆi ϩ Ryˆj , we see that the components of the resultant vector are
S
By
Rx ϭ Ax ϩ Bx
(3.15)
Ry ϭ Ay ϩ By
Ay
S
The magnitude of R and the angle it makes with the x axis from its components
are obtained using the relationships
R ϭ 2Rx2 ϩ Ry 2 ϭ 2 1Ax ϩ Bx 2 2 ϩ 1Ay ϩ By 2 2
tan u ϭ
Ry
Rx
ϭ
Ay ϩ By
(3.17)
Ax ϩ Bx
A ϭ Axˆi ϩ Ayˆj ϩ Az ˆ
k
(3.18)
B ϭ Bx ˆi ϩ By ˆj ϩ Bz ˆ
k
(3.19)
R ϭ 1Ax ϩ Bx 2 ˆi ϩ 1Ay ϩ By 2 ˆj ϩ 1Az ϩ Bz 2 ˆ
k
(3.20)
S
S
S
The sum of A and B is
S
B
A
x
Bx
Ax
(3.16)
We can check this addition by components with a geometric construction as
shown in Figure 3.16. Remember to note the signs of the components when using
either the algebraic or the graphical method.
At times, we need to consider situations involving motion in three component
directions. The extension of our methods to three-dimensional vectors is straightS
S
forward. If A and B both have x, y, and z components, they can be expressed in the
form
S
R
Ry
Rx
Figure 3.16 This geometric construction for the sum of two vectors
shows the relationship between
the
S
components of the resultant R and
the components of the individual
vectors.
PITFALL PREVENTION 3.4
Tangents on Calculators
Equation 3.17 involves the calculation of an angle by means of a tangent function. Generally, the
inverse tangent function on calculators provides an angle between
Ϫ90° and ϩ90°. As a consequence,
if the vector you are studying lies in
the second or third quadrant, the
angle measured from the positive
x axis will be the angle your calculator returns plus 180°.
Notice that Equation 3.20 differs from Equation 3.14: in Equation 3.20, the resultant
S
vector also has a z component Rz ϭ Az ϩ Bz. If a vector R has x, y, and z compoS
nents, the magnitude of the vector is R ϭ 2Rx2 ϩ Ry 2 ϩ Rz 2. The angle ux that R
makes with the x axis is found from the expression cos ux ϭ Rx/R, with similar
expressions for the angles with respect to the y and z axes.
Quick Quiz 3.5 For which of the following vectors Sis the magnitude ofS the vector equal to one of the components of the vector? (a) A ϭ 2ˆi ϩ 5ˆj (b) B ϭ Ϫ3ˆj
S
ˆ
(c) C ϭ ϩ5k
E XA M P L E 3 . 3
The Sum of Two Vectors
S
S
Find the sum of two vectors A and B lying in the xy plane and given by
A ϭ 12.0ˆi ϩ 2.0ˆj 2 m¬¬and¬¬B ϭ 12.0ˆi Ϫ 4.0ˆj 2 m
S
S
SOLUTION
Conceptualize
You can conceptualize the situation by drawing the vectors on graph paper.
S
Categorize We categorize this example as a simple substitution problem. Comparing this expression for A with the
S
k , we see that Ax ϭ 2.0 m and Ay ϭ 2.0 m. Likewise, Bx ϭ 2.0 m and By ϭ
general expression A ϭ Axˆi ϩ Ayˆj ϩ Azˆ
Ϫ4.0 m.
S
Use Equation 3.14 to obtain the resultant vector R:
S
Evaluate the components of R:
R ϭ A ϩ B ϭ 12.0 ϩ 2.02 ˆi m ϩ 12.0 Ϫ 4.02 ˆj m
S
S
S
Rx ϭ 4.0 m¬¬Ry ϭ Ϫ2.0 m
62
Chapter 3
Vectors
R ϭ 2Rx2 ϩ Ry 2 ϭ 2 14.0 m2 2 ϩ 1Ϫ2.0 m2 2 ϭ 220 m ϭ 4.5 m
S
Use Equation 3.16 to find the magnitude of R:
S
tan u ϭ
Find the direction of R from Equation 3.17:
Ry
Rx
ϭ
Ϫ2.0 m
ϭ Ϫ0.50
4.0 m
Your calculator likely gives the answer Ϫ27° for u ϭ tanϪ1(Ϫ0.50). This answer is correct if we interpret it to mean
27° clockwise from the x axis. Our standard form has been to quote the angles measured counterclockwise from the
ϩx axis, and that angle for this vector is u ϭ 333°
E XA M P L E 3 . 4
The Resultant Displacement
S
ˆ 2 cm, ¢rS2 ϭ 123ˆi Ϫ 14ˆj Ϫ 5.0k
ˆ 2 cm,
A particle undergoes three consecutive displacements: ¢r 1 ϭ 115ˆi ϩ 30ˆj ϩ 12k
S
and ¢r 3 ϭ 1Ϫ13ˆi ϩ 15ˆj 2 cm. Find the components of the resultant displacement and its magnitude.
SOLUTION
Conceptualize Although x is sufficient to locate a point in one dimension, we need a vector Sr to locate a point in
S
two or three dimensions. The notation ¢r is a generalization of the one-dimensional displacement ⌬x in Equation
2.1. Three-dimensional displacements are more difficult to conceptualize than those in two dimensions because the
latter can be drawn on paper.
For this problem, let us imagine that you start with your pencil at the origin of a piece of graph paper on which
you have drawn x and y axes. Move your pencil 15 cm to the right along the x axis, then 30 cm upward along the y
axis, and then 12 cm perpendicularly toward you away from the graph paper. This procedure provides the displacement
S
described by ¢r 1. From this point, move your pencil 23 cm to the right parallel to the x axis, then 14 cm parallel to
the graph paper in the Ϫy direction, and then 5.0 cm perpendicularly away from you toward the graph paper. You
S
S
are now at the displacement from the origin described by ¢r 1 ϩ ¢r 2. From this point, move your pencil 13 cm to
the left in the Ϫx direction, and (finally!) 15 cm parallel to the graph paper along the y axis. Your final position is
S
S
S
at a displacement ¢ r 1 ϩ ¢ r 2 ϩ ¢ r 3 from the origin.
Categorize Despite the difficulty in conceptualizing in three dimensions, we can categorize this problem as a substitution problem because of the careful bookkeeping methods that we have developed for vectors. The mathematical manipulation keeps track of this motion along the three perpendicular axes in an organized, compact way, as we see below.
To find the resultant displacement,
add the three vectors:
¢r ϭ ¢r 1 ϩ ¢r 2 ϩ ¢r 3
S
S
S
S
ϭ 115 ϩ 23 Ϫ 13 2 ˆi cm ϩ 130 Ϫ 14 ϩ 15 2 ˆj cm ϩ 112 Ϫ 5.0 ϩ 02 ˆ
k cm
ˆ 2 cm
ϭ 125ˆi ϩ 31ˆj ϩ 7.0k
Find the magnitude of the resultant
vector:
R ϭ 2Rx2 ϩ Ry 2 ϩ Rz 2
ϭ 2 125 cm2 2 ϩ 131 cm2 2 ϩ 17.0 cm 2 2 ϭ 40 cm
Section 3.4
E XA M P L E 3 . 5
Taking a Hike
A hiker begins a trip by first walking 25.0 km southeast from her car. She stops
and sets up her tent for the night. On the second day, she walks 40.0 km in a
direction 60.0° north of east, at which point she discovers a forest ranger’s tower.
y (km)
N
W
(A) Determine the components of the hiker’s displacement for each day.
20
SOLUTION
10
Conceptualize We conceptualize the problem by drawing a sketch as in Figure
S
3.17. SIf we denote the displacement vectors on the first and second days by A
and B, respectively, and use the car as the origin of coordinates, we obtain the
vectors shown in Figure 3.17.
S
Categorize Drawing the resultant R, we can now categorize this problem as
one we’ve solved before: an addition of two vectors. You should now have a hint
of the power of categorization in that many new problems are very similar to
problems we have already solved if we are careful to conceptualize them. Once
we have drawn the displacement vectors and categorized the problem, this problem is no longer about a hiker, a walk, a car, a tent, or a tower. It is a problem
about vector addition, one that we have already solved.
Analyze
63
Components of a Vector and Unit Vectors
0
Car
Ϫ10
Ϫ20
E
Tower
S
R
B
x (km)
45.0Њ 20
A
30
40
50
60.0Њ
Tent
Figure 3.17 (Example 3.5) The
total displacement
of the hiker is the
S
S
S
vector R ϭ A ϩ B.
S
Displacement A has a magnitude of 25.0 km and is directed 45.0° below the positive x axis.
A x ϭ A cos 1Ϫ45.0°2 ϭ 125.0 km 2 10.7072 ϭ
S
Find the components of A using Equations 3.8 and 3.9:
17.7 km
A y ϭ A sin 1Ϫ45.0°2 ϭ 125.0 km 2 1Ϫ0.7072 ϭ Ϫ17.7 km
The negative value of Ay indicates the hiker walks in the negative y direction on the first day. The signs of Ax and Ay
also are evident from Figure 3.17.
Bx ϭ B cos 60.0° ϭ 140.0 km 2 10.5002 ϭ 20.0 km
S
Find the components of B using Equations 3.8 and 3.9:
By ϭ B sin 60.0° ϭ 140.0 km 2 10.8662 ϭ 34.6 km
S
S
(B) Determine the components of the hiker’s resultant displacement R for the trip. Find an expression for R in
terms of unit vectors.
SOLUTION
Use Equation 3.15 to find the components of the resulS
S
S
tant displacement R ϭ A ϩ B:
Rx ϭ Ax ϩ Bx ϭ 17.7 km ϩ 20.0 km ϭ 37.7 km
Ry ϭ Ay ϩ By ϭ Ϫ17.7 km ϩ 34.6 km ϭ 16.9 km
R ϭ 137.7ˆi ϩ 16.9ˆj 2 km
S
Write the total displacement in unit–vector form:
Finalize Looking at the graphical representation in Figure 3.17,
we estimate the position of the tower to be about
S
R
(38 km, 17 km), which
is
consistent
with
the
components
of
in
our
result for the final position of the hiker. Also,
S
both components of R are positive, putting the final position in the first quadrant of the coordinate system, which is
also consistent with Figure 3.17.
What If? After reaching the tower, the hiker wishes to return to her car along a single straight line. What are the
components of the vector representing this hike? What should the direction of the hike be?
Answer
S
S
The desired vector Rcar is the negative of vector R:
Rcar ϭ ϪR ϭ 1Ϫ37.7ˆi Ϫ 16.9ˆj 2 km
S
S
The heading is found by calculating the angle that the vector makes with the x axis:
tan u ϭ
Rcar,y
Rcar,x
ϭ
Ϫ16.9 km
ϭ 0.448
Ϫ37.7 km
which gives an angle of u ϭ 204.1°, or 24.1° south of west.