Physiology: Cardiac output, blood flow, and blood pressure
Bạn đang xem bản rút gọn của tài liệu. Xem và tải ngay bản đầy đủ của tài liệu tại đây (1.7 MB, 69 trang )
Physiology
Cardiac Output, Blood
Flow, and Blood
Pressure
ww.cambodiamed.com
Cardiac Output
Cardiac Output (CO)
Is volume of blood pumped/min by each ventricle
Heart Rate (HR) = 70 beats/min
Stroke volume (SV) = blood pumped/beat by
each ventricle
◦ Average is 70-80 ml/beat
CO = SV x HR
Total blood volume is about 5.5L
ww.cambodiamed.com
14-4
Regulation of Cardiac Rate
• Without neuronal influences, SA node will drive
heart at rate of its spontaneous activity
• Normally Symp & Parasymp activity influence
HR (chronotropic effect)
• Mechanisms that affect HR: chronotropic effect
• Positive increases; negative decreases
• Autonomic innervation of SA node is main
controller of HR
• Symp & Parasymp nerve fibers modify rate of
spontaneous depolarization
14-5
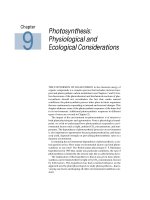
Regulation of Cardiac Rate continued
• NE & Epi stimulate
opening of
pacemaker HCN
channels
Fig 14.1
• This depolarizes SA
faster, increasing HR
• ACh promotes
opening of K+
channels
• The resultant K+
outflow counters Na+
influx, slows
depolarization &
decreasing HR
14-6
Regulation of Cardiac Rate continued
• Vagus nerve:
• Decrease activity: increases heart rate
• Increased activity: slows heart
• Cardiac control center of medulla coordinates activity of
autonomic innervation
• Sympathetic endings in atria & ventricles can stimulate
increased strength of contraction
14-7
14-8
Stroke Volume
• Is determined by 3 variables:
• End diastolic volume (EDV) = volume of blood in ventricles at end
of diastole
• Total peripheral resistance (TPR) = impedance to blood flow in
arteries
• Contractility = strength of ventricular contraction
14-9
Regulation of Stroke Volume
• EDV is workload (preload) on heart prior to contraction
• SV is directly proportional to preload & contractility
• Strength of contraction varies directly with EDV
• Total peripheral resistance = afterload which impedes
ejection from ventricle
• SV is inversely proportional to TPR
• Ejection fraction is SV/ EDV (~80ml/130ml=62%)
• Normally is 60%; useful clinical diagnostic tool
14-10
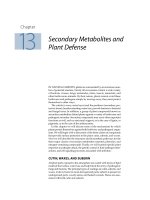
Frank-Starling Law of the Heart
• States that strength
of ventricular
contraction varies
directly with EDV
Fig 14.2
• Is an intrinsic
property of
myocardium
• As EDV increases,
myocardium is
stretched more,
causing greater
contraction & SV
14-11
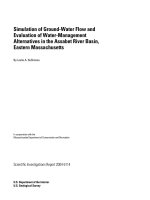
Frank-Starling Law of the Heart
continued
• (a) is state of myocardial
sarcomeres just before
filling
▫ Actins overlap, actin-myosin
interactions are reduced &
contraction would be weak
• In (b, c & d) there is
increasing interaction of
actin & myosin allowing
more force to be
developed
Fig 14.3
14-12
• At any given EDV,
contraction depends
upon level of
sympathoadrenal
activity
• NE & Epi produce an
increase in HR &
contraction (positive
inotropic effect)
• Due to increased Ca2+
in sarcomeres
Fig 14.4
14-13
Extrinsic Control of Contractility
• Parasympathetic stimulation
• Negative chronotropic effect
• Through innervation of the SA node and myocardial cell
• Slower heart rate means increased EDV
• Increases SV through Frank-Starling law
Fig 14.5
14-14
Venous Return
• Is return of blood to heart
via veins
• Controls EDV & thus SV &
CO
• Dependent on:
• Blood volume & venous
pressure
• Vasoconstriction caused
by Symp
• Skeletal muscle pumps
• Pressure drop during
inhalation
Fig 14.7
14-15
Venous Return continued
• Veins hold most of
blood in body (70%)
& are thus called
capacitance vessels
• Have thin walls &
stretch easily to
accommodate more
blood without
increased pressure
(=higher compliance)
• Have only 010 mm Hg pressure
Fig 14.6
14-16
Blood Volume
• Constitutes small
fraction of total body
fluid
• 2/3 of body H20 is inside
cells (intracellular
compartment)
• 1/3 total body H20 is in
extracellular
compartment
• 80% of this is interstitial
fluid; 20% is blood
plasma
Fig 14.8
14-18
Exchange of Fluid between
Capillaries & Tissues
• Distribution of ECF between blood & interstitial
compartments is in state of dynamic equilibrium
• Movement out of capillaries is driven by hydrostatic
pressure exerted against capillary wall
• Promotes formation of tissue fluid
• Net filtration pressure= hydrostatic pressure in capillary (17-37
mm Hg) - hydrostatic pressure of ECF (1 mm Hg)
14-19
Exchange of Fluid between
Capillaries & Tissues
• Movement also affected by colloid osmotic pressure
• = osmotic pressure exerted by proteins in fluid
• Difference between osmotic pressures in & outside of
capillaries (oncotic pressure) affects fluid movement
• Plasma osmotic pressure = 25 mm Hg; interstitial osmotic pressure =
0 mm Hg
14-20
Overall Fluid Movement
• Is determined by net filtration pressure & forces opposing
it (Starling forces)
• Pc + Pi (fluid out) - Pi + Pp (fluid in)
• Pc = Hydrostatic pressure in capillary
• Pi = Colloid osmotic pressure of interstitial fluid
• Pi = Hydrostatic pressure in interstitial fluid
• Pp = Colloid osmotic pressure of blood plasma
14-21
Fig 14.9
14-22
Edema
• Normally filtration, osmotic reuptake, & lymphatic
drainage maintain proper ECF levels
• Edema is excessive accumulation of ECF resulting
from:
•
•
•
•
High blood pressure
Venous obstruction
Leakage of plasma proteins into ECF
Myxedema (excess production of glycoproteins in
extracellular matrix) from hypothyroidism
• Low plasma protein levels resulting from liver disease
• Obstruction of lymphatic drainage
14-23
Regulation of Blood Volume by Kidney
• Urine formation begins with filtration of plasma in
glomerulus
• Filtrate passes through & is modified by nephron
• Volume of urine excreted can be varied by changes in
reabsorption of filtrate
• Adjusted according to needs of body by action of hormones
14-24
ADH (vasopressin)
• ADH released by Post Pit
when osmoreceptors detect
high osmolality
• From excess salt intake
or dehydration
• Causes thirst
• Stimulates H20
reabsorption from urine
• ADH release inhibited by
low osmolality
Fig 14.11
14-25
Aldosterone
• Is steroid hormone secreted by adrenal cortex
• Helps maintain blood volume & pressure through
reabsorption & retention of salt & water
• Release stimulated by salt deprivation, low blood
volume, & pressure
14-26