Ebook Introduction to spectroscopy (4th edition) Part 2
Bạn đang xem bản rút gọn của tài liệu. Xem và tải ngay bản đầy đủ của tài liệu tại đây (7.93 MB, 397 trang )
Pavia | Lampman | Kriz | Vyvyan
Introduction to
Spec t ros co p y
Gain an understanding of
t h e l a t e s t a d va n c e s i n s p e c t r o s c o p y
w i t h t h e t e x t t h a t ’s s e t t h e u n r i va l e d
standard for more than 30 years.
Pavia
Lampman
Kriz
Vyvyan
Pavia/Lampman/Kriz/Vyvyan’s Introduction to Spectroscopy, 4e,
is a comprehensive resource that provides an unmatched, systematic introduction to spectra and basic theoretical concepts
in spectroscopic methods that creates a practical learning resource, whether you’re an introductory student or someone
who needs a reliable reference text on spectroscopy.
This well-rounded introduction features updated spectra, a
modernized presentation of one-dimensional Nuclear Magnetic
Resonance (NMR) spectroscopy, the introduction of biological
molecules in mass spectrometry, and inclusion of modern techniques alongside DEPT, COSY, and HECTOR. Count on this book’s
exceptional presentation to provide the comprehensive coverage needed to truly understand today’s spectroscopic techniques.
Visit us on the Web!
a c a d e m i c . c e n g a g e . c o m /c h e m i s t r y
Fourth
Edition
Introduction to
Spectroscopy
For your course and learning solutions, visit academic.cengage.com
Four th Edition
Purchase any of our products at your local college store or at our preferred
online store www.ichapters.com
9780495114789_cvr_se.indd 1
40 AM
14782_FM_i-xvi pp3.qxd
2/7/08
9:11 AM
Page i
F O U R T H
E D I T I O N
INTRODUCTION
TO SPECTROSCOPY
Donald L. Pavia
Gary M. Lampman
George S. Kriz
James R. Vyvyan
Department of Chemistry
Western Washington University
Bellingham, Washington
Australia • Brazil • Japan • Korea • Mexico • Singapore • Spain • United Kingdom • United States
14782_FM_i-xvi pp3.qxd
2/7/08
9:11 AM
Page ii
14782_FM_i-xvi pp3.qxd
2/7/08
9:11 AM
Page iii
TO ALL OF OUR “O-SPEC” STUDENTS
14782_FM_i-xvi pp3.qxd
2/7/08
9:11 AM
Page iv
Introduction to Spectroscopy,
Fourth Edition
Donald L. Pavia, Gary M. Lampman,
George S. Kriz, and James R. Vyvyan
Acquisitions Editor: Lisa Lockwood
Development Editor: Brandi Kirksey
Editorial Assistant: Elizabeth Woods
Technology Project Manager: Lisa Weber
© 2009, 2001 Brooks/Cole, Cengage Learning
ALL RIGHTS RESERVED. No part of this work covered by the copyright
herein may be reproduced, transmitted, stored, or used in any form
or by any means graphic, electronic, or mechanical, including but not
limited to photocopying, recording, scanning, digitizing, taping, Web
distribution, information networks, or information storage and retrieval
systems, except as permitted under Section 107 or 108 of the 1976
United States Copyright Act, without the prior written permission of
the publisher.
Marketing Manager: Amee Mosley
Marketing Assistant: Elizabeth Wong
Marketing Communications Manager:
Talia Wise
Project Manager, Editorial Production:
Michelle Cole
For product information and technology assistance, contact us at
Cengage Learning Customer & Sales Support, 1-800-354-9706
For permission to use material from this text or product,
submit all requests online at cengage.com/permissions
Further permissions questions can be e-mailed to
Creative Director: Rob Hugel
Art Director: John Walker
Print Buyer: Paula Vang
Permissions Editor: Bob Kauser
Production Service: PrePress PMG
Photo Researcher: Susan Lawson
Copy Editor: Kathleen Brown
Cover Designer: Dare Porter
Cover Image: Eddie Gerald/Alamy
Library of Congress Control Number: 2007943966
ISBN-13: 978-0-495-11478-9
ISBN-10: 0-495-11478-2
Brooks/Cole
10 Davis Drive
Belmont, CA 94002-3098
USA
Compositor: PrePress PMG
Cengage Learning is a leading provider of customized learning solutions
with office locations around the globe, including Singapore, the United
Kingdom, Australia, Mexico, Brazil, and Japan. Locate your local office at
international.cengage.com/region
Cengage Learning products are represented in Canada by
Nelson Education, Ltd.
For your course and learning solutions, visit academic.cengage.com
Purchase any of our products at your local college store or at our
preferred online store www.ichapters.com
Printed in the United States of America
1 2 3 4 5 6 7 12 11 10 09 08
14782_FM_i-xvi pp3.qxd
2/7/08
9:11 AM
Page v
PREFACE
T
his is the fourth edition of a textbook in spectroscopy intended for students of organic
chemistry. Our textbook can serve as a supplement for the typical organic chemistry lecture
textbook, and it can also be used as a “stand-alone” textbook for an advanced undergraduate
course in spectroscopic methods of structure determination or for a first-year graduate course in
spectroscopy. This book is also a useful tool for students engaged in research. Our aim is not only to
teach students to interpret spectra, but also to present basic theoretical concepts. As with the previous editions, we have tried to focus on the important aspects of each spectroscopic technique without dwelling excessively on theory or complex mathematical analyses.
This book is a continuing evolution of materials that we use in our own courses, both as a supplement to our organic chemistry lecture course series and also as the principal textbook in our upper
division and graduate courses in spectroscopic methods and advanced NMR techniques. Explanations and examples that we have found to be effective in our courses have been incorporated into
this edition.
This fourth edition of Introduction to Spectroscopy contains some important changes. The
discussion of coupling constant analysis in Chapter 5 has been significantly expanded. Long-range
couplings are covered in more detail, and multiple strategies for measuring coupling constants are
presented. Most notably, the systematic analysis of line spacings allows students (with a little
practice) to extract all of the coupling constants from even the most challenging of first-order
multiplets. Chapter 5 also includes an expanded treatment of group equivalence and diastereotopic
systems.
Discussion of solvent effects in NMR spectroscopy is discussed more explicitly in Chapter 6,
and the authors thank one of our graduate students, Ms. Natalia DeKalb, for acquiring the data in
Figures 6.19 and 6.20. A new section on determining the relative and absolute stereochemical configuration with NMR has also been added to this chapter.
The mass spectrometry section (Chapter 8) has been completely revised and expanded in this
edition, starting with more detailed discussion of a mass spectrometer’s components. All of the
common ionization methods are covered, including chemical ionization (CI), fast-atom bombardment (FAB), matrix-assisted laser desorption ionization (MALDI), and electrospray techniques.
Different types of mass analyzers are described as well. Fragmentation in mass spectrometry is discussed in greater detail, and several additional fragmentation mechanisms for common functional
groups are illustrated. Numerous new mass spectra examples are also included.
Problems have been added to each of the chapters. We have included some more solved problems, so that students can develop skill in solving spectroscopy problems.
v
14782_FM_i-xvi pp3.qxd
vi
2/7/08
9:11 AM
Page vi
Preface
The authors are very grateful to Mr. Charles Wandler, without whose expert help this project
could not have been accomplished. We also acknowledge numerous contributions made by our students who use the textbook and who provide us careful and thoughtful feedback.
We wish to alert persons who adopt this book that answers to all of the problems are available on
line from the publisher. Authorization to gain access to the web site may be obtained through the
local Cengage textbook representative.
Finally, once again we must thank our wives, Neva-Jean, Marian, Carolyn, and Cathy for their
support and their patience. They endure a great deal in order to support us as we write, and they
deserve to be part of the celebration when the textbook is completed!
Donald L. Pavia
Gary M. Lampman
George S. Kriz
James R. Vyvyan
14782_FM_i-xvi pp3.qxd
2/7/08
9:11 AM
Page vii
CONTENTS
CHAPTER 1
MOLECULAR FORMULAS AND WHAT CAN BE LEARNED
FROM THEM
1
1.1
1.2
1.3
1.4
1.5
1.6
Elemental Analysis and Calculations
1
Determination of Molecular Mass
5
Molecular Formulas
5
Index of Hydrogen Deficiency
6
The Rule of Thirteen
9
A Quick Look Ahead to Simple Uses of Mass Spectra
Problems
13
References
14
12
CHAPTER 2
INFRARED SPECTROSCOPY
2.1
2.2
2.3
2.4
2.5
2.6
2.7
2.8
2.9
15
The Infrared Absorption Process
16
Uses of the Infrared Spectrum
17
The Modes of Stretching and Bending
18
Bond Properties and Absorption Trends
20
The Infrared Spectrometer
23
A. Dispersive Infrared Spectrometers
23
B. Fourier Transform Spectrometers
25
Preparation of Samples for Infrared Spectroscopy
26
What to Look for When Examining Infrared Spectra
26
Correlation Charts and Tables
28
How to Approach the Analysis of a Spectrum (Or What You Can Tell at a Glance)
30
vii
14782_FM_i-xvi pp3.qxd
viii
2/7/08
9:11 AM
Page viii
Contents
2.10
2.11
2.12
2.13
2.14
2.15
2.16
2.17
2.18
2.19
2.20
2.21
2.22
Hydrocarbons: Alkanes, Alkenes, and Alkynes
31
A. Alkanes
31
B. Alkenes
33
C. Alkynes
35
Aromatic Rings
43
Alcohols and Phenols
47
Ethers
50
Carbonyl Compounds
52
A. Factors that Influence the CJO Stretching Vibration
B. Aldehydes
56
C. Ketones
58
D. Carboxylic Acids
62
E. Esters
64
F. Amides
70
G. Acid Chlorides
72
H. Anhydrides
73
Amines
74
Nitriles, Isocyanates, Isothiocyanates, and Imines
77
Nitro Compounds
79
Carboxylate Salts, Amine Salts, and Amino Acids
80
Sulfur Compounds
81
Phosphorus Compounds
84
Alkyl and Aryl Halides
84
The Background Spectrum
86
Problems
88
References
104
54
CHAPTER 3
NUCLEAR MAGNETIC RESONANCE SPECTROSCOPY
PART ONE: BASIC CONCEPTS
3.1
3.2
3.3
3.4
3.5
3.6
3.7
3.8
105
Nuclear Spin States
105
Nuclear Magnetic Moments
106
Absorption of Energy
107
The Mechanism of Absorption (Resonance)
109
Population Densities of Nuclear Spin States
111
The Chemical Shift and Shielding
112
The Nuclear Magnetic Resonance Spectrometer
114
A. The Continuous-Wave (CW) Instrument
114
B. The Pulsed Fourier Transform (FT) Instrument
116
Chemical Equivalence—A Brief Overview
120
14782_FM_i-xvi pp3.qxd
2/7/08
9:11 AM
Page ix
Contents
3.9
3.10
3.11
3.12
3.13
3.14
3.15
3.16
3.17
3.18
3.19
ix
Integrals and Integration
121
Chemical Environment and Chemical Shift
123
Local Diamagnetic Shielding
124
A. Electronegativity Effects
124
B. Hybridization Effects
126
C. Acidic and Exchangeable Protons; Hydrogen Bonding
127
Magnetic Anisotropy
128
Spin–Spin Splitting (n + 1) Rule
131
The Origin of Spin–Spin Splitting
134
The Ethyl Group (CH3CH2I)
136
Pascal’s Triangle
137
The Coupling Constant
138
A Comparison of NMR Spectra at Low- and High-Field Strengths
141
1
Survey of Typical H NMR Absorptions by Type of Compound
142
A. Alkanes
142
B. Alkenes
144
C. Aromatic Compounds
145
D. Alkynes
146
E. Alkyl Halides
148
F. Alcohols
149
G. Ethers
151
H. Amines
152
I. Nitriles
153
J. Aldehydes
154
K. Ketones
156
L. Esters
157
M. Carboxylic Acids
158
N. Amides
159
O. Nitroalkanes
160
Problems
161
References
176
CHAPTER 4
NUCLEAR MAGNETIC RESONANCE SPECTROSCOPY
PART TWO: CARBON-13 SPECTRA, INCLUDING HETERONUCLEAR COUPLING WITH
OTHER NUCLEI
177
4.1
4.2
4.3
The Carbon-13 Nucleus
177
Carbon-13 Chemical Shifts
178
A. Correlation Charts
178
B. Calculation of 13C Chemical Shifts
180
13
Proton-Coupled C Spectra—Spin–Spin Splitting of Carbon-13 Signals
181
14782_FM_i-xvi pp3.qxd
x
2/7/08
9:11 AM
Page x
Contents
4.4
4.5
4.6
4.7
4.8
4.9
4.10
4.11
4.12
4.13
4.14
4.15
4.16
Proton-Decoupled 13C Spectra
183
Nuclear Overhauser Enhancement (NOE)
184
Cross-Polarization: Origin of the Nuclear Overhauser Effect
186
13
Problems with Integration in C Spectra
189
Molecular Relaxation Processes
190
Off-Resonance Decoupling
192
A Quick Dip into DEPT
192
Some Sample Spectra—Equivalent Carbons
195
Compounds with Aromatic Rings
197
Carbon-13 NMR Solvents—Heteronuclear Coupling of Carbon to Deuterium
Heteronuclear Coupling of Carbon-13 to Fluorine-19
203
Heteronuclear Coupling of Carbon-13 to Phosphorus-31
204
Carbon and Proton NMR: How to Solve a Structure Problem
206
Problems
210
References
231
CHAPTER 5
NUCLEAR MAGNETIC RESONANCE SPECTROSCOPY
PART THREE: SPIN–SPIN COUPLING
5.1
5.2
5.3
5.4
5.5
5.6
5.7
233
Coupling Constants: Symbols
233
Coupling Constants: The Mechanism of Coupling
234
1
A. One-Bond Couplings ( J)
235
B. Two-Bond Couplings (2J)
236
3
C. Three-Bond Couplings ( J)
239
4 n
D. Long-Range Couplings ( J– J)
244
Magnetic Equivalence
247
Spectra of Diastereotopic Systems
252
A. Diastereotopic Methyl Groups: 4-Methyl-2-pentanol
252
B. Diastereotopic Hydrogens: 4-Methyl-2-pentanol
254
Nonequivalence within a Group—The Use of Tree Diagrams when the n + 1 Rule
Fails
257
Measuring Coupling Constants from First-Order Spectra
260
A. Simple Multiplets—One Value of J (One Coupling)
260
B. Is the n + 1 Rule Ever Really Obeyed?
262
C. More Complex Multiplets—More Than One Value of J
264
Second-Order Spectra—Strong Coupling
268
A. First-Order and Second-Order Spectra
268
B. Spin System Notation
269
270
C. The A2, AB, and AX Spin Systems
D. The AB2 . . . AX2 and A2B2 . . . A2X2 Spin Systems
270
199
14782_FM_i-xvi pp3.qxd
2/7/08
9:11 AM
Page xi
Contents
5.8
5.9
5.10
5.11
E. Simulation of Spectra
272
F. The Absence of Second-Order Effects at Higher Field
272
G. Deceptively Simple Spectra
273
Alkenes
277
Measuring Coupling Constants—Analysis of an Allylic System
Aromatic Compounds—Substituted Benzene Rings
285
A. Monosubstituted Rings
286
B. para-Disubstituted Rings
288
C. Other Substitution
291
Coupling in Heteroaromatic Systems
293
Problems
296
References
328
281
CHAPTER 6
NUCLEAR MAGNETIC RESONANCE SPECTROSCOPY
PART FOUR: OTHER TOPICS IN ONE-DIMENSIONAL NMR
6.1
6.2
6.3
6.4
6.5
6.6
6.7
6.8
6.9
6.10
6.11
Protons on Oxygen: Alcohols
329
Exchange in Water and D2O
332
A. Acid/Water and Alcohol/Water Mixtures
332
B. Deuterium Exchange
333
C. Peak Broadening Due to Exchange
337
Other Types of Exchange: Tautomerism
338
Protons on Nitrogen: Amines
340
Protons on Nitrogen: Quadrupole Broadening and Decoupling
Amides
345
The Effect of Solvent on Chemical Shift
347
Chemical Shift Reagents
351
Chiral Resolving Agents
354
Determining Absolute and Relative Configuration via NMR
A. Determining Absolute Configuration
356
B. Determining Relative Configuration
358
Nuclear Overhauser Effect Difference Spectra
359
Problems
362
References
380
CHAPTER 7
ULTRAVIOLET SPECTROSCOPY
7.1
7.2
7.3
381
The Nature of Electronic Excitations
381
The Origin of UV Band Structure
383
Principles of Absorption Spectroscopy
383
329
342
356
xi
14782_FM_i-xvi pp3.qxd
xii
2/7/08
9:11 AM
Page xii
Contents
7.4
7.5
7.6
7.7
7.8
7.9
7.10
7.11
7.12
7.13
7.14
7.15
7.16
7.17
Instrumentation
384
Presentation of Spectra
385
Solvents
386
What Is a Chromophore?
387
The Effect of Conjugation
390
The Effect of Conjugation on Alkenes
391
The Woodward–Fieser Rules for Dienes
394
Carbonyl Compounds; Enones
397
Woodward’s Rules for Enones
400
a,b-Unsaturated Aldehydes, Acids, and Esters
402
Aromatic Compounds
402
A. Substituents with Unshared Electrons
404
B. Substituents Capable of p-Conjugation
406
C. Electron-Releasing and Electron-Withdrawing Effects
406
D. Disubstituted Benzene Derivatives
406
E. Polynuclear Aromatic Hydrocarbons and Heterocyclic Compounds
Model Compound Studies
411
Visible Spectra: Color in Compounds
412
What to Look for in an Ultraviolet Spectrum: A Practical Guide
413
Problems
415
References
417
CHAPTER 8
MASS SPECTROMETRY
8.1
8.2
8.3
8.4
8.5
8.6
8.7
418
The Mass Spectrometer: Overview
418
Sample Introduction
419
Ionization Methods
420
A. Electron Ionization (EI)
420
B. Chemical Ionization (CI)
421
C. Desorption Ionization Techniques (SIMS, FAB, and MALDI)
D. Electrospray Ionization (ESI)
426
Mass Analysis
429
A. The Magnetic Sector Mass Analyzer
429
B. Double-Focusing Mass Analyzers
430
C. Quadrupole Mass Analyzers
430
D. Time-of-Flight Mass Analyzers
432
Detection and Quantitation: The Mass Spectrum
435
Determination of Molecular Weight
438
Determination of Molecular Formulas
441
425
409
14782_FM_i-xvi pp3.qxd
2/7/08
9:11 AM
Page xiii
Contents
8.8
8.9
8.10
A. Precise Mass Determination
441
B. Isotope Ratio Data
441
Structural Analysis and Fragmentation Patterns
445
A. Stevenson’s Rule
446
B. The Initial Ionization Event
447
C. Radical-site Initiated Cleavage: a-Cleavage
448
D. Charge-site Initiated Cleavage: Inductive Cleavage
448
E. Two-Bond Cleavage
449
F. Retro Diels-Adler Cleavage
450
G. McLafferty Rearrangements
450
H. Other Cleavage Types
451
I. Alkanes
451
J. Cycloalkanes
454
K. Alkenes
455
L. Alkynes
459
M. Aromatic Hydrocarbons
459
N. Alcohols and Phenols
464
O. Ethers
470
P. Aldehydes
472
Q. Ketones
473
R. Esters
477
S. Carboxylic Acids
482
T. Amines
484
U. Selected Nitrogen and Sulfur Compounds
488
V. Alkyl Chlorides and Alkyl Bromides
492
Strategic Approach to Analyzing Mass Spectra and Solving Problems
Computerized Matching of Spectra with Spectral Libraries
497
Problems
498
References
519
CHAPTER 9
COMBINED STRUCTURE PROBLEMS
Example 1
522
Example 2
524
Example 3
526
Example 4
529
Problems
531
Sources of Additional Problems
586
520
496
xiii
14782_FM_i-xvi pp3.qxd
xiv
2/7/08
9:11 AM
Page xiv
Contents
CHAPTER 10
NUCLEAR MAGNETIC RESONANCE SPECTROSCOPY
PART FIVE: ADVANCED NMR TECHNIQUES
587
10.1
10.2
10.3
10.4
10.5
Pulse Sequences
587
Pulse Widths, Spins, and Magnetization Vectors
589
Pulsed Field Gradients
593
The DEPT Experiment
595
Determining the Number of Attached Hydrogens
598
A. Methine Carbons (CH)
598
B. Methylene Carbons (CH2)
599
C. Methyl Carbons (CH3)
601
D. Quaternary Carbons (C)
601
E. The Final Result
602
10.6 Introduction to Two-Dimensional Spectroscopic Methods
602
10.7 The COSY Technique
602
A. An Overview of the COSY Experiment
603
B. How to Read COSY Spectra
604
10.8 The HETCOR Technique
608
A. An Overview of the HETCOR Experiment
608
B. How to Read HETCOR Spectra
609
10.9 Inverse Detection Methods
612
10.10 The NOESY Experiment
613
10.11 Magnetic Resonance Imaging
614
10.12 Solving a Structural Problem Using Combined 1-D and 2-D Techniques
A. Index of Hydrogen Deficiency and Infrared Spectrum
616
B. Carbon-13 NMR Spectrum
617
C. DEPT Spectrum
617
D. Proton NMR Spectrum
619
E. COSY NMR Spectrum
621
F. HETCOR (HSQC) NMR Spectrum
622
Problems
623
References
657
ANSWERS TO SELECTED PROBLEMS
ANS-1
APPENDICES
Appendix 1
Appendix 2
Appendix 3
Infrared Absorption Frequencies of Functional Groups
A-1
1
Approximate H Chemical Shift Ranges (ppm) for Selected Types
of Protons
A-8
Some Representative 1H Chemical Shift Values for Various Types
of Protons
A-9
616
14782_FM_i-xvi pp3.qxd
2/7/08
9:11 AM
Page xv
Contents
Appendix 4
Appendix 5
Appendix 6
Appendix 7
Appendix 8
Appendix 9
Appendix 10
Appendix 11
Appendix 12
Appendix 13
Appendix 14
INDEX
1
H Chemical Shifts of Selected Heterocyclic and Polycyclic Aromatic
Compounds
A-12
Typical Proton Coupling Constants
A-13
1
Calculation of Proton ( H) Chemical Shifts
A-17
13
Approximate C Chemical-Shift Values (ppm) for Selected Types
of Carbon
A-21
13
Calculation of C Chemical Shifts
A-22
13
C Coupling Constants
A-32
1
H and 13C Chemical Shifts for Common NMR Solvents
A-33
Tables of Precise Masses and Isotopic Abundance Ratios for Molecular
Ions under Mass 100 Containing Carbon, Hydrogen, Nitrogen,
and Oxygen
A-34
Common Fragment Ions under Mass 105
A-40
A Handy-Dandy Guide to Mass Spectral Fragmentation Patterns
A-43
Index of Spectra
A-46
I-1
xv
14782_FM_i-xvi pp3.qxd
2/7/08
9:11 AM
Page xvi
14782_01_Ch1_p001-014.pp3.qxd
1/25/08
10:11 AM
C H A P T E R
Page 1
1
MOLECULAR FORMULAS AND WHAT
CAN BE LEARNED FROM THEM
B
efore attempting to deduce the structure of an unknown organic compound from an examination of its spectra, we can simplify the problem somewhat by examining the molecular
formula of the substance. The purpose of this chapter is to describe how the molecular formula of a compound is determined and how structural information may be obtained from that formula. The chapter reviews both the modern and classical quantitative methods of determining the
molecular formula. While use of the mass spectrometer (Section 1.6 and Chapter 8) can supplant
many of these quantitative analytical methods, they are still in use. Many journals still require that
a satisfactory quantitative elemental analysis (Section 1.1) be obtained prior to the publication of
research results.
1.1 ELEMENTAL ANALYSIS AND CALCULATIONS
The classical procedure for determining the molecular formula of a substance involves three steps:
1. A qualitative elemental analysis to find out what types of atoms are present . . . C, H, N,
O, S, Cl, and so on.
2. A quantitative elemental analysis (or microanalysis) to find out the relative numbers (percentages) of each distinct type of atom in the molecule.
3. A molecular mass (or molecular weight) determination.
The first two steps establish an empirical formula for the compound. When the results of the third
procedure are known, a molecular formula is found.
Virtually all organic compounds contain carbon and hydrogen. In most cases, it is not necessary to determine whether these elements are present in a sample: their presence is assumed.
However, if it should be necessary to demonstrate that either carbon or hydrogen is present in a
compound, that substance may be burned in the presence of excess oxygen. If the combustion
produces carbon dioxide, carbon must be present; if combustion produces water, hydrogen atoms
must be present. Today, the carbon dioxide and water can be detected by gas chromatographic
methods. Sulfur atoms are converted to sulfur dioxide; nitrogen atoms are often chemically reduced to nitrogen gas following their combustion to nitrogen oxides. Oxygen can be detected by
the ignition of the compound in an atmosphere of hydrogen gas; the product is water. Currently,
all such analyses are performed by gas chromatography, a method that can also determine the relative amounts of each of these gases. If the amount of the original sample is known, it can be
entered, and the computer can calculate the percentage composition of the sample.
Unless you work in a large company or in one of the larger universities, it is quite rare to find a
research laboratory in which elemental analyses are performed on site. It requires too much time to
set up the apparatus and keep it operating within the limits of suitable accuracy and precision.
Usually, samples are sent to a commercial microanalytical laboratory that is prepared to do this
work routinely and to vouch for the accuracy of the results.
1
14782_01_Ch1_p001-014.pp3.qxd
2
1/25/08
10:11 AM
Page 2
Molecular Formulas and What Can Be Learned from Them
Before the advent of modern instrumentation, the combustion of the precisely weighed sample was
carried out in a cylindrical glass tube, contained within a furnace. A stream of oxygen was passed
through the heated tube on its way to two other sequential, unheated tubes that contained chemical
substances that would absorb first the water (MgClO4) and then the carbon dioxide (NaOH/silica).
These preweighed absorption tubes were detachable and were removed and reweighed to determine
the amounts of water and carbon dioxide formed. The percentages of carbon and hydrogen in the
original sample were calculated by simple stoichiometry. Table 1.1 shows a sample calculation.
Notice in this calculation that the amount of oxygen was determined by difference, a common
practice. In a sample containing only C, H, and O, one needs to determine the percentages of only C
and H; oxygen is assumed to be the unaccounted-for portion. You may also apply this practice in situations involving elements other than oxygen; if all but one of the elements is determined, the last
one can be determined by difference. Today, most calculations are carried out automatically by the
computerized instrumentation. Nevertheless, it is often useful for a chemist to understand the fundamental principles of the calculations.
Table 1.2 shows how to determine the empirical formula of a compound from the percentage
compositions determined in an analysis. Remember that the empirical formula expresses the simplest
whole-number ratios of the elements and may need to be multiplied by an integer to obtain the true
molecular formula. To determine the value of the multiplier, a molecular mass is required.
Determination of the molecular mass is discussed in the next section.
For a totally unknown compound (unknown chemical source or history) you will have to use this
type of calculation to obtain the suspected empirical formula. However, if you have prepared the
compound from a known precursor by a well-known reaction, you will have an idea of the structure
of the compound. In this case, you will have calculated the expected percentage composition of your
TA B L E 1 . 1
CALCULATION OF PERCENTAGE COMPOSITION
FROM COMBUSTION DATA
CxHyOz + excess O2 ⎯→
9.83 mg
x CO2 + y/2 H2O
23.26 mg
9.52 mg
23.26 mg CO2
= 0.5285 mmoles CO2
millimoles CO2 = ᎏᎏ
44.01 mg/mmole
mmoles CO2 = mmoles C in original sample
(0.5285 mmoles C)(12.01 mg/mmole C) = 6.35 mg C in original sample
9.52 mg H2O
= 0.528 mmoles H2O
millimoles H2O = ᎏᎏ
18.02 mg/mmole
(
)
2 mmoles H
(0.528 mmoles H2O) ᎏᎏ = 1.056 mmoles H in original sample
1 mmole H2O
(1.056 mmoles H)(1.008 mg/mmole H) = 1.06 mg H in original sample
6.35 mg C
% C = ᎏᎏ × 100 = 64.6%
9.83 mg sample
1.06 mg H
% H = ᎏᎏ × 100 = 10.8%
9.83 mg sample
% O = 100 − (64.6 + 10.8) = 24.6%
14782_01_Ch1_p001-014.pp3.qxd
1/25/08
10:11 AM
Page 3
1.1 Elemental Analysis and Calculations
3
TA B L E 1 . 2
CALCULATION OF EMPIRICAL FORMULA
Using a 100-g sample:
64.6% of C = 64.6 g
10.8% of H = 10.8 g
24.6 g
24.6% of O = ᎏᎏ
100.0 g
64.6 g
moles C = ᎏᎏ = 5.38 moles C
12.01 g/mole
10.8 g
moles H = ᎏᎏ = 10.7 moles H
1.008 g/mole
24.6 g
moles O = ᎏᎏ = 1.54 moles O
16.0 g/mole
giving the result
C5.38H10.7O1.54
Converting to the simplest ratio:
5.38
C⎯
⎯ H 10.7
⎯— O1.54
⎯— = C3.49H6.95O1.00
1.54
1.54
1.54
which approximates
C3.50H7.00O1.00
or
C7H14O2
sample in advance (from its postulated structure) and will use the analysis to verify your hypothesis.
When you perform these calculations, be sure to use the full molecular weights as given in the periodic chart and do not round off until you have completed the calculation. The final result should be
good to two decimal places: four significant figures if the percentage is between 10 and 100; three
figures if it is between 0 and 10. If the analytical results do not agree with the calculation, the sample may be impure, or you may have to calculate a new empirical formula to discover the identity of
the unexpected structure. To be accepted for publication, most journals require the percentages
found to be less than 0.4% off from the calculated value. Most microanalytical laboratories can easily obtain accuracy well below this limit provided the sample is pure.
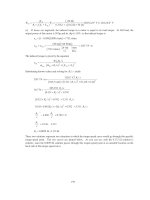
In Figure 1.1, a typical situation for the use of an analysis in research is shown. Professor Amyl
Carbon, or one of his students, prepared a compound believed to be the epoxynitrile with the structure shown at the bottom of the first form. A sample of this liquid compound (25 μ L) was placed in
a small vial correctly labeled with the name of the submitter and an identifying code (usually one
that corresponds to an entry in the research notebook). Only a small amount of the sample is required, usually a few milligrams of a solid or a few microliters of a liquid. A Request for Analysis
form must be filled out and submitted along with the sample. The sample form on the left side of
the figure shows the type of information that must be submitted. In this case, the professor calculated the expected results for C, H, and N and the expected formula and molecular weight. Note that
the compound also contains oxygen, but that there was no request for an oxygen analysis. Two
other samples were also submitted at the same time. After a short time, typically within a week, the
14782_01_Ch1_p001-014.pp3.qxd
4
1/25/08
10:11 AM
Page 4
Molecular Formulas and What Can Be Learned from Them
al
c
i
t
y
l
a
n
Microa ny, Inc.
Compa
REQUEST FOR ANALYSIS FORM
Date: October 30, 2006
Report To: Professor Amyl Carbon
Department of Chemistry
Western Washington University
Bellingham, WA 98225
Sample No: PAC599A P.O. No : PO 2349
Report By: AirMail Phone
(circle one)
Elements to Analyze: C, H, N
Other Elements Present : O
X Single Analysis
Duplicate Analysis
Duplicate only if results are not in range
M.P.
B.P. 69 ˚C @ 2.3 mmHg
Sensitive to :
Weigh under N? Y N
Dry the Sample? Y N Details:
Hygroscopic
Volatile
Explosive
November 25, 2006
Professor Amyl Carbon
Department of Chemistry
Western Washington University
Bellingham, WA
RESULTS OF ANALYSIS
Sample ID
Carbon (%)
PAC599A
67.39
9.22
11.25
PAC589B
64.98
9.86
8.03
PAC603
73.77
8.20
Hydrogen (%) Nitrogen (%)
Dr. B. Grant Poohbah,
Ph.D.
Director of Analytical Services
Microanalytical Company, Inc
PAC603
PAC589B
PAC599A
THEORY OR RANGE
L
Amount Provided
%C 67.17
Stucture:
%H 8.86
O
CN
%N 11.19
%O
Comments: C7H11NO
%Other
Mol. Wt. 125.17
l
a
c
i
t
y
l
a
Microanny, Inc.
Compa
F I G U R E 1 . 1 Sample microanalysis forms. Shown on the left is a typical submission form that is sent
with the samples. (The three shown here in labeled vials were all sent at the same time.) Each sample needs
its own form. In the background on the right is the formal letter that reported the results. Were the results
obtained for sample PAC599A satisfactory?
results were reported to Professor Carbon as an email (see the request on the form). At a later date,
a formal letter (shown in the background on the right-hand side) is sent to verify and authenticate
the results. Compare the values in the report to those calculated by Professor Carbon. Are they
within the accepted range? If not, the analysis will have to be repeated with a freshly purified sample, or a new possible structure will have to be considered.
Keep in mind that in an actual laboratory situation, when you are trying to determine the molecular formula of a totally new or previously unknown compound, you will have to allow for some
variance in the quantitative elemental analysis. Other data can help you in this situation since infrared (Chapter Two) and nuclear magnetic resonance (NMR) (Chapter Three) data will also suggest a possible structure or at least some of its prominent features. Many times, these other data will
be less sensitive to small amounts of impurities than the microanalysis.
14782_01_Ch1_p001-014.pp3.qxd
1/25/08
10:11 AM
Page 5
1.3 Molecular Formulas
5
1.2 DETERMINATION OF MOLECULAR MASS
The next step in determining the molecular formula of a substance is to determine the weight of
one mole of that substance. This may be accomplished in a variety of ways. Without knowledge
of the molecular mass of the unknown, there is no way of determining whether the empirical
formula, which is determined directly from elemental analysis, is the true formula of the substance or whether the empirical formula must be multiplied by some integral factor to obtain the
molecular formula. In the example cited in Section 1.1, without knowledge of the molecular
mass of the unknown, it is impossible to tell whether the molecular formula is C7H14O2 or
C14H28O4.
In a modern laboratory, the molecular mass is determined using mass spectrometry. The details of
this method and the means of determining molecular mass can be found in Section 1.6 and Chapter 8,
Section 8.6. This section reviews some classical methods of obtaining the same information.
An old method that is used occasionally is the vapor density method. In this method, a known
volume of gas is weighed at a known temperature. After converting the volume of the gas to standard
temperature and pressure, we can determine what fraction of a mole that volume represents. From
that fraction, we can easily calculate the molecular mass of the substance.
Another method of determining the molecular mass of a substance is to measure the freezing-point
depression of a solvent that is brought about when a known quantity of test substance is added. This
is known as a cryoscopic method. Another method, which is used occasionally, is vapor pressure
osmometry, in which the molecular weight of a substance is determined through an examination of
the change in vapor pressure of a solvent when a test substance is dissolved in it.
If the unknown substance is a carboxylic acid, it may be titrated with a standardized solution
of sodium hydroxide. By use of this procedure, a neutralization equivalent can be determined.
The neutralization equivalent is identical to the equivalent weight of the acid. If the acid has only
one carboxyl group, the neutralization equivalent and the molecular mass are identical. If the acid
has more than one carboxyl group, the neutralization equivalent is equal to the molecular mass
of the acid divided by the number of carboxyl groups. Many phenols, especially those substituted
by electron-withdrawing groups, are sufficiently acidic to be titrated by this same method, as are
sulfonic acids.
1.3 MOLECULAR FORMULAS
Once the molecular mass and the empirical formula are known, we may proceed directly to the
molecular formula. Often, the empirical formula weight and the molecular mass are the same. In
such cases, the empirical formula is also the molecular formula. However, in many cases, the empirical formula weight is less than the molecular mass, and it is necessary to determine how many
times the empirical formula weight can be divided into the molecular mass. The factor determined
in this manner is the one by which the empirical formula must be multiplied to obtain the molecular
formula.
Ethane provides a simple example. After quantitative element analysis, the empirical formula
for ethane is found to be CH3. A molecular mass of 30 is determined. The empirical formula weight
of ethane, 15, is half of the molecular mass, 30. Therefore, the molecular formula of ethane must be
2(CH3) or C2H6.
For the sample unknown introduced earlier in this chapter, the empirical formula was found to be
C7H14O2. The formula weight is 130. If we assume that the molecular mass of this substance was
determined to be 130, we may conclude that the empirical formula and the molecular formula are
identical, and that the molecular formula must be C7H14O2.
14782_01_Ch1_p001-014.pp3.qxd
6
1/25/08
10:11 AM
Page 6
Molecular Formulas and What Can Be Learned from Them
1.4 INDEX OF HYDROGEN DEFICIENCY
Frequently, a great deal can be learned about an unknown substance simply from knowledge of its
molecular formula. This information is based on the following general molecular formulas:
CnH2n+2 ⎫
⎬ Difference of 2 hydrogens
CnH2n ⎭
⎫ Difference of 2 hydrogens
CnH2n−2 ⎬⎭
alkane
cycloalkane or alkene
alkyne
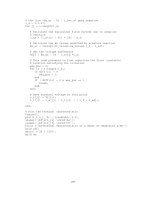
Notice that each time a ring or p bond is introduced into a molecule, the number of hydrogens in
the molecular formula is reduced by two. For every triple bond (two p bonds), the molecular formula is reduced by four. This is illustrated in Figure 1.2.
When the molecular formula for a compound contains noncarbon or nonhydrogen elements, the
ratio of carbon to hydrogen may change. Following are three simple rules that may be used to predict
how this ratio will change:
1. To convert the formula of an open-chain, saturated hydrocarbon to a formula containing
Group V elements (N, P, As, Sb, Bi), one additional hydrogen atom must be added to the
molecular formula for each such Group V element present. In the following examples, each
formula is correct for a two-carbon acyclic, saturated compound:
C2H6,
C2H7N,
C2H8N2,
C2H9N3
2. To convert the formula of an open-chain, saturated hydrocarbon to a formula containing
Group VI elements (O, S, Se, Te), no change in the number of hydrogens is required. In the
following examples, each formula is correct for a two-carbon, acyclic, saturated compound:
C2H6,
C2H6O,
C
C
H
H
H
H
C
C
H
H
–2H
C2H6O2,
C
(also compare
–4H
C
C
CHOH to
H2C
CH2
C
O)
C
CH2
H 2C
C2H6O3
CH2
CH2
H
CH2
H
–2H
H2C
CH2
CH2
H2C
CH2
F I G U R E 1 . 2 Formation of rings and double bonds. Formation of each ring or double bond causes the
loss of 2H.
14782_01_Ch1_p001-014.pp3.qxd
1/25/08
10:11 AM
Page 7
1.4 Index of Hydrogen Deficiency
7
3. To convert the formula of an open-chain, saturated hydrocarbon to a formula containing
Group VII elements (F, Cl, Br, I), one hydrogen must be subtracted from the molecular
formula for each such Group VII element present. In the following examples, each formula
is correct for a two-carbon, acyclic, saturated compound:
C2H6,
C2H5F,
C2H4F2,
C2H3F3
Table 1.3 presents some examples that should demonstrate how these correction numbers were determined for each of the heteroatom groups.
The index of hydrogen deficiency (sometimes called the unsaturation index) is the number
of p bonds and/or rings a molecule contains. It is determined from an examination of the molecular formula of an unknown substance and from a comparison of that formula with a formula for a
corresponding acyclic, saturated compound. The difference in the number of hydrogens between
these formulas, when divided by 2, gives the index of hydrogen deficiency.
The index of hydrogen deficiency can be very useful in structure determination problems. A
great deal of information can be obtained about a molecule before a single spectrum is examined.
For example, a compound with an index of one must have one double bond or one ring, but it cannot have both structural features. A quick examination of the infrared spectrum could confirm the
presence of a double bond. If there were no double bond, the substance would have to be cyclic
and saturated. A compound with an index of two could have a triple bond, or it could have two
double bonds, two rings, or one of each. Knowing the index of hydrogen deficiency of a substance,
the chemist can proceed directly to the appropriate regions of the spectra to confirm the presence
or absence of p bonds or rings. Benzene contains one ring and three “double bonds” and thus has
an index of hydrogen deficiency of four. Any substance with an index of four or more may contain
a benzenoid ring; a substance with an index less than four cannot contain such a ring.
To determine the index of hydrogen deficiency for a compound, apply the following steps:
1. Determine the formula for the saturated, acyclic hydrocarbon containing the same number
of carbon atoms as the unknown substance.
2. Correct this formula for the nonhydrocarbon elements present in the unknown. Add one
hydrogen atom for each Group V element present and subtract one hydrogen atom for each
Group VII element present.
3. Compare this formula with the molecular formula of the unknown. Determine the number of
hydrogens by which the two formulas differ.
4. Divide the difference in the number of hydrogens by two to obtain the index of hydrogen
deficiency. This equals the number of p bonds and/or rings in the structural formula of the
unknown substance.
TA B L E 1 . 3
CORRECTIONS TO THE NUMBER OF HYDROGEN ATOMS
WHEN GROUP V AND VII HETEROATOMS ARE INTRODUCED
(GROUP VI HETEROATOMS DO NOT REQUIRE A CORRECTION)
Group
V
VI
VII
Example
Correction
C —H S C —NH2
C —H S C — OH
C —H S C — CI
+1
0
–1
Net Change
Add nitrogen, add 1 hydrogen
Add oxygen (no hydrogen)
Add chlorine, lose 1 hydrogen
14782_01_Ch1_p001-014.pp3.qxd
8
1/25/08
10:11 AM
Page 8
Molecular Formulas and What Can Be Learned from Them
The following examples illustrate how the index of hydrogen deficiency is determined and how
that information can be applied to the determination of a structure for an unknown substance.
�
EXAMPLE 1
The unknown substance introduced at the beginning of this chapter has the molecular formula
C7H14O2.
1. Using the general formula for a saturated, acyclic hydrocarbon (CnH2n+2, where n = 7), calculate
the formula C7H16.
2. Correction for oxygens (no change in the number of hydrogens) gives the formula C7H16O2.
3. The latter formula differs from that of the unknown by two hydrogens.
4. The index of hydrogen deficiency equals one. There must be one ring or one double bond in
the unknown substance.
Having this information, the chemist can proceed immediately to the double-bond regions of the
infrared spectrum. There, she finds evidence for a carbon–oxygen double bond (carbonyl group).
At this point, the number of possible isomers that might include the unknown has been narrowed
considerably. Further analysis of the spectral evidence leads to an identification of the unknown
substance as isopentyl acetate.
O
CH3
C
O
CH2
CH2
CH
CH3
CH3
�
EXAMPLE 2
Nicotine has the molecular formula C10H14N2.
1. The formula for a 10-carbon, saturated, acyclic hydrocarbon is C10H22.
2. Correction for the two nitrogens (add two hydrogens) gives the formula C10H24N2.
3. The latter formula differs from that of nicotine by 10 hydrogens.
4. The index of hydrogen deficiency equals five. There must be some combination of five p
bonds and/or rings in the molecule. Since the index is greater than four, a benzenoid ring
could be included in the molecule.
Analysis of the spectrum quickly shows that a benzenoid ring is indeed present in nicotine. The spectral results indicate no other double bonds, suggesting that another ring, this one saturated, must be
present in the molecule. More careful refinement of the spectral analysis leads to a structural formula
for nicotine:
N
N
CH3