Volume 2 wind energy 2 16 – environmental social benefits impacts of wind power
Bạn đang xem bản rút gọn của tài liệu. Xem và tải ngay bản đầy đủ của tài liệu tại đây (2.11 MB, 37 trang )
2.16
Environmental-Social Benefits/Impacts of Wind Power
E Kondili and JK Kaldellis, Technological Education Institute of Piraeus, Athens, Greece
© 2012 Elsevier Ltd. All rights reserved.
2.16.1
2.16.2
2.16.2.1
2.16.2.2
2.16.2.3
2.16.3
2.16.3.1
2.16.3.2
2.16.3.3
2.16.4
2.16.5
2.16.6
2.16.6.1
2.16.6.2
2.16.7
2.16.7.1
2.16.7.2
2.16.8
2.16.8.1
2.16.8.2
2.16.9
2.16.9.1
2.16.9.2
2.16.9.3
2.16.9.4
2.16.10
2.16.10.1
2.16.10.2
2.16.10.3
2.16.10.4
2.16.10.5
2.16.10.6
2.16.10.7
2.16.10.8
2.16.11
2.16.11.1
2.16.11.2
2.16.12
2.16.12.1
2.16.12.2
2.16.13
2.16.14
2.16.15
References
Further Reading
Introduction – Scope and Objectives
Main Environmental Benefits of Wind Power
General Considerations
Avoided Air Pollution – Reduction of CO2 Emissions
Reduction of Water Consumption
Main Social Benefits of Wind Power
Fossil Fuel Saving/Substitution
Regional Development – New Activities
Employment Opportunities and Job Positions in the Wind Power Sector
Environmental Behavior of Wind Energy
Methods and Tools for Environmental Impact Assessment
Noise Impact
Qualitative and Quantitative Consideration of Noise Impact
Research and Development Relevant to Wind Turbine Noise
Wind Turbines’ Visual Impact and Aesthetics
General Considerations on Visual Impact and Aesthetics
Shadow Flickering
Impacts in Fauna and Flora and Microclimate
Impacts in Flora and Fauna
Impacts on the Microclimate
Other Environmental Impacts
Interference of a Wind Turbine with Electromagnetic Communication Systems
Traffic – Transportation and Access
Archaeology and Cultural Heritage
Health and Safety
Offshore Environmental Impacts
Offshore Noise Impact
Construction and Decommissioning Noise
Operational Noise
Visual Impacts
Impacts on Marine Mammals
Impacts on Fish
Impacts on Birds
Effects of Offshore Wind Energy on the Microclimate
Mitigation Measures – Conclusions
The Importance of Wind Farm Siting
Mitigation through Technology
Social Acceptability of Wind Power Projects
General Considerations
Case Studies for Public Attitude Analysis
The Public Attitude Toward Offshore Wind Parks
Future Trends in Wind Parks’ Social and Environmental Impacts Assessment
Conclusions
Glossary
Impact The change in an environmental parameter over
time due to the effect of an action.
Carbon footprint The total amount of CO2 and other
greenhouse gases emitted over a full cycle of a process
or product. It is expressed as grams of CO2 equivalent
Comprehensive Renewable Energy, Volume 2
504
504
504
504
505
507
507
507
508
510
511
513
513
518
518
518
522
522
522
523
524
524
524
524
525
525
525
526
526
527
528
528
529
530
530
530
531
531
531
534
535
536
537
537
538
per kilowatt hour of energy produced (gCO2eq.
kWh− 1).
Offshore wind parks Wind parks installed in the sea.
Seascape The coastal landscape and adjoining areas of
open water, including views from land to sea, from sea to
land, and along the coastline.
doi:10.1016/B978-0-08-087872-0.00219-5
503
504
Environmental-Social Benefits/Impacts of Wind Power
Social benefits Benefits for the society in terms of
development, job positions, environmental behavior, and
income increase.
Visual impact Visual impact is defined as a change in the
appearance of the landscape as a result of development which
can be positive (improvement) or negative (detraction).
2.16.1 Introduction – Scope and Objectives
Wind energy is characterized as a clean and environmentally friendly technology, and this is one of the main benefits that makes
it such an attractive and promising energy supply solution. For the completeness of wind energy analysis it is considered very critical
to describe concisely other wind energy effects, such as the social and environmental impacts that may incur from the corresponding
projects implementation, in parallel to its technological and/or financial implications. To that effect, the present chapter deals with
the main social and environmental benefits from the introduction of wind energy in an area, such as CO2 emissions reduction, fossil
fuels imports reduction, creation of new job positions, and regional development.
On the other hand, there are some environmental concerns resulting from wind power plants, such as noise, visual impacts, and
a possible disturbance of wildlife. In some cases, these concerns are extensive and affect negatively or even hinder the implementa
tion of the corresponding projects. The environmental impact assessment (EIA) of these projects identifies in detail the
environmental impacts and suggests their mitigation measures, facilitating in that way their acceptance by local societies.
Another very interesting issue that is of high priority when examining wind power projects is their social acceptance and the public
attitude toward them. These issues are also discussed in this chapter.
Nowadays, it is a common belief that wind energy has a key role to play in combating climate change by reducing CO2 emissions
from power generation. Generally, it does not pollute the air-like thermal power plants that rely on combustion of (carbon
containing) fossil fuels such as oil, coal, or natural gas. Wind turbines do not produce atmospheric emissions that cause acid rain
or greenhouse gases. Wind power plants may be built in villages, in remote areas, thus benefiting the economy in the region,
employment, and the development of parallel satellite activities. It is definitely considered as a green power technology.
In the rest of the chapter the main impacts (positive and negative) of wind energy projects on people in surrounding areas are
identified and described. Offshore wind power plants are a special interesting category with distinct and, in many cases, different
environmental impacts, and, therefore, they are described in a separate section.
2.16.2 Main Environmental Benefits of Wind Power
2.16.2.1
General Considerations
Wind energy is one of the cleanest and most environmentally friendly energy sources. It has a long-term positive impact on the
environment by reducing the threat posed by climate change. It emits no greenhouse gases or air pollutants or particles that are
carcinogenic and affect human health severely. The development of wind power plants creates employment opportunities and new
job positions during equipment construction, installation, and operation of the new power plants. Also, since wind power plants
are located in remote areas, new industries and satellite activities are emerging and regional development is enhanced in order to
support the construction and the operation of the new plant during its whole life cycle. At the local level, wind energy may also have
positive effects on biodiversity and offer an opportunity to practice ecological restoration both onshore and offshore, such as the
creation of new vegetation and animal habitats, improved fish stocks, and other marine life.
Table 1 highlights the main environmental and social benefits of wind energy.
2.16.2.2
Avoided Air Pollution – Reduction of CO2 Emissions
All electricity generation schemes have a carbon footprint. This means that at some points of their construction and operation, CO2
and other greenhouse gases are emitted. A carbon footprint is the total amount of CO2 and other greenhouse gases emitted over a
full cycle of a process or product. It is expressed as grams of CO2 equivalent per kilowatt hour of energy produced (gCO2eq. kWh−1).
Fossil fuel technologies have the largest carbon footprints since power production is achieved through combustion
processes. Nonfossil fuel technologies such as renewable energy sources (RES) are often referred as low carbon or carbon
neutral because they do not emit CO2 during their operation. Certainly they are not completely carbon-free since CO2
Table 1
Main social and environmental benefits of wind power
Avoided air pollution – reduction of CO2 emissions
Reduction of water consumption
Fossil fuels saving/substitution
Positive effects on the microclimate of the area
New job positions – employment opportunities
Regional development
Development and support of domestic construction industry and various satellite activities
505
Environmental-Social Benefits/Impacts of Wind Power
emissions arise in other phases of their life cycle, for example, during raw materials extraction, equipment construction,
plant installation, maintenance, and decommissioning, however originating from the embedded energy. In any case, their
very low carbon footprint compared to the conventional energy sources has been the main advantage for their current
development and advancement.
Coal burning power plants have the largest footprint of all electricity generation systems. Conventional coal combustion
systems result in emissions of the order of 1000 gCO2 kWh−1. Wind power is already helping to fight climate change, since
each wind-produced kWh avoids a kWh created by the energy mix of coal, oil, and gas – on average 600–1000 gCO2 kWhe−1
[1]. Tables 2 and 3 present the emissions of relevant pollutants produced by various power production technologies
including wind power [2].
Nearly all the emissions related to wind energy refer to the embedded energy of the various wind park components and
occur during the manufacturing and construction phase, arising mainly from the production of steel for the tower of the
wind turbine, concrete for the foundations, and materials for the rotor blades. These all account for 98% of the total life
cycle emissions. The emissions generated during the operation of wind turbines arise from routine maintenance inspection
trips. Onshore wind turbines are accessed by vehicles, while offshore turbines are maintained using special vessels and
helicopters. The carbon footprint of offshore versus onshore wind energy generation is marginally greater since it requires
larger foundations.
Figures 1 and 2 indicate the CO2 footprint for various different electricity generation sources. As it can be seen from these figures,
electricity generated from wind energy has one of the lowest carbon footprints ranging in the area of 4–10 gCO2 kWh−1 [3–5].
2.16.2.3
Reduction of Water Consumption
In an increasingly water-stressed world, water consumption is a very important issue. Taking into account the imperative sustainability considerations, the minimization of the water consumption in power production could be one of the most significant criteria
for a process and technology selection in case there are alternative solutions available.
Conventional power plants use large amounts of water for the condensing portion of the thermodynamic cycle. For coal power
plants, water is also used to clean and process fuel. The amount of water used can be millions of liters per day. By reducing the usage
of water, it can be preserved and used for other purposes.
Table 2
Emissions of pollutants per kWh of produced electricity – benefits of wind power versus coal and natural gas [2]
Emissions per kWh of produced electricity
Onshore
wind
Carbon dioxide,
fossil (g)
Methane, fossil (mg)
Nitrogen oxides (mg)
NMVOC (mg)
Particulates (mg)
Sulfur dioxide (mg)
Offshore
wind
Average
wind
Wind power benefits
Hard
coal
Lignite
NGCC
vs.
Coal
vs.
Lignite
vs.
NGCC
8
8
8
836
1060
400
828
1052
392
8
31
6
13
32
8
31
5
18
31
8
31
6
15
32
2554
1309
71
147
1548
244
1041
8
711
3808
993
353
129
12
149
2546
1278
65
132
1516
236
1010
2
696
3776
985
322
123
–3
117
Table 3
Emissions and benefits of pollutants per kWh of electricity produced by wind, nuclear, solar PV, solar thermal, and biomass combined heat
and power (CHP) plants [2]
Emissions
Average
wind
Carbon dioxide,
fossil (g)
Methane, fossil
(mg)
Nitrogen oxides
(mg)
NMVOC (mg)
Particulates (mg)
Sulfur dioxide
(mg)
Wind power benefits
Nuclear
Solar
PV
Solar
thermal
Biomass
CHP
vs.
Nuclear
vs. Solar
PV
vs.
Solar
thermal
vs.
Biomass
CHP
8
8
53
9
83
0
45
1
75
8
20
100
18
119
12
92
10
111
31
32
112
37
814
1
81
6
783
6
15
32
6
17
46
20
107
0
6
27
31
66
144
250
0
2
14
14
92
–32
0
12
–1
60
129
218
506
Environmental-Social Benefits/Impacts of Wind Power
100
grass (miscanthus)
direct combustion
90
Graph's Data Max
80
Graph's Data Min
50
40
Sweden
UK
onshore
10
offshore
20
run-of-river
30
range for UK
wave energy
converters
reservoir storage
wood chip
gasification
gCO2/kWh
UK
60
Southern Europe
70
0
Biomass
PV
Marine
Hydro
Wind
Nuclear
Figure 1 Carbon footprint (bounds) of various power production technologies [2].
Global Warming Potential – LC GHG Emissions
LC Emissions (kgCO2/MWh)
1400
1200
1000
800
600
400
200
d
in
H
yd
ro
W
po
we
r
ar
N
uc
le
PV
G
il
O
N
C
oa
l
0
Figure 2 Carbon footprint of various conventional and renewable power production technologies [3].
Figure 3 shows the full-cycle water consumption per unit of electricity for fossil fuels and nuclear power plants, respectively,
utilizing once-through (OT), closed-loop (CL), and dry cooling technologies. Combined cycle gas turbines (CCGT) have the lowest
consumption rates of the three plant types examined, while nuclear power plants and plants with advanced coal technology and
carbon capture and sequestration (CCS) present the highest. Integrated gasification combined cycle (IGCC) is somewhere in
between these technologies as far as water consumption is concerned. The averages used are the simple mean of the low and high
estimates [6].
Figure 4 shows the corresponding water consumption related to the electricity generation on the basis of RES
exploitation.
Renewable sources for electricity have very diverse water consumption issues. Wind and solar photovoltaic (PV) use
practically no water, while concentrating solar power (CSP) uses steam turbines and therefore has water consumption
patterns comparable to or higher than conventional power plants. The different ones are geothermal and hydropower, as
they both use very large quantities of water, but have definitional issues that make it difficult to compare directly with other
sources of electricity.
In any case, from all the above it is apparent that wind energy in its life cycle uses very little or no water and it is very
advantageous in that respect compared to other power generation technologies.
Water consumption (l/kWh)
Environmental-Social Benefits/Impacts of Wind Power
4.5
4
507
Min
Average
3.5
3
Max
2.5
2
1.5
1
0.5
0
T)
O
(
ar
cle
Nu
)
CL
(
ar
cle
Nu
Dr
(
ar
cle
Nu
m
T)
(O
y)
ea
m
r
Tu
ea
St
)
L)
ne
ry
(C
bi
bi
r
Tu
St
ne
ne
(D
bi
m
r
Tu
ea
St
r
lve
u
PC
(P
)
al
CC
IG
d
ize
v.
Co
S
ith
lw
a
Co
CC
T
T)
(O
G
CC
)
L)
CC
G
T
ry
(C
T
(D
G
CC
Ad
Figure 3 Water consumption in electricity generation using different cooling technologies, including water consumed during fuel extraction and
processing [6].
6
Water consumption (l/kWh)
Min
5
Max
4
Average
3
2
1
0
Wind
Solar PV
CSP
Geothermal
Renewable technology
Figure 4 Water consumption from renewable energy sources [6].
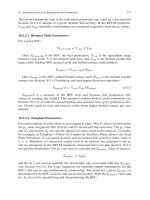
2.16.3 Main Social Benefits of Wind Power
2.16.3.1
Fossil Fuel Saving/Substitution
One of the main social benefits of the exploitation of wind energy is its contribution in minimizing the operation of thermal power
stations; hence, the operation of wind parks substitutes coal and oil-fired or natural gas-based thermal power stations. More
specifically, the fuel saving amount ‘Mf’ may be estimated by the following relationship:
Ewind
½1
ηHu
where ‘Ewind’ is the wind energy produced, ‘Hu’ is the fuel-specific calorific value, and ‘η’ is the total transformation efficiency of the
chemical energy of the fuel to electricity.
More specifically, the operation of wind-based power stations first of all reduces the energy imports (oil, natural gas, coal, etc.)
for almost all energy-importing industrialized countries contributing to annual exchange loss reduction. Note that the imported
energy exchange loss is strongly dependent on the unstable and continuous increasing prices of oil and natural gas in the
international market. In order to avoid any misleading conclusions, the money spent to import the necessary equipment (e.g.,
wind turbines) is less than the macroeconomic cost resulting from the corresponding fossil fuel imports during two successive years,
while the service period of the wind power stations exceeds 20 years.
Besides, the exploitation of wind energy improves energy supply security, since it minimizes the significant hidden cost of fossil
fuel utilization, like political dependency, cost of ‘controlling’ the existing fossil fuel reserves, and so on. On top of these, wind
energy contributes in reducing the exploitation of fossil fuel reserves, prolonging, in this way, their operational life.
Mf ¼
2.16.3.2
Regional Development – New Activities
As with most business ventures, wind energy projects create jobs and new activities in the specific areas where they are installed and,
more widely, in the whole country where they are implemented.
508
Environmental-Social Benefits/Impacts of Wind Power
Installation,
Repair/O&M
11%
Consultancy
Engineering 3%
Others
1%
R&D 1%
Wind Turbine
Manufacture 37%
Utility 9%
Developers
16%
Other
Component
Manufacture 22%
Figure 5 Direct employment by type of company in the wind energy sector [7].
In general, the main activities associated with the wind energy include the manufacturing of the turbine and all the other
necessary equipment, the construction and installation of the plant, its operation and maintenance activities, and other parallel
activities such as engineering, consultancy, education, distribution network, and utilities.
More specifically, the activities and the relevant employment fields related to wind power plants (Figure 5) include the following:
•
•
•
•
•
•
•
•
•
•
•
•
•
•
•
•
Raw materials processing (e.g., metallic, synthetic materials)
Wind turbine manufacturers
Major subcomponent manufacturers (metallic and electrical machinery)
Companies generating and distributing electricity (utilities)
Wind energy promoters (consultancy and engineering)
Research and development (R&D) activities in aerodynamics, computational fluid dynamics, and materials
Engineering companies for the design and development of the wind power plants
Technicians and specialized personnel for the operation and maintenance of the plant
Wind energy measurement and forecasting (developers)
Instrumentation manufacturing and trade (manufacturing other components)
EIA professionals (consultancy and engineering)
Education and training services (others)
Land and site development (developers)
Activities related to the permission acquirement (consultancy and engineering)
Specialized financial services (others)
Legal, health, and safety services (others).
All the above create direct or indirect employment. Most of these activities are closely related to the place where the plant is to be
installed and this is the reason that regional development is achieved. Nevertheless, for the completeness of the subject, it should be
mentioned at this point that some job positions may be lost because of the development of a wind power plant replacing partially
or completely a local thermal power station.
2.16.3.3
Employment Opportunities and Job Positions in the Wind Power Sector
Wind energy projects generate many new activities and certainly have positive effects on employment [7]. The implementation of
these projects creates a significant number of specialized jobs (over 104 000 in 2008) [8], especially at a time when other energy
sectors are shrinking. Wind turbine manufacturers, including major subcontractors (components manufacturers), are responsible
for the lion’s share of the jobs, and there is a prevalence of males in the workforce. There is also a scarcity of experienced and
qualified personnel, such as project managers, engineers, and operation and maintenance technicians. These job positions need a
series of educational, mobility, and dissemination measures to be put into practice.
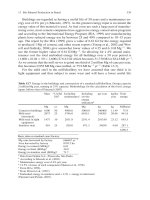
A survey has been carried out to investigate the number of employees working directly in the wind energy sector [8]. The survey
has been carried out by means of a questionnaire dispatched to around 1100 organizations from 30 countries (the 27 EU member
states plus Croatia, Norway, and Turkey). It went to all European Wind Energy Association members and the members of the EU-27
national wind energy associations. Supplementary information in order to fill the gaps has been provided from the following:
Environmental-Social Benefits/Impacts of Wind Power
509
40000
35000
30000
25000
20000
15000
10000
5000
UK
Rest of EU
Spain
Sweden
Poland
Portugal
Italy
The Netherlands
Ireland
Hungary
Greece
France
Germany
Finland
Denmark
Czech Republic
Bulgaria
Austria
Belgium
0
Figure 6 Direct jobs in the wind energy sector in the EU member states [7].
• Reviewing the annual reports and websites of the main wind energy companies, notably large wind turbines manufacturers,
component manufacturers, developers, and utilities.
• Using the results of the studies coming from the countries where the main wind turbine manufacturers are based, that is,
Denmark, Germany, and Spain.
• Assessing the data compiled by the national wind energy associations.
The results of the survey indicate that wind energy companies in the EU currently employ around 104 000 people. The growth
experienced (226%) between 2003 and 2007 is consistent with the evolution of the installed capacity in Europe (276%).
In this context, a significant proportion of direct wind energy employment is based in three countries, Denmark, Germany, and Spain,
whose combined installed capacity also adds up to 70% of the total in the EU (Figure 6). The situation in the eastern European member
states varies, with Poland being in a leading position. Wind energy employment in these countries will probably rise significantly in the
next 3–5 years, boosted by a combination of attractive markets, a well-qualified labor force, and lower production costs [7].
Nevertheless, the sector is less concentrated now than it was in 2003 when these three countries (Denmark, Germany, and Spain)
accounted for 89% of employment and 84% of EU installed capacity. This is due to the opening of manufacturing and operation
centers in emerging markets and to the local nature of many wind-related activities, such as promotion, operations and main
tenance, engineering, and legal services [9].
By type of company, wind turbine and component manufacturers (Figure 5) account for most of the jobs (59%). Within these
categories, companies tend to be bigger and thus employ more people.
Employment from the wind energy sector makes up around 7.3% of the total amount of people working in the
electricity-generating sector and it should be noted that wind energy currently meets 3.7% of EU electricity demand. This shows
that wind energy is more labor-intensive than the other electricity-generating technologies.
Finally, there is a well-documented trend of energy employment decline in Europe, particularly marked in the coal sector. For
instance, British coal production and employment have dropped significantly, from 229 000 workers in 1981 to 5500 in 2006. In
Germany, it is estimated that jobs in the sector will drop from 265 000 in 1991 to less than 80 000 in 2020. In EU countries, more
than 150 000 utility and gas industry jobs disappeared in the second half of the 1990s and it is estimated that another 200 000 jobs
will be lost during the first half of the twenty-first century. The outcomes set out in the previous paragraphs demonstrate that job
losses in the European energy sector are independent of renewable energy deployment and that the renewable energy sector is, in
fact, helping to mitigate these negative effects in the power sector.
The increase in wind energy installations has led to a multiplication of job offers in all the subsectors, especially in
manufacturing and development. Actually, one may state that the average new job creation in the European market is
approximately two employees per new MW installed, with values exceeding the seven new jobs per MW installed in some
specific countries (see also Figure 7). Concerning the qualifications and the profile of the field employees, a shortage in those
positions that requires a high degree of expertise and responsibility is identified. The positions that are most difficult to fill in are
those related to operations and maintenance, project management, and aerodynamics engineering. The standardization of
qualifications and a better information system could help to ease the situation and facilitate the transfer of workers toward the
areas where they are needed.
The conclusion is that wind energy represents an attractive source of employment in Europe. Since a number of activities
(construction, operation and maintenance, legal, and environmental studies) are best dealt with at local level, there will always be a
positive correlation between the location of the wind farm and the number of jobs it creates.
510
Environmental-Social Benefits/Impacts of Wind Power
Direct Employment in Wind Energy Companies of
European Countries (2006−2007)
8
(Employers/MW)
7
6
5
4
3
2
1
K
U
Au
st
Be ria
lg
iu
C
he Bu m
l
ch ga
R r ia
ep
u
D blic
en
m
a
Fi rk
nl
an
Fr d
a
G nce
er
m
an
G y
re
e
H ce
un
ga
r
Ire y
la
nd
N
I
t
et
h e a ly
r la
nd
Po s
la
Po nd
rtu
ga
Sp l
a
Sw in
ed
en
0
Figure 7 Employment opportunities in the wind energy sector in EU countries per MW of installed capacity [3].
2.16.4 Environmental Behavior of Wind Energy
Although wind energy is possibly the most environmental compatible form of energy, there are some environmental impacts that
should be considered when studying the installation of a new wind power plant. Most of the environmental impacts can be avoided
or minimized (by careful planning and siting), mitigated, or compensated. In fact, wind farm developers are required to undertake
EIA to gauge all potential significant environmental effects before the project’s implementation.
The main environmental impacts of a wind farm are shown in Table 4. In the general case the most serious environmental impacts of
wind power plants are related to noise, aesthetics, and their potential effects in the wildlife of the specific geographical area.
The European legislation associated with the identification and mitigation of environmental impacts of any development
activity is the consolidated version of the Council Directive 97/11/EC [10].
When looking at a potentially suitable site, a study analyzing all relevant environmental and ecological factors should be carried
out. These form the basis of an EIA that must be submitted alongside a planning application, demonstrating that any potential
environmental impact will be mitigated and that the impacts of development are outweighed by the benefits.
The various impacts are classified according to the environmental parameters they refer to. In addition, the impacts are very
different for the various stages of a wind park’s life cycle. More precisely, the most serious environmental impacts are associated with
the equipment manufacturing and the plant construction stages. The operation of a project has no serious environmental impacts.
Furthermore, in the general case, the impacts may be characterized as temporary or permanent, reversible or irreversible, and of low
or high significance.
A general table of contents of an EIA study as dictated by the current legislation (May 2011) is shown in Figure 8.
More specifically, for a wind power plant the EIA must examine the following environmental parameters:
• Noise. Noise is considered as one of the most significant environmental impacts of wind power on nearby regions.
• Visual impacts – aesthetics. It is also a very significant issue related to wind power plants.
• Impacts on wildlife. Effects on local and emigrating bird life, flora, and fauna.
• Landscape and land use. The possible need to change the land use and the effects of the wind park on the landscape.
• Surface and ground water. To assess any likely impacts on water quantity and quality within both the development area and
surrounding countryside and ensure these are minimized.
• Archaeology – cultural sites. Both national and local archaeological groups are consulted to establish if proposed sites are likely to
have any significant impacts on heritage sites or archaeological remains.
Table 4
Main environmental impacts of wind power plants
Noise
Visual impacts – aesthetics
Landscape and land use
Impacts on the wildlife, flora, and fauna
Effect on the electromagnetic waves
Archaeology and cultural heritage
Transportation issues
Health and safety
Environmental-Social Benefits/Impacts of Wind Power
511
Table of Contents of a typical EIA
EXECUTIVE SUMMARY
TABLE OF CONTENTS
CHAPTER 1: PROJECT DESCRIPTION
(Detailed project description including type of the project, project location, technical specifications, size of
the project/capacity, infrastructure required, networks, technology to be used, utilities required, project
plan, project budget).
CHAPTER 2: PROJECT LOCATION
2.1 Natural Environment (Soil, Topography, Water Resources, Flora, Fauna, Climate)
2.2 Human Environment (Population, Land use, Distances from inhabited areas, Cultural/Historical places,
Other characteristics of the area)
CHAPTER 3: EXISTING ENVIRONMENTAL SITUATION
3.1 Existing pollution sources
3.2 Assessment of environmental pollution before the project
CHAPTER 4: ENVIRONMENTAL PARAMETERS OF THE PROJECT – ENVIRONMENTAL IMPACTS
4.1 Environmental Parameters
4.2 Environmental Impacts
4.3 Checklists
4.4 Matrices
CHAPTER 5: ALTERNATIVE SOLUTIONS
� Zero solution
� Other location, other size, other technology/process, etc.
CHAPTER 6: POLLUTION PREVENTION – MITIGATION OF THE ENVIRONMENTAL IMPACTS
How are the impacts going to be controlled and/or eliminated.
(Link the impacts to the pollution prevention measures/techniques)
CHAPTER 7: CONCLUSIONS
REFERENCES – LITERATURE – ANNEXES
Figure 8 Structure and contents of an Environmental Impact Assessment Study according to the Directive 97/11/EC.
2.16.5 Methods and Tools for Environmental Impact Assessment
EIA is a tool for decision-makers to take into account the possible effects of a proposed project on the environment and is also a
process for collecting the data related to a project design and project location. Various methods and tools have been developed
(Figure 9) in order to identify and predict the environmental impacts of a project. In general, the tools may be classified into
quantitative and qualitative. The qualitative tools include the following:
• Checklists
• Impacts matrices.
Quantitative methods for EIA include the following:
•
•
•
•
Design and development of databases
Computer analytical models
Statistical models
Expert systems.
512
Environmental-Social Benefits/Impacts of Wind Power
Scoping and Impact
Identification
Evaluation Techniques
Consultations &
Questionnaires
Matrices
Checklists
Expert Opinion
Modeling
Carrying Capacity
Analysis
Spatial Analysis
Figure 9 Methods and tools in the environmental impact assessment.
Knowledge-based systems, referred to as expert systems, and different computer-based systems are an emerging technology in
information processing and are becoming increasingly useful tools in different applications areas including EIA studies.
The checklists provide a systematic way of ensuring that all likely events resulting from a project are considered. Information is
presented in a tabular format. It is a systematic method; therefore, standard checklists for similar projects may be developed. They
are very valuable since they present in a simple table all the potential impacts of a project. The main drawback is that cause and effect
relationships are not specified.
Matrices are a more complex form a checklist. They link the causes and effects for the specific characteristics of a project and a
mark is assigned in each cell indicating how much each project characteristic contributes to a certain impact. Therefore, matrices can
be used also quantitatively and can evaluate impacts to some degree. They provide a good visual summary of impacts. In the
matrices, since quantitative information is included, the impacts may be ranked to assist in evaluation.
As an example of wind power project checklists, Table 5 shows the environmental impacts of the construction phase of a
wind park, while Table 6 shows the corresponding impacts of the operational phase [11]. In addition, Table 7 is an example of
Table 5
Checklist for the environmental impacts of the construction phase of a wind park [11]
Environmental parameter
Environmental impact
Impact characteristics
Earth – soil
Soil compaction
Soil fracture, soils admixing
Soil erosion
Overlay of soil
Soil contamination and productivity
Slope damage
Change of local topography
Air emissions production
Dust generation
Odors generation
Groundwater contamination
Surface waters contamination
Water consumption
Change of existing land use
Vegetation disturbance
Animals and avian mortality
Harassment of wildlife and habitats damage
Electrical energy consumption
Fuels consumption increase
Mechanical noise
Damage of significant archaeological resources
Landscape aesthetics disruption/improvement
Increase of local resources’ exploitation rate
Accidents
Health issues
Increase of local traffic
Extension (improvement) of existing transportation
network
Degradation of existing transportation network
Reduction – disturbance of agricultural activities
Reduction – disturbance of livestock activities
Arising of objections toward the wind park’s
installation
Employment offer
Permanent, medium significance, certain, negative
Temporary, medium significance, certain, negative
Temporary, medium significance, very likely, negative
Permanent, high significance, certain, negative
Temporary, low significance, likely, negative
Permanent, medium significance, less likely, negative
Permanent, medium significance, certain, negative
Temporary, high significance, certain, negative
Temporary, low significance, certain, negative
Temporary, low significance, certain, negative
Temporary, low significance, less likely, negative
Temporary, low significance, likely, negative
Temporary, low significance, certain, negative
Permanent, medium significance, certain, negative
Temporary, low significance, very likely, negative
Temporary, low significance, likely, negative
Temporary, low significance, very likely, negative
Temporary, low significance, certain, negative
Temporary, medium significance, certain, negative
Temporary, high significance, certain, negative
Permanent, medium significance, very likely, negative
Temporary, low significance, very likely, negative
Temporary, low significance, very likely, negative
Temporary, high significance, very likely, negative
Temporary, medium significance, less likely, negative
Temporary, low significance, very likely, negative
Permanent, medium significance, certain, negative/
positive
Temporary, low significance, likely, negative
Temporary, low significance, likely, negative
Temporary, low significance, likely, negative
Temporary, medium significance, likely, negative
Air quality
Water resources
Land use
Flora and fauna
Energy
Noise
Cultural resources
Visual resources
Natural resources
Health and safety
Transportation
Agricultural crops and livestock
Local society, economy, and
services
Temporary, high significance, certain, positive
Environmental-Social Benefits/Impacts of Wind Power
Table 6
513
Checklist for the environmental impacts of the operation phase of a wind park [11]
Environmental parameter
Environmental impact
Impact characteristics
Earth – soil
Soil compaction
Soil erosion
Air emissions production
Dust generation
Odors generation
Air emissions reduction
Harassment of wildlife
Avian mortality
Animals and birds emigration
Fuels consumption reduction
Electricity generation
Mechanical noise
Aerodynamic noise
Landscape aesthetics disruption
Landscape aesthetics improvement
Shadow flickering
Flashing
Permanent, medium significance, certain, negative
Permanent, medium significance, likely, negative
Permanent, low significance, certain, negative
Permanent, low significance, certain, negative
Permanent, low significance, certain, negative
Permanent, high significance, certain, positive
Permanent, low significance, less likely, negative
Permanent, medium significance, likely, negative
Permanent, low significance, likely, negative
Permanent, high significance, certain, positive
Permanent, high significance, certain, positive
Permanent, low significance, certain, negative
Permanent, high significance, certain, negative
Permanent, high significance, very likely, negative
Permanent, high significance, very likely, positive
Permanent, low significance, very likely, negative
Permanent, medium significance, very likely,
negative
Permanent, medium significance, very likely,
negative
Permanent, high significance, certain, positive
Permanent, low significance, less likely, positive
Permanent, low significance, likely, negative
Permanent, low significance, likely, negative
Permanent, low significance, likely, negative
Air quality
Flora and fauna
Energy
Noise
Visual resources
Health and safety
Agricultural crops and livestock
Local society, economy, and
services
Accidents
Health issues (air emissions)
Health issues (radiation)
Disturbance of agricultural activities
Disturbance of livestock activities
Arising of objections toward the wind park’s
operation
Electricity security of supply
Local grid power quality issues
Employment offer
Reduction of the electricity tariffs
Promotion and development of local area
Permanent, medium significance, certain, positive
Permanent, high significance, certain, negative
Permanent, low significance, certain, positive
Permanent, medium significance, likely, positive
Permanent, medium significance, very likely,
positive
an impact matrix of the same wind park, where there is a quantified assessment of the cause–effect relationship in the scale 1
(low) to 5 (high) [11].
2.16.6 Noise Impact
2.16.6.1
Qualitative and Quantitative Consideration of Noise Impact
One of the most noticeable impacts a wind turbine places upon the environment is noise emission. In some cases the impact of
noise emission has the potential (mainly in densely populated areas) to lower property values within a varying radius of the plant
and is said to be one of the biggest disadvantages of a wind turbine. This one along with the visual impact are the concerns often
raised by members of the public, see, for example, Figures 10 and 11 concerning the public attitude toward the noise and visual
impact in a Greek region where almost 120 MW of wind power operate since the beginning of the previous decade.
The noise impact depends mainly on the average annual wind speed (i.e., the higher the wind speed, the greater the noise output
can be) and the size of the blades. Actually, wind noise is assumed analogous to the fourth to sixth power of the blades (tip) speed
relative to the surroundings. In this context, the rotor rotational speed and the corresponding blade’s length strongly influence the
noise emitted from a wind turbine [13]. On the other hand, it is well known that the energy yield of a wind turbine is directly
dependent on the ratio between the wind speed at hub height and the rotor tip speed (λ, tip speed ratio). Hence, specific blade speed
is required in order to maximize the energy yield of a wind turbine. Otherwise, the wind turbine would not operate efficiently. In
this context, during nights or other socially sensitive time periods, most of the manufacturers include the option of ‘night operation’,
where the machine operates at low rotational speed, reducing the noise emission and the power output as well. On top of that, the
energy in sound waves (and thus the sound intensity) in a homogeneous and obstacle-free flow field drops with the square of the
distance from the sound source.
In general, wind turbines generate noise as every machine does. The noise from the wind turbine is divided into two major
categories depending on the noise source, that is, the mechanical and the aerodynamic noise [14]. Particularly,
Table 7
Example of an environmental impacts matrix of a wind park [11]
Site preparation
Construction stage
Operation
Decommissioning
Activity
Environmental
parameter
Impact
Soil – Earth
Roads and
paths
construction,
Setup of
Measurements site
Delivery of temporary
procedure
demarcation equipment facilities
Soil erosion
Overlay of soil
Soil contamination
Soil productivity
Local topography
change
Air quality
Air emissions
increase/
reduction
Dust generation
Odors generation
Water
Waters
resources
contamination
Water
consumption
Land use
Change of land use
Noise
Noise emission
Visual impacts Visual annoyance 1
Flora and
Vegetation
1
fauna
disturbance/
growth
Animals and avian
mortality
Wildlife
1
harassment and
habitats damage
Animals and birds
emigration
Energy
Electrical energy
consumption/
generation
3
5
3
4
4
1
1
1
Transmission
line to
Interconnection high-voltage
from turbines power
to substation
network
Site
instauration
and
improvement
works
1
2
1
2
2
2
2
1
1
1
2
2
1
1
Excavation
Transformers’
and
Towers–turbines housing and
foundation assembly and
substation
works
installation
construction
4
1
2
2
4
2
2
1
2
2
2
5
3
3
3
2
1
4
2
3
1
2
1
4
1
3
4
1
2
1
2
2
1
4
4
1
2
2
2
2
2
3
1
1
3
3
3
4
4
5
4
4
3
3
2
1
3
1
3
1
3
3
1
5
5
4
1
4
4
2
1
1
4
3
1
Removal of
turbines,
ancillary
Wind
equipment,
farm’s
Maintenance and power
operation needs
lines
Site
remediation
1
2
1
1
2
1
3
2
1
3
2
1
1
4
1
1
3
2
1
1
1
1
4
2
1
3
3
3
2
5
1
1
5
5
1
1
5
5
4
2
3
2
3
1
2
1
5
1
1
Environmental-Social Benefits/Impacts of Wind Power
515
Noise Impact of Wind Parks in S. Euboea
Pleasantly Heard
6%
Covered by
Surroundings
30%
Too Loud
11%
Too Annoying
14%
Negligible Effects
39%
Figure 10 Social evaluation of noise impact of wind parks in a selected Greek region where more than 120 MW of wind power are operating [12].
Visual Acceptance of Wind Parks in S. Euboea
No Opinion
13%
Not in Harmonization
with Landscape
16%
Positive Effect
6%
Negative Opinion
46%
Negligible Effects
19%
Figure 11 Social evaluation of visual impact of wind parks in a selected Greek region where more than 120 MW of wind power are operating [12].
• Mechanical noise is caused by rotating machinery such as the gearbox, electrical generator, and bearings (tonal sound). Normal wear
and tear, poor component designs, or lack of preventative maintenance may all affect the amount of mechanical noise produced.
• Aerodynamic noise is caused by the interaction of the turbine blades with the wind flow field. Such a noise tends to increase
significantly with the speed of the rotor as already mentioned. For blade noise, lower blade tip speed results in lower noise levels,
for example, ‘night operation’. Of particular concern is the interaction of wind turbine blades with atmospheric turbulence.
Modern wind turbines produce little or no noise at all in comparison to their predecessors and to their rated power. This is due to
the fact that wind manufacturers realized quickly that the noise problem should be dealt with and started producing quieter
machines after serious research efforts. As a result, the noise from the gearbox and the blades has been reduced by careful attention
to the design and manufacture of the components and also the generator noise has been minimized with good sound insulation
within the turbine’s head (nacelle).
Efforts have also been made for the reduction of the aerodynamic noise by:
• Decreasing rotational speed at the tip.
• Using pitch control of upwind turbines in order to permit the rotation of the blades along their long axis, thus remarkably
controlling the wind flow field around the airfoils.
At any given location the noise varies considerably depending on the layout of the wind farm, the particular model of the turbines
installed, the topography or shape of the land, the speed and the direction of the wind, and the background noise. Wind turbine
noise is characterized as very directional.
The unit used to describe the intensity of sound is the decibel (dB). Audible sounds range from 0 dB (threshold of hearing) to
about 140 dB (threshold of pain). The normal audible frequency range is approximately 20 Hz–20 kHz. The A-weighted scale,
denoted as dB(A), approximates the range of human hearing by filtering out lower frequency noises, which are not as damaging as
the higher frequencies. It is used in most noise ordinances and standards.
516
Environmental-Social Benefits/Impacts of Wind Power
Table 8
Sound levels of different sources/activities [9, 14]
Source/activity
Noise level
dB(A)
Threshold of hearing
Whisper
Rural nighttime background
Quiet bedroom
Unoccupied air-conditioned office
Car at 65 km h−1 at 100 m
Busy general office
Conversation
Truck at 50 km h−1 at 100 m
City traffic
Pneumatic drill at 7 m
Jet aircraft at 250 m
Threshold of pain
0
30
20–40
35
45–50
55
60
60
65
90
95
105
140
To provide a frame of reference, rustling leaves have a decibel level of 10 dB(A); suburban expressway at 90 m, 60 dB(A); large
truck pass-by at 15 m, 90 dB(A); and aircraft takeoff, 120 dB(A). Sound levels from various human activities is given in Table 8.
Rationally, wind farms are always located where the wind speed is higher than average, and the background noise of the wind
tends to cover any sounds that might be produced by operating wind turbines. Background sound levels depend greatly on the
location and presence of roads, trees, and other sound sources. Typical background sound levels range from 35 dB(A) (quiet) to
50 dB(A) (urban setting).
Equation [2] can be used to calculate the contribution of the turbine to the overall sound level at a distance ‘R’ from the noise
emission source and eqn [3] can be used to add the turbine sound level to the background sound level to obtain the overall sound
level [15].
À
Á
À
Á
Turbine sound level ¼ LAWEA þ 10 log 4π602 −10 log 4πR2
½2
where LAWEA is the rated sound level in dB(A) at 60 m from the wind turbine and R is the observer distance from the turbine rotor
center (m).
turbine level
background level !
Overall sound level ¼ 10 log 10
10
þ 10
½3
10
Figure 12 shows noise measurements taken at various distances from the wind turbine for various magnitudes of the background
noise, included in the figure. As expected, the background noise becomes prevalent as the distance increases, while the turbine noise
is discrete only in distances close to the turbine [15].
Noise impacts can also result from project construction and maintenance. These are generally of relatively short duration and
occurrence, but can include equipment operation, blasting, and noise associated with traffic into and out of the facility.
65
30 dBA
35 dBA
Overall Sound level [dBA]
60
40 dBA
45 dBA
55
50 dBA
50
45
40
35
0
20
40
60
80
100
120
140
Distance from rotor center [m]
Figure 12 Noise emission as a function of the distance from the wind turbine [15].
160
180
200
Environmental-Social Benefits/Impacts of Wind Power
517
Mechanical noise can be minimized at the design stage (e.g., side toothed gear wheels), or by acoustic insulation on the inside of
the turbine housing. Mechanical noise can also be reduced during operation by acoustic insulation curtains and anti-vibration
support footings. On the other hand, aerodynamic noise can be reduced by careful design of the blades by the manufacturers who
can minimize this type of noise by better understanding the flow field pattern around the rotor of the machine.
Wind direction has the tendency to increase noise level relative to the turbine and the receiving point. The highest noise level can
be found at the bottom of the wind turbine situated with the wind direction from the plant toward the receiving point. Noise of
greatest concern can be generally classified as being of one of these three types:
• Broadband
• Tonal
• Low frequency.
Broadband, tonal, and low-frequency noise have all been examined to some degree in modern upwind horizontal axis wind
turbines and turbine technologies continue to improve in this direction. With regard to the design of a wind energy project, one is
generally interested in assessing whether the additional noise generated by the wind turbines (relative to the ambient noise) might
cause annoyance or a hazard to human health and well-being. Further complicating factors originate from the effects of multiple
wind turbines together and the way the noise increases and decreases as the blades rotate – the blade ‘swish’.
Wind energy developers are required to meet local standards for acceptable sound levels; for example, in Germany, this level is
35 dB(A) for rural nighttime environments. Generally, noise levels are only computed at medium wind speeds (7–8 m s−1), because
at higher speeds, noise produced by turbines can be (but is not always) masked by ambient noise.
Noise emission measurements potentially are subject to serious problems to be overcome. In addition, methods for assessing
noise levels produced by wind turbines located in various terrains, such as mountainous regions, need further development.
Figure 13 shows a qualitative comparison of wind turbine and background noise as a function of the wind speed at 10 m height.
Furthermore, there are a limited number of published wind turbines’ noise emission measurements, thus deteriorating the
opportunity of better investigating the real noise impact of the surroundings. In this context, real-world noise measurements have
significant value; for example, in a study by Kaldellis et al. [14] measurements have been made and the results are compared with the
theoretical (based on analytical methods) ones. As can be shown from Figure 14, the experimental results are less than 50 dB(A),
while the background noise in this specific area is almost 10 dB(A) lower than the noise emitted when the wind turbines operate.
Besides, the experimental measurements are fairly well harmonized with the theoretical ones (see also Figure 15).
Different types of wind turbines have different noise characteristics. As mentioned earlier, modern upwind turbines are less noisy than
downwind turbines. Variable-speed turbines (where rotor speeds are lower at low wind speeds) create less noise at lower wind speeds
when ambient noise is also low compared to constant-speed turbines. Direct-drive machines, which have no gearbox or high-speed
mechanical components, are normally quieter. Various measures to reduce noise have been implemented in the design of modern
turbines. As wind turbines have become more efficient, more of the wind is converted into rotational torque and less into acoustic noise.
In the design and the planning stage of a wind farm, semi-empirical prediction models and software tools are used to predict
noise emissions. Today, noise impact prediction is supported by the use of appropriate software. The performance of a background
noise survey around the site will help identify the dwellings that are most sensitive with respect to noise and the wind speed at which
the greatest noise impact from the development will occur. Special attention should be paid in analyzing the noise propagation
pattern for all the basic wind directions, taking also into consideration the corresponding downwind geomorphology and topogra
phy. Appropriate analytical methods can support the relevant surveys and advise on all stages of the process. Acceptability standards
for noise vary by nation, state, and locality. They can also vary depending on time of day, since nighttime standards are generally
stricter.
55
Background
WT
Limit
53
51
49
dB (A)
47
45
43
41
39
37
35
4
6
8
10
12
Wind Speed (m/s)
Figure 13 Qualitative comparison of wind turbine noise and background noise as a function of wind speed at 10 m height [16].
518
Environmental-Social Benefits/Impacts of Wind Power
60
Background noise
50
Noise Level (dB(A))
WTs in Operation
Measurement
Point: 100 m
40
30
20
10
0
5.1
6
6.6
Wind Speed at 10m height (m/s)
6.9
Figure 14 Noise level measurements for different wind speed values [14].
60
WTs in Operation-Measurements
ISO 9613-2
Danish rules
Point 1-Near
Noise Level (dB(A))
50
40
30
20
10
0
5.1
6
6.6
Wind Speed at 10 m A (m/s)
6.9
Figure 15 Experimental measurements in comparison with the calculations using ISO-9613-2 and Danish Rules 2007 model [14].
2.16.6.2
Research and Development Relevant to Wind Turbine Noise
Acoustics researchers are investigating the causes of wind turbine noise with the aim of making them quieter. Computer models are
developed to predict the noise output from wind farms so that the effectiveness of potential noise-reducing designs and control
methods to be accurately and quickly assessed.
In fact, the noise generated from wind turbines is the same sort of noise generated at the edge of aircraft wings and is caused as
the turbulent air flows over the sharp edge of the blade. However, it is not known how the flow turbulence and the blade edge, or
boundary layer, interact and how that makes the noise louder. When this fundamental mechanism is understood, then ways of
controlling and reducing the noise can be looked at, through perhaps changing the shape of the rotor blades (without reducing the
machine efficiency) or using active control devices at the blade edges to disrupt the pattern of turbulence [16].
2.16.7 Wind Turbines’ Visual Impact and Aesthetics
2.16.7.1
General Considerations on Visual Impact and Aesthetics
Windmills have been in operation during the last 1000 years all over Europe. However, recently, due to the significant number and
size of wind turbines installed, the matter of landscape aesthetics has been revived. Actually, wind turbines have been subject to
severe criticism because they are ‘a new element’ and because they are located in highly visible places (e.g., mountains) in order to
exploit wind conditions.
In this context, visual impacts are often among the major objections to the development of wind power systems, and a question
that should not be ignored when trying to identify their location. It is obvious that the reaction to the sight of a wind farm is highly
Environmental-Social Benefits/Impacts of Wind Power
Landscape
Domains:
519
Environment Human/Societal
Economic
Human
Valuation of
Landscape:
Scientific/
Cultural
Aesthetic
Utility
Aesthetic
Impact
Impact:
Objective
Aesthetic
Impact
Subjective
Aesthetic
Impact
Figure 16 Landscape and aesthetic impact: the three landscape domains.
subjective. Many people believe that they are a welcome symbol of clean energy, whereas others find them disturbing additions to
the landscape. Thus, although a wind plant is clearly a man-made structure, what it represents may be seen either as a positive or
negative addition to the landscape. More precisely, landscape perceptions and visual impacts are key environmental issues in
determining wind farm applications, as landscape and visual impacts are, by nature, subjective and changing over time and
location.
The broad term ‘visual impact’ includes two distinct facets: the landscape impact and the aesthetic impact. The landscape
components can be measured more easily as they are related to physical properties. The aesthetic/human appraisal is much more
complex since it depends on subjective landscape perception. Figure 16 shows the major landscape domains.
As far as the landscape components are concerned, in general, the visibility of a particular wind energy system will depend on
many factors, including tower height, proximity to neighbors and roadways, local terrain and tree coverage, color or contrast, size,
shadow flickering, the time when the turbine is moving or is stationary, the local turbine history, public acceptance, and knowledge
of renewable energy technologies. Whatever the surrounding environment is, the developer should try to reduce the visual impact as
much as possible.
Table 9 is a synthesis of the various factors affecting seriously the visual impacts of a wind park.
There is no doubt that the visual impacts decrease with the distance. The affected areas are called zones and may be defined as
indicated in Table 10.
There are various methods for assessing the aesthetic impacts and many research works have been carried out either for the
development of a specific methodology or for the analysis of a specific case study [17–23].
The so-called ‘Spanish method’ attempts to quantify the visual impact of a wind park [17]. It is supported by advanced
information technology (IT) tools. More specifically, a 3D analysis of the wind farm and its surrounding area is carried out to
Table 9
Various factors affecting the visual impacts of a wind park
Number of turbines
Size of the turbines
Tower height
Color and contrast of the turbines
Form and appearance of the turbines
Surface elevation and topography
Type of landscape
Proximity to neighbors and roadways
Table 10
Local terrain and tree coverage
Shadow flickering
Time that the turbine is stationery or moving
Access and site tracks
Substation buildings
Grid connection
Anemometer masts
Transmission lines
Definition of zones according to the distance from the wind turbines [9]
Zone
Distance (depending on visibility and
weather conditions)
I
II
III
IV
Up to 2 km
1–4.5 km
2–8 km (in good weather conditions)
Over 7 km
Characteristics – visibility
Visually dominate
Visually intrusive
Noticeable, turbines clearly visible but not intrusive. Turbines appear small in overall view.
Element within distant landscape. The apparent size of the turbines is very small, as any other
element in the landscape.
520
Environmental-Social Benefits/Impacts of Wind Power
Diagonal
Longitudinal
Diagonal
Front
Wind Farm Area
Diagonal
Longitudinal
Front
Diagonal
Figure 17 Points of view of a wind park [17].
obtain simulated images describing regions that are potentially affected. Subsequently, a visual impact evaluation matrix applied
over the neighboring villages is obtained. The method uses geographical information systems (GIS) and computer-aided design
(CAD) systems. Figure 17 shows various views of a typical wind farm as elaborated for the method [17].
The basic objective of the method is to develop quantitative indexes for the rational evaluation of the visual impacts of a wind
park. The method has been applied by Tsoutsos et al. [18] for the visual assessment of a wind park in the Greek island of Crete. The
basic steps that have been followed include the recording of the main parameters that affect the visibility of the wind turbines. Also,
the visibility of some points of interest around the wind park is investigated. Accordingly, the calculation of properly defined
coefficients to be used in the impact estimation is made, and finally, the total evaluation of the installation visual impact is
performed.
The process of recording the necessary coefficients for a typical medium-sized wind park located between two remote villages is
shown in Figure 18.
In Torres et al. [19], the aesthetics aspects in the integration of wind farms into the landscape are emphasized, by using
photographs and interviews to develop an objective indicator. The indicator combines measures of visibility, color, fractality, and
continuity that can be taken from photographs. Value functions are constructed for each variable and incorporated into the
indicator. This indicator has been used to calculate the objective aesthetic impact of five wind farms. Comparison of the indicator
results with a population survey shows that the indicator correctly represents the order of impact as perceived by the population
sample, and is thus an appropriate objective measure of aesthetic impact of wind farms.
In Ladenburg [20], the focus of the assessment is placed on the observer’s prior experience with a technology and public
surveys to develop the proposed analysis are used. The importance of parameters such as distance, contrast, and motion in the
visual impact assessment with the use of photographs, computer simulations, and interviews is mentioned by Bishop and Miller
[21]. According to the results of this work, the visual impacts are reduced as the distance increases from the wind park. These
methodologies are useful for the assessment of the visual impact of a single technology (e.g., wind farms) on the local scale (a
single project).
Subsequently, in the work of Molina-Ruiz et al. [22] the use of IT tools is examined (Geographical Information Systems and
Multi-Criteria Decision Analysis) to facilitate the visual impact evaluation. Accordingly, Rodrigues et al. [23] suggested a method for
the global assessment of the visual impact on the landscape of renewable energy. A number of quantitative indexes for the visual
impact (objective) and the visual perspective (subjective) estimations are introduced. For the visual impact index estimation, a
process for determining whether a location is visually affected by a wind park or not is presented (Figure 19).
Environmental-Social Benefits/Impacts of Wind Power
521
Recording of all the points of interest (rural
streets, churches, villages) which have a view
of the wind park and measurement of
coordinates of each point by the usse of GPS
Recording of numbers of residents and
houses in the two villages near the wind park
Photographing of the wind park from each
point of interest for the visible wind turbines
counting – photographing of the two villages
from the park for the visible houses counting
Aerial photographing for the threedimensional depiction of the wind park
Marking the points of the interset on the
map and on the aerial photograph of the
region using photomaps and AutoCAD
Measuring of the distances of the points of
interest from each wind turbine by processing
the coordinates of the Regional map using
AutoCAD
Figure 18 Process of recording the Spanish method coefficients [18].
O
Δt
O
Δt
Figure 19 Procedure to establish whether an observation pixel is visually affected [23].
The visual perception index that is introduced relates the visual nuisance with the number of the wind turbines and the distance
from the observer (Figure 20) [23]. The estimations of the work indicate that for a level of wind energy penetration of 16% of the total
electricity generated in 2007, in Spain, 1.7% of the country’s territory would be occupied by renewable facilities, but these would be
visible from 17% of the territory, and during more than 15% of road-travel time. The proposed methodology for the estimation of the
visual impact allows for quantitative comparisons among several scenarios of energy generation with renewable technologies. This is
particularly useful when working at regional scales, where impact assessment is more difficult and the proposed indexes can provide
an objective and concise basis for comparison. A further strength of the methodology is its reliance on standards, and largely published
(public) data as model inputs. With additional work, further refinements can be incorporated into the proposed methodology. For
instance, color contrast between the facility and the background can be taken into account; and human subjectivity can be considered
by relating the numerical values of the visual perception index to acceptability, with the aid of specifically developed questionnaires to
determine the final level of visual impact [12, 24].
It is important to mention at this point that professional designers have been employed by several wind turbine manufacturers
to enhance the appearance of their machines. Finally, if turbines remain out of order for a remarkable time period, the public may
522
Environmental-Social Benefits/Impacts of Wind Power
100
1 Wind turbine
Perception index (%)
10
5 Wind turbines
10 Wind turbines
1
20 Wind turbines
0.1
0.01
0.001
0.0001
0.00001
0
2
4
6
8
Observation distance (km)
10
12
Figure 20 Reference values for the perception index as a function of the number of wind turbines and the observer distance [23].
perceive a wind farm to be unjustified – a waste of visual resources. Thus, when turbines do not operate or are perceived as often
broken, the public is far less likely to tolerate the turbines’ intrusion on the landscape.
2.16.7.2
Shadow Flickering
Shadow flicker occurs when – at precise latitude, wind direction and height of the sun – rotating wind turbine blades cast shadows
upon stationary objects. Shadow flicker only appears under very specific conditions and does not occur simply because the sun is
shining and the blades are in motion.
This phenomenon will cause disturbance for residents living in the surrounding area of the turbine. Actually, this moving shadow,
at a frequency of three times the rotor speeds (where the turbine has three blades), can lead to a pulsating light level especially in
rooms that are naturally lit. For shadow flicker to occur at all, the windows of the nearby residence have to directly face the wind
turbine (such rooms with windows are referred to as ‘receptors’) with no obstructions (trees, hills, other structures) in sight.
If there is no sun, there is no shadow flicker. Reduced visibility situations like haze, fog, and clouds vastly reduce the chance of
anyone experiencing shadow flicker.
In addition, the reflection of the sun’s ray shining on the turbine is caused by the periodic flashes of light. In most cases, these localized
effects may be easily predicted and avoided by careful turbine-siting and appropriate surface finish of the blades as well as by coating the
turbine with a material having less reflective properties. Table 11 shows the intensity of the shadow flickering with its occurrence condition.
However, the effect can be precisely calculated to determine whether a flickering shadow will fall on a given location near a wind
farm and how many hours in a year it will do so. Potential problems can be easily identified using existing analytical methods, and
solutions range from the appropriate setback of the turbines to planting trees disrupt the effect.
The problem of shadows caused by wind turbines is not a serious issue because the turbines are relatively small and therefore do
not result in long shadows. More specifically, this is a problem only when turbines are sited very close to workplaces or dwellings
and occurs during periods of direct sunlight. These effects may be easily predicted and avoided by carefully considering the
machine-site and the surface finish of the blades. A common guideline used in northern Europe is a minimum distance of six to
eight rotor diameters between the wind turbine and the closest neighbor. A house, 300 m from a contemporary 600 kW machine
with a rotor diameter of 40 m, will be exposed to moving shadows approximately 17–18 h (out of 8760 h) annually.
2.16.8 Impacts in Fauna and Flora and Microclimate
2.16.8.1
Impacts in Flora and Fauna
Wind is the energy source that is considered friendly and most compatible with animals and human beings. Wind energy’s ability to
generate electricity without many of the environmental impacts associated with other energy sources (air pollution, water pollution,
greenhouse gas emissions associated with global climate change) can significantly benefit birds and many other plant and animal species.
Table 11
Intensity of shadow flickering with its occurrence condition [4]
Intensity of shadow flickering
Condition
Higher shadow flickering intensity
Sunrise or sunset where the cast shadows are sufficiently long
Wind turbine rotor plane is perpendicular to the sun receptor (rotor diameter)
Larger wind turbine
Smaller distance with resident
Wind turbine rotor plane is in plane with the sun (blade thickness)
Lower shadow flickering intensity
Environmental-Social Benefits/Impacts of Wind Power
523
However, the threat of wind turbines for animals, especially birds, and some occurrences of bird collision with them has been
one of the main issues for people reacting against wind turbines. Bird and bat deaths are one of the most controversial biological
issues related to wind turbines. The deaths of birds and bats in wind farm sites have raised concerns by wildlife agencies and
conservation groups. On the other hand, several large wind energy facilities have operated for years with only minor impacts on
these animals.
To try to address this issue, the wind energy industry and government agencies have sponsored research into collisions, relevant
bird and bat behavior, mitigation measures, and appropriate study design protocols. In addition, project developers are required to
collect data through monitoring efforts at existing and proposed wind energy sites. Careful site selection is needed to minimize
fatalities, and in some cases, additional research may be needed to address bird and bat impact issues.
While structures such as smokestacks, lighthouses, tall buildings, radio, and television towers have also been associated with
animal kills, their mortality is a serious concern for the wind energy industry.
On the other hand, wind turbines per se are responsible only for a small portion of the total number of bird causalities caused by
human builds. It is believed that the variable-speed turbine is a more serious threat as there is a correlation between the speed of
rotation and the number of birds killed. Birds have much more time to evade the blades of a fixed speed turbine [25].
The wildlife impacts can be categorized into direct and indirect impacts. The direct impact is the mortality from collisions with a
wind energy plant, while the indirect impacts are the area avoidance, habitat disruption, and displacement. The potential
disturbance to fauna caused by wind turbines, a factor of moderate importance, relates to incidents where birds collide with
rotor blades. However, the populations of many bird species are experiencing long-term declines, due not only to the effects of
energy use but also to many other human activities. Especially in highways, birds and bats sometimes die as a result of collisions
with vehicles.
On the other hand, the number of birds killed by wind turbines can be negligible compared to other human activities [26]. It was
found that out of the total number of birds killed in a year, only 20 deaths were due to wind turbines (for an installed capacity of
1000 MW), while 1500 deaths were caused by hunters and 2000 caused by collisions with vehicles and electricity transmission lines.
The American Wind Energy Association (AWEA) calculates that if wind energy were used to generate 100% of US electricity needs, it
would only cause one bird death for every 250 human-related bird deaths with reference to the current rate of bird kills as described
in Table 12.
In some cases, some species under extinction are in threat in the areas that wind farms are planned and this is an issue that causes
serious reactions of nongovernmental environmental organizations and the public.
Mitigation measures to minimize impacts may vary by site and species, but some common findings and suggestions are shown
in Table 13 [25–27].
2.16.8.2
Impacts on the Microclimate
Wind farms affect the microclimate of the area where they are installed. According to researchers at the United States Department of
Energy’s Ames Laboratory and the University of Colorado at Boulder, wind turbines not only generate electricity but may also prove
to be advantageous to crops. Results of a new study show that wind turbines produce measurable effects on the microclimate near
crops. Wind turbine turbulence, in particular, has a positive impact on the crops below through the increased airflow it produces.
Wind turbines might reduce temperature extremes and lengthen growing seasons. Also, other benefits of wind turbines could result
from their effects on crop moisture levels. Extra turbulence may help dry the dew that settles on plants beginning in late afternoon,
minimizing the amount of time fungi and toxins can grow on plant leaves. Additionally, drier crops at harvest help farmers reduce
the cost of artificially drying corn or soybeans [28].
In fact, wind turbines have an impact on the temperatures near the ground that affect crop growth. Wind turbine turbulence both
warms and cools the nearby ground, depending upon the time of day, with temperature change varying between 0.4 and 1.5 °C.
Table 12
Leading human-related causes of bird kills in the United States
Human-related causes
Number of birds kill per year
(million)
Cats
Buildings – windows
Hunters
Vehicles
Communication towers
Pesticides
Power lines
Wind turbines
100
550
100
60–80
10–40
67
130
0.15
Based on data from Saidur et al. [4] and Torres et al. [9].
524
Table 13
Environmental-Social Benefits/Impacts of Wind Power
Mitigation measures for wildlife protection from wind turbines
Important zones of conservation and sensitivity areas should be avoided
Sensitive habitats have to be protected by implementing appropriate working practices
Adequate design of wind farms: siting turbines close together and grouping them to avoid alignment perpendicular to the main flight paths
Provide corridors between clusters of wind turbines when necessary
Underground transmission cables installation, especially in sensitive areas, where possible
Increase the visibility of rotor blades: make overhead cables more visible using deflectors and avoiding use in areas of high bird concentrations, especially
of species vulnerable to collision
Relocation of conflictive turbines
Presence of biologist or ecologist during construction in sensitive locations
Stop operation during peak migration periods
Rotor speed reduction in critical periods
Extra air turbulence likely speeds up the heat exchange between crops and the atmosphere, so crops stay slightly cooler during
hot days. During evenings, turbulence stirs the lower atmosphere and keeps temperatures around the crops warmer during the
night. Therefore, turbines’ effects are anticipated to be good in the spring and fall because they would keep the crop a little
warmer and help prevent a frost and practically extend the growing season. These early findings need to establish whether wind
turbines are in fact beneficial to the health and yield potential of soybean and corn. Still, the researchers believe that this is a
realistic possibility.
In one of the first research works to investigate that question, scientists have modeled the impact of a hypothetical large-scale
wind farm. Their conclusion, reported in the Journal of Geophysical Research [28], is that thousands of turbines concentrated in one
area can affect local weather. The impact comes not so much from the turbines’ rotor blades slowing down the air but from
atmospheric mixing that occurs in the blades’ wake. This creates warmer, drier conditions at the surface. The great impact upon local
meteorology is caused by the turbulence generated by the rotor.
2.16.9 Other Environmental Impacts
2.16.9.1
Interference of a Wind Turbine with Electromagnetic Communication Systems
Wind turbines in some areas can reflect electromagnetic waves (mainly due to the moving blades), which will be scattered and
diffracted. This means that wind turbines can potentially disrupt electromagnetic signals used in telecommunications, navigation,
and radar services. The degree and the nature of the interference will depend on the following:
•
•
•
•
The location of the wind turbine between transmitter and receiver
Characteristics of the rotor blades, and characteristics of receiver
Signal frequency
The radio wave propagation in the local atmosphere.
Interference can be produced by three elements of a wind turbine: the tower, the rotating blades, and the generator. The tower and
blades may obstruct, reflect, or refract the electromagnetic waves. However, modern blades are made of synthetic materials having
minimal impact on the transmission of electromagnetic radiation. The electrical system is not usually a problem for telecom
munications because interference may be eliminated with proper nacelle insulation and good maintenance. Interference on TV
signals can be minimized with the substitution of metal blades with synthetic materials. However, when turbines are installed
very close to dwellings, interference has been proven difficult to rule out. It is believed that all these effects can be prevented or
corrected by adequate design and location selection using simple technical measures such as the installation of additional
transmission masts.
2.16.9.2
Traffic – Transportation and Access
Increased traffic would mainly occur over the construction period of the wind farm. Once operational, the wind farm will have a
small number of visits, only for maintenance purposes, and thus minor need for transportation.
2.16.9.3
Archaeology and Cultural Heritage
In the context of an EIA, an archaeological assessment needs also to be carried out. The objectives of this assessment are to gain
information about the known or potential archaeological resource within the given area. In general, wind turbines and all associated
infrastructure are located in such a way that any archaeological disturbance is minimized or avoided.
Environmental-Social Benefits/Impacts of Wind Power
2.16.9.4
525
Health and Safety
Unlike most other generation technologies, wind turbines do not use combustion to generate electricity, and hence do not
produce air emissions. The only potentially toxic or hazardous materials are relatively small amounts of lubricating oils and
hydraulic and insulating fluids. Therefore, contamination of surface or ground water or soils is highly unlikely. The primary
health and safety considerations are related to blade movement and the presence of industrial equipment in areas potentially
accessible to the public.
2.16.10 Offshore Environmental Impacts
Offshore wind power gains an increasing contribution as a power source and has very good prospects for the coming years.
A detailed description of the offshore wind power plants is provided in the corresponding Chapter 2.17.
The environmental impacts of offshore wind power are similar – at least as far as their categories are concerned – to the already
analyzed impacts caused by onshore wind parks. In general, there is no clear indication whether offshore plants are more beneficial, as
far as their environmental impacts are concerned, compared to onshore plants. The seascape and marine environment are very
different and very special and certainly the inland and the sea environment cannot easily compare to each other.
However the construction and the operation of offshore wind farms have additional environmental impacts that should be
described separately. Therefore, the objective of the current section is to provide a short presentation of the environmental benefits
and impacts of offshore wind power plants, taking into account that still necessary knowledge improvements need to be acquired in
many offshore issues including that of environmental impacts.
European Directives, such as the Strategic Environmental Assessment (SEA), Birds and Habitats Directive require that countries
undertake responsibility for assessing the major impacts of offshore plants on the environment. In fact, a set of procedures have
been applied for the reliable identification of impacts, including boat-based and aerial surveys and a wide variety of tools such as
radars, cameras, and measurement instruments [29].
Research on these issues is carried out mainly in countries that have developed serious offshore wind projects, such as the United
Kingdom and Denmark. For example, UK Collaborative Offshore Windfarm Research Into the Environment (COWRIE) is a registered
charity set up to advance and improve understanding and knowledge of the potential environmental impacts of offshore wind farm
development in UK waters and develops a series of reports dedicated to specific environmental impacts of offshore wind power [29].
The environmental benefits of offshore wind power plants compared to conventional energy sources are the same with onshore
wind power plants and more specifically:
•
•
•
•
the reduction of carbon dioxide emissions
the reduction of air pollutants emitted from thermal power stations
the reduction of the fossil fuels (oil, natural gas, coal) consumption
the reduction of water consumption.
The identification of offshore environmental benefits compared to the onshore wind power plants is an interesting issue that needs
detailed analysis. However, the minimum use of land, the avoided noise, and visual impacts are some of the main driving forces for
the development of offshore wind power plants. Nevertheless, from an ecological point of view, the seawater near the coastline has a
high ecological value and important habitats for breeding, resting, and migratory seabirds; therefore, special attention should be
paid in this direction.
Offshore wind power projects are more complex than onshore ones. In the construction period, offshore developments include
the installation of platforms, turbines, cables, substations, grids, interconnection and shipping, dredging, and the associated
building works. The operation and maintenance activities include the transport of employees by special vessels and helicopters
and occasional hardware retrofits.
The environmental parameters that should be considered for an offshore EIA in the construction and operation phases are
presented in Table 14.
Up to now, most of the experience gained in the environmental impacts assessment of offshore wind energy available in the
open literature comes from several years of monitoring three wind farms in Denmark. Valuable analysis has also been carried out by
the Federal Environment Ministry (BMU) of Germany through technical, environmental, and nature conservation research about
offshore wind energy foundations.
Furthermore, it is worthwhile mentioning that wind farms may differ significantly in various characteristics, such as construction
materials, support structures, distance from the coastline, and layout. All these factors affect significantly their environmental
impacts and should be taken into account in detail and distinctively (see, e.g., Reference 30).
2.16.10.1
Offshore Noise Impact
One of the main concerns for onshore wind parks is the noise. Since offshore wind parks are quite far away from human
populations, people are not affected by the noise generated by offshore wind turbines and this impact, as far as people are
concerned, is eliminated.
526
Environmental-Social Benefits/Impacts of Wind Power
Table 14
Main environmental impacts of offshore wind power plants
Noise
Visual impacts – aesthetics
Impacts on marine mammals
Impacts on birds
Impacts on fish
Artificial reefs
Electromagnetic radiation
Impacts on the microclimate
Water turbidity
However, the noise generated from the wind turbines operation travels underwater and marine animals could be affected. Any
effects of the noise will depend on the acoustic sensitivity of the species and their ability to adjust to it. For example, underwater
noise can be a serious problem for some marine animals, particularly whales, dolphins, and seals.
The acoustic noise emission from offshore wind turbines as well as its propagation is affected by various parameters, including
•
•
•
•
•
Wind turbine parameters: rated power, rotor diameter
Type of foundation, material, pile depth
Effective pile-driving and/or vibration energy
Period of construction phase and blow or vibrator frequency
Depth of water at the site.
2.16.10.2
Construction and Decommissioning Noise
Construction and decommissioning noise comes from machines and vessels, pile-driving, explosions, and installation of wind
turbines. Indicatively, measurements carried out during construction of a wind farm in the United Kingdom indicated the
following [31]:
• The peak noise of pile hammering at 5 m depth was 260 dB and at 10 m depth was 262 dB
• There were no preferential directions for propagation of noise
• The behavior of marine mammals and fish could be influenced several kilometers away from the turbine.
Table 15 shows the expected avoidance reaction of marine species due to pile-driving during the construction of a wind farm [9].
2.16.10.3
Operational Noise
In the operational phase, the sound generated in the gearbox and the generator is transmitted by the tower wall, resulting in sound
propagation underwater. Measurements of the noise emitted into the air from wind turbines and transformers have shown a
negligible contribution to the underwater noise level. The underwater noise from wind turbines is not higher than the ambient noise
level in the frequency range above approximately 1 kHz, but it is higher below approximately 1 kHz. The noise may have an impact
on the benthic fauna, fish, and marine mammals in the vicinity of wind turbine foundations.
Operational noise from single turbines of maximum rated power of 1.5 MW in a distance of 110 m at high wind speeds of
12 m s−1 has been measured and the one-third octave sound pressure level has been found between 90 and 115 dB [31].
The anthropogenic noise may produce both behavioral and physiological impacts on sea life. Impacts on behavior include the
following:
• Attraction to or avoidance of the area
• Panic
• Increases in the intensity of vocal communication.
Table 15
Calculated ranges for avoidance distance for different marine species [9]
Species
Distance
(m)
Species
Distance
(m)
Salmon
Cod
Dab
1400
5500
100
Bottlenose dolphin
Harbour porpoise
Harbour seal
4600
1400
2000
Environmental-Social Benefits/Impacts of Wind Power
527
Reports about noise impact on fish have shown a range of effects, from avoidance behavior to physiological impacts. Changes in
behavior could make fish vacate feeding and spawning areas and migration routes. Studies of noise impact on invertebrates and
planktonic organisms have a general consensus of very few effects, unless the organisms are very close to the powerful noise source.
Special vessels are involved in the construction of wind parks and also during the operational phase for maintenance of wind
turbines and platforms. The noise from vessels depends on their size and speed, although there are variations between similar
classes. Vessels of medium size range produce sounds with a frequency mainly between 20 Hz and 10 kHz and levels between 130
and 160 dB at 1 m [31].
Measurements from one 1500 kW wind turbine carried out by the German Federal Ministry of the Environment indicated that
operational noise emissions do not damage the hearing systems of marine sea life. Concerning behavior, the same study stated that
it is not clear whether noise from turbines has an influence on marine animals [32].
2.16.10.4
Visual Impacts
Experience with onshore wind farm developments has demonstrated that landscape and visual issues are the most usual reasons for
public objection. If developers address this issue thoroughly in the EIA and, more importantly, if they mitigate any potential visual
impacts, public concerns and any related inquiry will be answered properly and potential reactions will be stopped.
Siting the wind farms out at sea is not proving to be totally out of sight. Largely due to the size of the structures, their color,
movement, and their locations being open, the examples erected to date may be clearly visible from land. As great scenic or other
landscape value is attached to many parts of the coastline, careful design process is still required.
The everyday meaning of seascape is ‘the coastal landscape and adjoining areas of open water, including views from land to sea,
from sea to land and along the coastline’, and describes ‘the effect on landscape at the confluence of sea and land’ [33]. Every
seascape therefore has three defined components (Figure 21):
• An area of sea (the seaward component)
• A length of coastline (the coastline component)
• An area of land (the landward component).
Offshore wind farms involve several elements that have influence on the character of the produced visual impact [33]:
• The site and size of wind farm area
• The wind turbines: size, construction materials, and colors
• The layout and spacing of wind farms and associated structures
• Location, dimension, and form of ancillary onshore (substation, pylons, overhead lines, underground cables) and offshore
structures (substation and anemometer masts)
• Navigational visibility, markings, and lights
• The transportation and maintenance vessels
• The pier, slipway, or port to be used by vessels
• Road or track access, and access requirements to the coast.
The tools usually employed to predict the potential effects of new offshore developments, just as in the corresponding onshore ones,
are the zones, photomontages, and video montages [9].
Figure 21 The three basic components of the seascape [33].