Bài tập phân tích điểm hòa vốn quyết định đưa sản phẩm ra thị trường và phân tích hồi quy e
Bạn đang xem bản rút gọn của tài liệu. Xem và tải ngay bản đầy đủ của tài liệu tại đây (1.37 MB, 19 trang )
Bài tập Phân tích điểm hòa vốn Quyết định đưa sản phẩm
ra thị trường và phân tích hồi quy
1. Analysis of the breakeven point - Decision to bring products to market.
2. Regression analyzes.
1
TABLE OF CONTENTS
TABLE OF CONTENTS..........................................................2
PREAMBLE...........................................................................3
RESEARCH OF CONTENT.....................................................4
1. Rationale for resolving issues raised in Exercise 1.....................................4
1.1 New products and problems faced by developing new products..........4
2.2 To minimize the risk of launching new products to the market............4
2. Solve problems posed in exercises 1..........................................................6
3. Rationale to resolve issues raised in exercise 2..........................................8
4. Solve the problem posed in exercise 2........................................................9
4.1 Determination regression function between the variables and analyze
the impact of each factor to the variables:.............................................................9
4.2 Inspection of the real impact of each factor to the amount of goods
with a significance level of 5%............................................................................13
4.2.1 Inspection of the regression coefficient β1 whether actual
relationship between the number of workers per shift (X1) with the volume of
goods placed in shifts (Y)................................................................................14
4.2.2 Inspection of the regression coefficient β2 whether actual
relationship between the number of trucks (X2) with the volume of goods
placed in shifts (Y)..........................................................................................14
4.2.3 Inspection of the regression coefficient β3 whether real
relationship between the number of excavators (X3) with the volume of goods
placed in shifts (Y)..........................................................................................15
4.3 Coefficient of multiple determination and sense.................................15
4.4 Testing the suitability of the model.....................................................16
4.5 Prediction of loading and unloading of goods....................................17
CONCLUSION.....................................................................18
LIST OF REFERENCES........................................................19
2
PREAMBLE
Basic content management operations are making the decision, because the
administration of an organization from the simple daily tasks to the major strategic,
long-term basis and are based on the appropriate decisions. Administrators desired
outcomes like other words, it is the goal set for management decisions. To be able to
perform well this step, administrators should regularly monitor and supervise the
implementation of the plan and the plan chosen. Catch the information used is correct?
Planning is done how? Outcomes of the plan laid out? In the process of implementing
decisions will arise many problems yourself administrators and colleagues could not
foresee. Therefore, the monitoring and inspection will help administrators understand
the problems arising to be addressed in the implementation of the decision. On that
basis, conduct revise, supplement or amendment to management decisions in
accordance with the actual job requirements and so the results will be better.
An effective decision is logical decisions based on the information available
and reflect the preferences of the decision maker. The important thing to understand
here is that the effectiveness of the decision is not related to its effects. A good
decision can bring both good and bad consequences. Similarly, a bad decision
(decision due to lack of information or does not reflect the preferences of the decision)
can bring a positive result. The decision to achieve the objectives effectively with the
considerations of cost, effort and related consequences. Whether alternative measures
to bring negative consequences for choices made are expected to be less than zero?
Decisions must also pay attention to side effects or indirect advantage. A candidate for
the position the employee may have the ability to excel not directly related to the
ability to work, but this could be useful for the company. Again, remember to pay
attention to this.
3
RESEARCH OF CONTENT
1. Rationale for resolving issues raised in Exercise 1
1.1 New products and problems faced by developing new products
With the rapidly changing consumer tastes, technology and competitive
manufacturing market, a business can not rely on its existing products are. Customers
always want and expect new products and more complete. The opponent will do our
best to launch products with high competitiveness. So every business should have a
program to develop new products.
Businesses can get a new product in two ways: one is through the acquisition
(asquisition), by purchasing a business, a patent, or a license to manufacture other
products. The second way is through the development of new products, by forming
part of research and development itself or contract with individuals and organizations
in research and development to implementation. We will focus on the analysis of the
development process of new products.
Today in developed countries, only about 10% of the new product is really new
to the world. These products cost and great risk, because they both for new businesses
and markets. Therefore, most businesses tend to focus their efforts on research to
improve existing products rather than research and development of new products. For
example, Sony spent 80% of new product activity for the improvement of its existing
products.
The development of new products fail more often than succeed. Why have
many new products fail? There are many reasons. A senior administrator may have
supported the idea that he preferred, despite the results showed that the adverse
marketing. Or the idea is good, but people have overestimated the size of its market.
Or the product has not been made perfectly adequate. Or it was the wrong position in
the market, or advertising are not careful, or so overvalued. Sometimes the cost to
deploy higher than expected, or the competitors reacted strongly than now planned. So
the situation now facing the dilemma, they must deploy new products but not sure
what success. Businesses can reduce risk by planning more systematic and establish a
process of developing new products more efficiently.
2.2 To minimize the risk of launching new products to the market
4
The development of new products starts with finding new ideas. A business
often have formed many ideas to find the best ideas. The search for new ideas must be
conducted in a systematic way and can not be a coincidence.
To form new ideas about products, enterprises must actively studied from many
different sources.
-Customer. Marketing standpoint, the needs and expectations of customers is
the starting point for any new product ideas. Through the study of the major groups of
customers using products now in the polls, interviews and tests or exchange personal
focus groups and through the suggestion, their complaints, joint can now find out what
the requirements for product improvement they pose for manufacturers and
researchers to develop products that can detect ideas or creative inspiration for new
products.
- The leading experts. Businesses can also rely on the opinion of leading
scientists, engineers, designers and skilled in outside businesses to form ideas about
new products.
- Competitors. Learn intention of competitors and researching their products
and why customers choose to use competitors 'products is a great way to make
product improvements than competitors' products competition.
- The supplier and distributor phamla a source of important information for
shaping the idea feasible. They always are close customer, understand ideas praise or
complain about products now from our customers, so there may be a good idea in
designing innovative products to deal better meet the demands and expectations of
customers.
- Leadership is now a major source of new ideas arising product. They can
propose and implementation to the idea of their new products or support the idea that
they are promising success, or not to accept an idea is good but they are not
appreciated.
During this period, in order to overcome these errors can occur, businesses can
apply the method conceived as methods listed properties (analyze, evaluate the
properties are, from design solutions that improve and create new products), the
morphological analysis (detection of structural survey of the relationship between
them and find new ways of combining), the detection of needs and problems through
5
customer reviews, or method of creative brainstorming in groups (encouraged to
provide as many ideas as possible, not to criticize, encourage and develop combined
standard idea).
2. Solve problems posed in exercises 1
a) According to the principle of A:
With the assumption that the demand for products with a normal distribution,
the principle of a speech that will bring products to market if μ> BE (the Break-even
point). According to the information given by the fan market that the company is
consumed with an average consumption of the product μ = 4000 and 3500 new
product, the break in the first year. Therefore, companies should put this fan on the
market. The decision can be illustrated as the following graph:
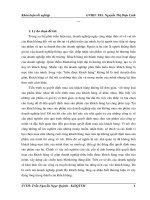
b) Draw a graph of a normal distribution:
We see 4000 as the average consumption. If the Break-even point is 3500
products then (D> BE)> 0.5, while the average for 4000 will be greater than 3500.
c) Show that the two principles lead to one decision:
- In principle B:
6
According to the calculations above, the probability that the demand is greater
than the Break-even point, ie P (D> 3500) = 0.8413. This probability is greater than
minimal risk that the company wants is 0.8. Thus says the principle B, then the
company should bring products to market.
There are presently estimated by the 2nd is the average demand at the
breakeven point M:
M=BE – zpσ với P(z>zp)=p
With p = 0.8, so P (z> ZP) = 0.8, thus ZP = -0.84
So M=3500+0,84*500=3920. I still get 4000> 3920, thus company should still
bring products to market. Illustrations calculated as the graph below.
7
3. Rationale to resolve issues raised in exercise 2
Also known as multiple regression method, using analysis of the relationship
between several independent variables (ie explanatory variables or variable causes)
affects 1 dependent variables (ie, variables or variable analysis results).
In fact, there are many economic problems - both areas of business and
economics, require multiple regression method. Such as analysis of the factors
affecting the national income, the volatility of foreign exchange rates; Reviews of
revenue in case of multiple items; analyze the total cost of the many factors that
impact; detailed cost analysis; causes affecting mass consumption ...
An economic indicators simultaneously affected by many factors positively or
mixed together. Such as sales and prices dependent, socially average income, interest
rate, seasons, weather, advertising and marketing,etc,... On the other hand, among the
factors to correlate well with the linear internal in together. Regression analysis has
helped us test the hypotheses about the impact of these factors and the impact, both
quantitative economic relations between them. Since then, as the basis for analyzing
and forecasting the appropriate policy decisions, efficiency, promote growth.
8
Multivariate regression equations as linear:
Y = b0 + b1X1 + b2X2 + … + biXi + bnXn + e
(1.12)
Where: Y: the dependent variable (analysis); b0: launch of the original;
b1: the slope of the equation according to the variables Xi;
Xi: variables (factors influence); e: error terms
Note: Y in the above equation is expressed as Y estimates, it is often written in
the form of fertile (Yˆ ).
The goal of regression method is based on historical data variables Yi, Xi, the
algorithm used to find the parameters b0 and bi build regression equation to predict
the average estimate of variable Yi.
From research and content analysis methods can find systems analysis includes
factors closely related to each other: details, compare, contact, eliminating (replace
continuous), correlation regression,etc,... mission of the Organization for business
analysis is to build relationships between these factors in each specific content
analysis such as production, supply and consumption, costs, financial,etc,... to
appreciate good business situation of units and outlines potential can be exploited in
the next trading period. Thus, organizational analysis is the use of synthetic methods
of analysis to assess the correct results, indicating mistakes and seek measures to
correct deficiencies in the business. This is a basic requirement, it is very practical for
business managers.
Obviously, in any business or studying behavior in general, roughly surely fail.
So after understanding the content, methods of analysis should inform the choice of
content, collect and examine documents by content fixing, building system selection
criteria and methods to adapt the system. Additionally, as well as any other
institutional, organizational analysis should be completed regularly in order to satisfy
more fully than the demand for business management, this is generalized content
distribution stages of the principal.
4. Solve the problem posed in exercise 2
4.1 Determination regression function between the variables and analyze the impact
of each factor to the variables:
We conventions:
Dependent variable:
9
Y: The number of goods listed in the cases (units tons / shifts)
Independent variables:
X1: Number of employees working in shifts
X2: Number of trucks in shifts
X3: Number of excavator in shifts
From the multiple regression equation of the form
^
Y = β 0 + β1 X 1 + β 2 X 2 + ... + β n X n
I would have assumed the corresponding equations are looking for is:
^
Y = β 0 + β1 X 1 + β 2 X 2 + β3 X 3
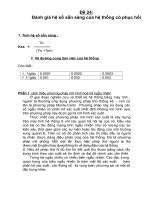
With the data given, tool use Excel, we get the corresponding parameters:
10
SUMMARY OUTPUT
Regression Statistics
Multiple R
0.99677643
R Square
0.99356325
Adjusted R Square
0.99218395
Standard Error
50.7516705
Observations
18
The quantity of goods placed in shifts
Number
Numberofofemployees
employees
Number of trucks
Number of excavator
11
Since the value of R Square = 0.99356325, we can see that 99.4% of the
change to the quantity of goods can be classified in shifts explained by the linear
relationship between the amount of goods in shifts with 3 variables as number of
workers, number of trucks and excavators number.
We see the value of P - value of the three variables X1, X2 and X3 are very
small compared with statistical significance was 5% (or 0.05) can thus conclude linear
relationship between these variables with the dependent variable.
The regression equation of the form:
^
Y = −402,57 + 17,49 X 1 + 109,61X 2 + 244,55 X 3
Note:
In equation value β o
= - 402,57
. Because when we do not have all three factors
are workers, trucks and excavators, no goods will be handling, Y value must be equal
to 0 not be less than 0. Therefore, the regression model is meaningful only on the
simultaneous presence of all three factors and conditions must be satisfied values
17,49 X 1 +109,61X 2 + 244,55 X 3 > 402.57
Through simple calculations we see that there must be at least 3 workers, 1
excavator and trucks to be able to ensure the operation in normal shifts. In three
workers, one to drive the excavator, a drive to transport workers and one remaining
perform other handling operations. Since then, we have added conditions to the
regression equation mean is:
Number of employees working in shifts X1 ≥ 3;
Number of trucks in shifts X2 ≥ 1;
Number of excavator in shifts X3 ≥ 1
According to the regression equation, with 95%, we have:
1. When the number of excavators and trucks in shifts constant, if the number
of workers in shifts increased 1don you are ranked in shifts of goods increased
17.49 tons and vice versa, when the amount of shifts workers a decrease in the
12
other factors constant, the quantity of goods placed in shifts also decreased
17.49 tons.
2. When the number of workers and excavators in shifts constant, the number
of trucks in shifts increased by 1 unit, placed in the shifts of goods increased
109.61 tons and vice versa, when the number of trucks in a decrease in shifts
when other factors constant, the quantity of goods placed in shifts also
decreased 109.61 tons.
3. When the number of trucks and the number of workers employed in shifts
constant, the number of shifts increased excavator 1 unit is placed in the shifts
of goods increased 244.55 tons and vice versa, when the number amount of
excavator in a decrease in shifts when other factors constant, the quantity of
goods placed in shifts also decreased 244.55 tons.
At the same time the number of employees, number of trucks, excavators
number must meet the conditions as stated.
In addition to explaining the significance of each factor, we found in the
regression function equation:
^
Y = −402,57 + 17,49 X 1 + 109,61X 2 + 244,55 X 3
Then whether the coefficient of X1, X2, X3, is positive, it is consistent
with economic theory that we do not offer. For example, the variable X2 is
positive is consistent with the theory because the number of trucks in shifts
increased, the volume of cargo loading and unloading of shifts also increased.
So here is a positive sign, suitable for X as the independent variable increases,
the dependent variable Y also increases.
4.2 Inspection of the real impact of each factor to the amount of goods with a
significance level of 5%.
With a statistical sample of 18, statistical significance of 5%, we go testing
hypotheses about the regression coefficients as follows:
k = 3; n=18; α = 5%
Student Investigation distribution panels have value t18 -3+1;α/2 = 2,12
We tested the significance of each independent variable X on the dependent
variable Y
13
4.2.1 Inspection of the regression coefficient β1 whether actual relationship between
the number of workers per shift (X1) with the volume of goods placed in shifts (Y)
Pair should make the assumption that:
H 0 : β1 = 0
H 1 : β1 ≠ 0
H0:There is no relationship between the number of workers with the volume of
goods placed in shifts;
H1:What is the relationship between the number of workers classified cargo
volume in shifts
Calibration standards used statistics are t:
t=
b1 17,49
=
= 3,469
S b1 5,042
Thus the value t = 3.469> value t18 -3+1; α/2 = 2,12 should at significance α =
5%, assuming H0 is rejected, the hypothesis H1 is accepted.
Also can look at the P value of the variable X1 corresponding to β1 = 0,0038 <
α = 5% thus reject H0, H1 accepted.
Conclusion: There is actually a linear relationship between the number of
workers to the volume of goods placed in shifts.
4.2.2 Inspection of the regression coefficient β2 whether actual relationship between
the number of trucks (X2) with the volume of goods placed in shifts (Y)
Pair should test the hypothesis that:
H 0 : β 2 = 0
H1 : β 2 ≠ 0
H0: There is no relationship between the number of trucks in shifts with blocks
ranked in shifts of goods;
H1: What is the relationship between the number of vehicles transporting cargo
volume ranked in shifts
Calibration standards used are statistics t:
t=
b2 109,61
=
= 10,198
S b2 10,748
Thus the value t = 10,198 > value t18 -3+1; α/2 = 2,12 should at significance α =
5%, hypothesis H0 is rejected, the hypothesis H1 is accepted.
14
Looking at the P-value of the variable X2 corresponding to β 2 = 7,32E-08 < α
= 5%, thus reject H0, H1 accepted.
Conclusion: There is actually a linear relationship between the number of
vehicles transporting cargo volume ranked in shifts.
4.2.3 Inspection of the regression coefficient β3 whether real relationship between the
number of excavators (X3) with the volume of goods placed in shifts (Y)
Pair should make the assumption that:
H 0 : β 3 = 0
H1 : β 3 ≠ 0
H0: There is no relationship between the number of shifts excavator volume
goods classified in shifts;
H1: What is the relationship between the number of excavators with cargo
volume ranked in shifts
Calibration standards used are statistics t:
t=
b3
244,55
=
= 4,865
S b 3 50,262
Thus the value t = 4,865 > value t18 -3+1; α/2 = 2,12, should at significance α = 5%,
the hypothesis H0 is rejected, the hypothesis H1 is accepted.
Also, look at the value of the variable P X 3 corresponding to β 3 = 0.0002< α =
5%, Conclusion: There is actually a linear relationship between the number of
excavators volume of goods placed in shifts
4.3 Coefficient of multiple determination and sense
Estimating confidence intervals of the coefficients β j reliability (1-α) .100% is
determined by the formula:
βj = bj ± t n-k+1, α/2 x Sbj
- Determine the coefficient β1:
β1 = b1 ± t 18-3+1, α/2 x Sb1
β1 = b1 ± t 18-3+1, α/2 x Sb1= 17,49 ± 2,12 x 5,042 = 17,49 ± 10,69
6,80 ≤ β1 ≤ 28,18 (ton/shifts)
So with 95% confidence intervals, each time adding a number of workers who
are placed in cargo volumes will increase in shifts ranging from 6.80 to 28.18 tons /
shift.
15
- Determine the coefficients β2:
β2 = b2 ± t 18-3+1, α/2 x Sb2
β2 = 109,61 ± 2,12 x 10,748 = 109,61 ± 22,79
86,82 ≤ β2 ≤ 132,39 (ton/shifts)
Thus, with 95% confidence intervals, whenever some trucks increased the
volume of a commodity will increase ratings in shifts ranging from 86.82 to 132.39
tons / shift.
- Determine the coefficients β3:
β3 = b3 ± t 18-3+1, α/2 x Sb3
β3 = 244,55 ± 2,12 x 50,262 = 244,55 ± 106,56
137,99 ≤ β3 ≤ 351,11 (ton/shifts)
Thus, with 95% confidence intervals, each time adding a number of excavators,
the volume of the goods listed in the shifts will increase from 137.99 to 351.11 range
tons / shift.
-
Coefficient of multiple determination R2:
R2 = 0,9936
The model explains 99.36% on the change of the number of employees,
number of cars trucks and excavators affect the volume of goods placed in shifts The
level of contact is very tight.
-
- The correlation coefficient R: R = 0,996776 > 0
R> 0 and close to 1 shows the relationship between the number of workers,
number of trucks and excavators volume of goods in shifts placed very close
relationship and it is easy.
4.4 Testing the suitability of the model
Check the model is appropriate or not we go check on the suitability of a
specific regression model was reviewed on 3 independent variables X affects Y
variables at the same time or not. I am going to test the hypothesis pairs:
H 0 : β1 = β 2 = β 3 = 0
H1: at least one coefficient ≠ 0
H0: All 3 are not independent variables affect Y variables simultaneously
H1: At least one independent variable affects the variable Y
16
Looking at the results of the spreadsheet, the user testing has named F.
Comparison of variable portion of the factors in the model with the variability due
to factors outside the model. From the spreadsheet we have F = 720.34 to know
the fit of the regression model. Besides the value of F. It is worth 1,43E-15, Pvalue = α smaller than reject H0 thus, concluded regression function is suitable or
can speak at least one other variable 0
Thus, the regression relationship between the factors mentioned are
suitable.
4.5 Prediction of loading and unloading of goods
No
Number of
Number of
employees
trucks
Number of
Number of cargo
vehicles
handling in shifts (ton /
excavator
shifts)
The
coefficient
17.49
1
15
2
15
3
15
4
15
Comment:
109.61
5
6
7
8
244.55
4
4
3
2
b0 = - 402,57
1,386.03
1,495.64
1,360.70
1,225.76
We found that, with the same number of workers participating in cargo
handling, but when changing the number of trucks and excavators, the cargo is 4
handling is different. If the worker is 15, the number of trucks is 5, the excavator
was predictive value is the value of goods unloaded in shifts is 1386.03 tonnes.
- In the case of 2, 3, 4, with the same 15 workers, total trucks and
excavators are 10, the number of trucks is 6
excavators and 4 will be unloaded cargo volume is optimal.
- When the amount of trucks increased while the number of excavators
reduced the amount of goods will decline as the proportion between excavator and
trucks also need to keep at a certain rate (6/4 = 1.5 trucks / 1 excavator).
This was clearly demonstrated when the proportion of substandard on (5
trucks / 4 = 1.25 excavator trucks / 1 excavator), loading and unloading of goods
is not optimal as the event rate 1.5 transportation / 1 excavator.
17
CONCLUSION
Make a list of all possible options that you have in it, including the choice to do
nothing. Itself does not choose one of these possibilities have been proposed as well as
a decision. The decision is not without interest, as we mentioned above, but
sometimes it is beneficial or even better than some other alternative decisions so this
should be deliberately used in decision-making process. You should also make sure
that you not only pay attention to finding alternative methods are available, but also to
create the method has not yet appeared. For example, if you want to choose to pursue
specialized in the field, do not just think of the industry in the catalog which is
available to create your own course again.
The decisions taken must be approved by the people who do it and those who
are affected by such decisions both rational and emotional. It is an important factor
because sometimes it can cause conflicts. In this case select a solution but less
effective but more accepted. A decision if only technically perfect but not social, it
will not work. Only those decisions are made carefully and meticulously they are
effective and how they are looking forward doi.Nhu we all know, each one usually has
a lot of problems to solve and tasks of the decision is to choose one of them. The
selection can be very simple but very complex may also depend on the importance of
the decision. In addition, the amount and reliability of the other options can also be
adjusted based on importance, time and the elements thereof.
18
LIST OF REFERENCES
1) Management decision making, Dr. Nguyen Manh The, 2014.
[2]. International Business Administration, Associate Professor. Dr. Ngo Thi
Tuyet Mai, 2014.
[3]. Decision Management, Le Minh Tung, 2013.
[4]. Skills Management decisions, Doan Xuan Tiep, 2013
[5]. Now in the process of integration, Le Thi Phuong Thao, 2013.
[6]. Enterprise management tools, Nguyen Thanh Pho, 2013.
[7]. Corporate governance handbook, Nguyen Manh Son, 2013.
19