John wiley sons unencrypted excel data analysis your visual blueprint to analyzing data charts and pivot tables
Bạn đang xem bản rút gọn của tài liệu. Xem và tải ngay bản đầy đủ của tài liệu tại đây (12.16 MB, 308 trang )
537547
Perfect
bindCover
2/25/03
10:15
Page
1 plus Pantone 2945 cv Matte layflat
Trim: 8 X 9 Bleed:
.25”AM
4-color
process
Data analysis tools on
CD-ROM!
• Trial versions of FinOptions XL,
Analyse-It, Sigma XL, 4TOPS
Data Analysis, and XLSTAT Pro
Welcome to the only guidebook series that takes a visual
• UNISTAT demo version
and you’ll discover step-by-step screen shots that demonstrate
• Macro codes
over 100 key Excel data analysis techniques, including:
• A searchable e-version of the
book
• Creating PivotTables and PivotCharts
• Manipulating data within a chart
• Importing and linking data
• Editing external database tables
• Compiling data from various sources
• Using an Excel function in a macro
• Filtering a list
• Building PivotTable formulas
• Creating an amortization table
• Using Analysis ToolPak Add-ins
“Apply It” and “Extra”
sidebars highlight
useful tips
High-resolution screen
shots demonstrate
each task
Succinct explanations
walk you through
step by step
Two-page lessons
break big topics into
bite-sized modules
Excel Data Analysis
approach to professional-level computer topics. Open the book
Excel Data Analysis
Your visual blueprint for analyzing
data, charts, and PivotTables
™
Simon
ISBN 0-7645-3754-7
*85 5 -IGFJ a
$26.99 USA
$39.99 CAN
£18.95 UK
Category:
Spreadsheets
www.wiley.com/compbooks
System requirements: Windows 98 or higher.
See the What’s on the CD-ROM Appendix for details and complete system requirements.
,!7IA7G4-fdhfeh!:p;m;Q;t;T
Data analysis tools on CD-ROM!
• FinOptions XL, Analyse-It, Sigma XL,
and other trial software
• Plus macro codes, an e-version of the
book, and more
01 537547 FM.qxd
3/4/03
11:43 AM
Page i
Excel Data Analysis
Your visual blueprint™ for creating and analyzing
data, charts, and PivotTables
by Jinjer Simon
TM
From
®
&
01 537547 FM.qxd
3/4/03
11:43 AM
Page ii
Excel Data Analysis: Your visual blueprint™ for creating and
analyzing data, charts, and PivotTables
Published by
Wiley Publishing, Inc.
909 Third Avenue
New York, NY 10022
Published simultaneously in Canada
Copyright © 2003 by Wiley Publishing, Inc, Indianapolis, Indiana
Certain designs and text Copyright © 1992-2003 maranGraphics, Inc., used with
maranGraphics' permission.
maranGraphics, Inc.
5755 Coopers Avenue
Mississauga, Ontario, Canada
L4Z 1R9
No part of this publication may be reproduced, stored in a retrieval system or
transmitted in any form or by any means, electronic, mechanical, photocopying,
recording, scanning or otherwise, except as permitted under Sections 107 or 108 of
the 1976 United States Copyright Act, without either the prior written permission
of the Publisher, or authorization through payment of the appropriate per-copy fee
to the Copyright Clearance Center, 222 Rosewood Drive, Danvers, MA 01923,
(978) 750-8400, fax (978) 646-8700. Requests to the Publisher for permission
should be addressed to the Legal Department, Wiley Publishing, Inc., 10475
Crosspoint Blvd, Indianapolis, IN 46256, (317) 572-3447, fax (317) 572-4447,
E-mail:
Library of Congress Control Number: 2003101786
ISBN: 0-7645-3754-7
Manufactured in the United States of America
10 9 8 7 6 5 4 3 2 1
1V/SX/QT/QT/IN
Trademark Acknowledgments
Wiley, the Wiley Publishing logo, Visual, the Visual logo, Simplified, Master
VISUALLY, Teach Yourself VISUALLY, Visual Blueprint, In an Instant,
Read Less - Learn More and related trade dress are trademarks or registered
trademarks of Wiley Publishing, Inc. in the United States and other countries and
may not be used without written permission. The maranGraphics logo is a
trademark or registered trademark of maranGraphics, Inc. All other trademarks are
the property of their respective owners. Wiley Publishing, Inc. and maranGraphics,
Inc. are not associated with any product or vendor mentioned in this book.
FOR PURPOSES OF ILLUSTRATING THE CONCEPTS AND TECHNIQUES
DESCRIBED IN THIS BOOK, THE AUTHOR HAS CREATED VARIOUS
NAMES, COMPANY NAMES, MAILING, E-MAIL AND INTERNET
ADDRESSES, PHONE AND FAX NUMBERS AND SIMILAR INFORMATION,
ALL OF WHICH ARE FICTITIOUS. ANY RESEMBLANCE OF THESE
FICTITIOUS NAMES, ADDRESSES, PHONE AND FAX NUMBERS AND
SIMILAR INFORMATION TO ANY ACTUAL PERSON, COMPANY AND/OR
ORGANIZATION IS UNINTENTIONAL AND PURELY COINCIDENTAL.
Important Numbers
For U.S. corporate orders, please call maranGraphics at 800-469-6616 or fax
905-890-9434.
For general information on our other products and services or to obtain
technical support please contact our Customer Care Department within the
U.S. at 800-762-2974, outside the U.S. at 317-572-3993 or fax 317-572-4002.
Permissions
maranGraphics
Certain text and Illustrations by maranGraphics, Inc., used with
maranGraphics' permission.
Microsoft
Microsoft Excel screen shots reprinted by permission from Microsoft Corporation.
No place in Scotland is filled with as much
history, legend, and lore as Edinburgh Castle,
one of the highlights of a visit to this little
country. It's
believed the
ancient city grew
up on the seat of
a dead volcano,
Castle Rock.
Its walls shelter
St. Margaret's
Chapel, the
oldest structure
in Edinburgh. You
can visit the State Apartments, particularly
Queen Mary's Bedroom, where Mary Queen of
Scots gave birth to James VI of Scotland (later
James I of England). Explore Scotland's intriguing
past in Frommer's Scotland, 7th Edition, available
wherever books are sold or at Frommers.com.
is a trademark of
Wiley Publishing, Inc.
LIMIT OF LIABILITY/DISCLAIMER OF WARRANTY: WHILE THE PUBLISHER AND AUTHOR HAVE
USED THEIR BEST EFFORTS IN PREPARING THIS BOOK, THEY MAKE NO REPRESENTATIONS
OR WARRANTIES WITH RESPECT TO THE ACCURACY OR COMPLETENESS OF THE CONTENTS
OF THIS BOOK AND SPECIFICALLY DISCLAIM ANY IMPLIED WARRANTIES OF
MERCHANTABILITY OR FITNESS FOR A PARTICULAR PURPOSE. NO WARRANTY MAY BE
CREATED OR EXTENDED BY SALES REPRESENTATIVES OR WRITTEN SALES MATERIALS. THE
ADVICE AND STRATEGIES CONTAINED HEREIN MAY NOT BE SUITABLE FOR YOUR
SITUATION. YOU SHOULD CONSULT WITH A PROFESSIONAL WHERE APPROPRIATE.
NEITHER THE PUBLISHER NOR AUTHOR SHALL BE LIABLE FOR ANY LOSS OF PROFIT OR ANY
OTHER COMMERCIAL DAMAGES, INCLUDING BUT NOT LIMITED TO SPECIAL, INCIDENTAL,
CONSEQUENTIAL, OR OTHER DAMAGES.
U.S. Corporate Sales
U.S. Trade Sales
Contact maranGraphics
at (800) 469-6616 or
fax (905) 890-9434.
Contact Wiley
at (800) 762-2974 or
fax (317) 572-4002.
01 537547 FM.qxd
3/4/03
11:43 AM
Page iii
Excel Data Analysis
01 537547 FM.qxd
3/4/03
11:43 AM
Page iv
maranGraphics is a family-run business
located near Toronto, Canada.
At maranGraphics, we believe in producing great
computer books — one book at a time.
maranGraphics has been producing high-technology
products for over 25 years, which enables us to offer the
computer book community a unique communication
process.
Our computer books use an integrated communication
process, which is very different from the approach used
in other computer books. Each spread is, in essence, a
flow chart — the text and screen shots are totally
incorporated into the layout of the spread. Introductory
text and helpful tips complete the learning experience.
maranGraphics' approach encourages the left and right
sides of the brain to work together — resulting in faster
orientation and greater memory retention.
Above all, we are very proud of the handcrafted nature
of our books. Our carefully-chosen writers are experts
in their fields, and spend countless hours researching
and organizing the content for each topic. Our artists
rebuild every screen shot to provide the best clarity
possible, making our screen shots the most precise and
easiest to read in the industry. We strive for perfection,
and believe that the time spent handcrafting each
element results in the best computer books money
can buy.
Thank you for purchasing this book. We hope you
enjoy it!
Sincerely,
Robert Maran
President
maranGraphics
www.maran.com
01 537547 FM.qxd
3/4/03
11:43 AM
Page v
CREDITS
Project Editor
Maureen Spears
Book Design
maranGraphics®
Acquisitions Editor
Jen Dorsey
Production Coordinator
Dale White
Project Development Manager
Lindsay Sandman
Screen Artists
Jill A. Proll
Copy Editor
Jill Mazurczyk
Cover Illustration
David E. Gregory
Technical Editors
Kerwin McKenzie
Allen Wyatt
Barbara A. Prillaman
Proofreader
Vicki Broyles
Editorial Manager
Rev Mengle
Permissions Editor
Laura Moss
Media Development Specialist
Megan Decraene
Manufacturing
Allan Conley
Linda Cook
Paul Gilchrist
Jennifer Guynn
Layout
Beth Brooks
Sean Decker
LeAndra Johnson
Kristin McMullan
Heather Pope
Quality Control
David Faust
Indexer
TECHBOOKS Production Services
Special Help
Barbara A. Prillaman
Vice President and Executive
Group Publisher
Richard Swadley
Vice President and
Executive Publisher
Bob Ipsen
Vice President and Publisher
Barry Pruett
Composition Director
Debbie Stailey
01 537547 FM.qxd
3/4/03
11:43 AM
Page vi
ABOUT THE AUTHOR
Jinjer Simon has been actively involved in the computer industry for the past 18 years. Her involvement
in the industry has included programming, providing software technical support, training end-users,
developing written and online user documentation, creating software tutorials, and developing Web
sites. She is the author of several computer books, including Excel Programming: Your visual blueprint
for creating interactive spreadsheets, Windows CE For Dummies, and Windows CE 2 For Dummies.
01 537547 FM.qxd
3/4/03
11:43 AM
Page vii
AUTHOR'S ACKNOWLEDGMENTS
As an author, it is my responsibility to recognize each of the individuals that contributed to the
completion of this book. Although my responsibility is to produce the content for the book, many
others are responsible for getting this book pulled together.
I would like to recognize the efforts of everyone at Wiley Publishing for all the hard work on this
project. First off, my acquisitions editor, Jen Dorsey got the project off and running. Again I had the
opportunity to work with Maureen Spears, my project editor, on a third book. Helping Maureen out
were Jill Mazurczyk, the copy editor, and Rev Mengle, editorial manager. I would also like to thank the
graphics and production departments for the great job they did pulling everything together.
I would also like to thank my technical editors, Allen Wyatt and Kerwin McKenzie. They provided some
great input on the content of the book. With her statistical knowledge, Barb Prillaman also helped with
Chapter 11.
I want to thank my agent, Neil Salkind at Studio B, for working out the kinks in the project. Finally, I
want to thank my husband Richard, and children, Alex and Ashley, for their patience while I completed
this project.
01 537547 FM.qxd
3/4/03
11:43 AM
Page viii
TABLE OF CONTENTS
HOW TO USE THIS BOOK . . . . . . . . . . . . . . . . . . . . . . . . . . . . . . . . . . . . . . .XII
1) GETTING STARTED WITH EXCEL
Excel Data Analysis Options ..............................................................................................2
Excel Data Types ..................................................................................................................4
Locate a Value in a Worksheet ..........................................................................................6
Select a Range of Cells ........................................................................................................7
Name a Range ......................................................................................................................8
Create Label Ranges ..........................................................................................................10
Modify Named Ranges ......................................................................................................12
Copy and Paste a Range of Cells ......................................................................................14
Create a Custom Number Format ..................................................................................16
Apply AutoFormat to a Worksheet ..................................................................................18
Create a Named Style ......................................................................................................20
Create a Custom Template ..............................................................................................22
Protect Worksheets ............................................................................................................24
2) ORGANIZE WORKSHEET DATA
Create a List ........................................................................................................................26
Add a Series to a List ........................................................................................................28
Sort a List ............................................................................................................................30
Create a Custom Sort ........................................................................................................32
Consolidate Data ..............................................................................................................36
Outline Your Data ..............................................................................................................40
3) EVALUATE WORKSHEET DATA
Apply Conditional Formatting ..........................................................................................42
Summarize Data with Subtotals ......................................................................................46
Filter a List ..........................................................................................................................48
Create a Custom Filter ......................................................................................................50
Create an Advanced Filter ................................................................................................52
Create Scenarios ................................................................................................................54
Validate Data ......................................................................................................................56
viii
01 537547 FM.qxd
3/5/03
2:54 PM
Page ix
Excel Data Analysis:
Your visual blueprint for creating and
analyzing data, charts, and PivotTables
4) CREATING FORMULAS
Sum Cells with the AutoSum Button ..............................................................................58
Add a Function via the Insert Function Dialog Box ......................................................60
Edit Formulas ......................................................................................................................62
Evaluate a Formula ............................................................................................................64
Using Solver to Produce Specific Values ........................................................................66
Create a Conditional Formula ..........................................................................................68
Solve a Formula with a Data Table ..................................................................................70
Trace a Formula Error ........................................................................................................72
Look Up a Value in a Specific Row and Column ............................................................74
Determine the Location of a Value ..................................................................................76
Return a Value at a Specific Location in a Data List ......................................................78
Rank a Value within a Data List ........................................................................................80
Create an Amortization Table for a Loan ........................................................................82
5) WORKING WITH EXTERNAL DATA
Link Data to Other Windows Programs ..........................................................................84
Import a Delimited Text File ............................................................................................86
Divide a Column into Multiple Columns ......................................................................90
Create a Web Query ..........................................................................................................92
Import a Database Table ..................................................................................................94
Using Queries to Screen External Databases ..................................................................96
Find the Average of a Database Range ..........................................................................102
Save For Web ....................................................................................................................104
6) CHARTING DATA
Chart Basics ......................................................................................................................106
Modify a Chart Type ........................................................................................................110
Explode Slices of a Pie Chart ..........................................................................................111
Create a Custom Chart Type ..........................................................................................112
Add a Trendline to a Chart ..............................................................................................114
Add or Change New Data to a Chart ............................................................................116
Create a Chart with Multiple Chart Types ....................................................................118
ix
01 537547 FM.qxd
3/4/03
11:43 AM
Page x
TABLE OF CONTENTS
7) WORKING WITH PIVOTTABLE REPORTS
PivotTable Basics ..............................................................................................................120
A View of the PivotTable Report Fields ........................................................................121
Create a PivotTable Report from an Excel List ..............................................................122
Change the Layout of a PivotTable ................................................................................126
Filter a Field ......................................................................................................................128
Change the Calculation of a Data Field ........................................................................130
Group PivotTable Data Items ........................................................................................132
Add Another Data Area Calculation ..............................................................................134
Add a Calculated Field ....................................................................................................136
Add a Calculated Item ....................................................................................................138
Retrieve a Value from a PivotTable Report ..................................................................140
8) CREATING PIVOTCHARTS
Create a PivotChart from an External Database ..........................................................142
Change the Layout of a PivotChart ................................................................................146
Change the Chart Type of a PivotChart ........................................................................148
Filter a PivotChart Field ..................................................................................................150
Group Items in a PivotChart Field ................................................................................152
Add a Data Table to a PivotChart ..................................................................................154
9) AUTOMATING ACTIONS WITH MACROS
An Introduction to Macros ............................................................................................156
Record a Macro ................................................................................................................164
Run a Macro ....................................................................................................................166
Activate the Visual Basic Editor ......................................................................................168
Create a Macro Using the Visual Basic Editor ..............................................................170
Update a Recorded Macro ..............................................................................................172
Set Macro Security ..........................................................................................................174
Create a Custom Function ..............................................................................................178
Declare a Variable ............................................................................................................180
Execute a Task a Specific Number of Times ..................................................................182
Display a Message Box ....................................................................................................184
Request User Input for a Macro ....................................................................................186
Assign a Macro to a Menu ..............................................................................................188
x
01 537547 FM.qxd
3/4/03
11:43 AM
Page xi
Excel Data Analysis:
Your visual blueprint for creating and
analyzing data, charts, and PivotTables
Run a Macro As a Workbook Opens ............................................................................190
Using an Excel Function in a Macro ..............................................................................192
10) FORM CONTROLS
An Introduction to Forms ..............................................................................................194
The Forms Toolbar ..........................................................................................................195
VBA Dialog Box Basics ....................................................................................................196
Add a Form Control to a Worksheet ............................................................................198
Specify Values for a Form Control ................................................................................200
Customize Form Controls with Macros ........................................................................202
Create a Custom Dialog Box ..........................................................................................204
Call a Custom Dialog Box from a Macro ......................................................................206
Capture Input from a Custom Dialog Box ....................................................................208
Validate Input from a Dialog Box ..................................................................................212
11) USING THE ANALYSIS TOOLPACK ADD-INS
Install Excel Add-ins ........................................................................................................214
Using the Conditional Sum Wizard ..............................................................................216
Analysis of Variance for Lists of Values (ANOVA) ........................................................220
Find the Correlation Between Two Sets of Data ..........................................................222
Determine the Covariance of Two Sets of Data ..........................................................224
Calculate Descriptive Statistics ......................................................................................226
Compare the Variances in Two Groups of Data ..........................................................228
Calculate a Moving Average ..........................................................................................230
Determine Rank and Percentile ....................................................................................232
APPENDIXES
Appendix A: Excel Keyboard Shortcuts ........................................................................234
Appendix B: Excel Function Quick Reference ..............................................................240
Appendix C: VBA and Excel Events Quick Reference ..................................................256
Appendix D: Formula Basics in Excel ............................................................................270
Appendix E: What's on the CD-ROM ............................................................................274
INDEX . . . . . . . . . . . . . . . . . . . . . . . . . . . . . . . . . . . . . . . . . . . . . . . . . . . . . . . . . . . . . . . .280
xi
01 537547 FM.qxd
3/4/03
11:43 AM
Page xii
HOW TO USE THIS BOOK
Excel Data Analysis: Your visual blueprint for creating and
analyzing data, charts, and PivotTables uses simple,
straightforward examples to teach you how to create
powerful and dynamic programs.
To get the most out of this book, you should read each
chapter in order, from beginning to end. Each chapter
introduces new ideas and builds on the knowledge
learned in previous chapters. When you become familiar
with Excel Data Analysis: Your visual blueprint for creating
and analyzing data, charts, and PivotTables, you can use
this book as an informative desktop reference.
Courier Font
Who This Book is For
Italics
Indicates a new term.
If you are interested in creating worksheets that analyze
your data so that you can accurately interpret results,
Excel Data Analysis: Your visual blueprint for creating and
analyzing data, charts, and PivotTables is the book for you.
This book is geared toward someone who is just learning
the skills necessary to become a data analyst. It is also ideal
for the data analyst who wants to learn more advanced
analysis techniques. An intermediate to advanced
experience with the Microsoft Windows operating
system and Microsoft Excel is required.
Indicates the use of Visual Basic for Applications (VBA)
code such as tags or attributes, scripting language code
such as statements, operators, or functions, and Excel
Object Model code such as objects, methods, or
properties.
Bold
Indicates information that you must type.
An Apply It section usually contains a segment of code
that takes the lesson you just learned one step further.
Apply It sections offer inside information and pointers
that you can use to enhance the functionality of your
code.
What You Need to Use This Book
To perform the tasks in this book, you need a computer
with Microsoft Windows 98, ME, NT 4.0, 2000, or XP
installed, as well as Microsoft Excel 2000 or 2002. You do
not require any special development tools, because all the
tools are part of Excel.
An Extra section provides additional information about the
task you just accomplished. Extra sections often contain
interesting tips and useful tricks to make working with
Excel macros easier and more efficient.
The Conventions in This Book
The Organization of This Book
A number of typographic and layout styles have been used
throughout Excel Data Analysis: Your visual blueprint for
creating and analyzing data, charts, and PivotTables to
distinguish different types of information.
Excel Data Analysis: Your visual blueprint for creating
and analyzing data, charts, and PivotTables contains 11
chapters and five appendices.
xii
01 537547 FM.qxd
3/4/03
11:43 AM
Page xiii
Excel Data Analysis:
Your visual blueprint for creating and
analyzing data, charts, and PivotTables
The first chapter, "Getting Started," introduces you to
various data analysis options. You learn how to select a
range of cells, how to use named ranges, label ranges, and
styles, as well as how to create a custom template.
Chapter 2, "Organize Worksheet Data," shows you how to
create Excel lists. In this chapter, you learn how to create,
add, sort, customize and consolidate your data.
Chapter 3, "Evaluate Data," helps you learn how to apply
conditional formatting, and filters. It also includes tasks on
validating data and creating scenarios.
The fourth chapter, "Creating Formulas," builds simple and
complex formulas with the insert function dialog box. It
also shows you how to use the Solver, and create a
conditional formula.
In Chapter 5, you learn all about external data, including
how to properly copy and import it, as well as how to work
with database queries and the DAVERAGE feature.
Chapters 6 through 8 show you how to optimize the
presentation of your data with charts, PivotTables, and
PivotCharts.
In Chapter 9, you learn how to use VBA to create macros.
In Chapter 10, you find out all about forms and form
controls, and in Chapter 11, you learn all the many useful
Add-ins that Excel provides.
The five appendices include Keyboard Shortcuts, an Excel
Function reference, a VBA Quick Reference, and a section
on formulas for those not familiar with Excel.
What's on the CD-ROM
The CD-ROM included in this book contains the sample
files for the book as well as trial versions of FinOptions
XL 2.0, Sigma XL 1.1, UNISTAT 5.5, and 4TOPS Data that
you can use to work with Excel Data Analysis: Your visual
blueprint for creating and analyzing data, charts, and
PivotTables. An e-version of the book is also available on
the disc.
xiii
02 537547 Ch01.qxd
3/4/03
11:45 AM
Page 2
EXCEL DATA ANALYSIS
EXCEL DATA ANALYSIS OPTIONS
E
xcel's functionality falls into three different categories:
entering data, analyzing data, and displaying the
results. Understanding and accurately performing
these functions help the analyst organize data, recognize
trends, and generally gain insight into whatever situation
started the data gathering process. Although the main focus
of this book is on the tools Excel provides for data analysis,
it also explores the available methods for entering data and
displaying the analyzed results.
create charts to visually display data. Excel also lets you
create formulas to automatically calculate results after a
user inputs data into your worksheet, and create custom
macros, which perform repetitive tasks for you. You can use
PivotTables to cross-tabulate data that you have stored in
lists, and a PivotChart to graphically display a PivotTable.
Excel also has advanced tools to perform more
sophisticated data analysis.
When you group related data values in your worksheet, you
can use Excel's built-in tools to perform simple functions
such as summing or averaging related numeric values, or to
DATA ENTRY
The foundation of data analysis is data entry accuracy,
which directly impacts your results, and ultimately, your
interpretation of those results. Although manually typing
data in a worksheet to create a data list is the simplest
method, you may find it the most cumbersome when you
must analyze a large amount of data. Fortunately, you can
gather data from other sources, such as already created
external databases, and import the data directly into your
worksheet. You can also create data forms to simplify the
process of inputting data into specific columns.
Data Lists
Data from External Sources
In its simplest form, a data list is merely a group of
common values, such as items you want to purchase
from the grocery store. When you place this type of
information in Excel, you typically group related data
values. For example, you place grocery item in one
column and the quantity of each item to purchase in
the next column. See Chapter 2 for more information
on working with data lists.
Excel interfaces with many different Microsoft Office
programs, making it possible to acquire data from
external sources. One simple way to do this is to copy
and paste data; you can also import text files directly
into Excel. Typically, organizations store large quantities
of data in database files. You can perform a database
query to access an external database and import the
desired data values. See Chapter 5 for more information
on working with external data sources.
Data Forms
If you need to manually input data into Excel, you can
simplify the process by creating a data form, which
consists of a worksheet or a dialog box with fields into
which a user can input data. With a data form, you can
request the specific data values. You can also use VBA
2
to verify that you have appropriate data before entering
it in the worksheet column. See Chapter 10 for more
information about the creation of data forms and use of
form controls.
02 537547 Ch01.qxd
3/4/03
11:45 AM
Page 3
GETTING STARTED WITH EXCEL
1
DATA ANALYSIS
When you analyze data, you perform a function to
compare different values. Data analysis occurs when you
do something as simple as totaling the numeric values in
a column or sorting a list alphabetically. You can perform
more complex comparisons by creating formulas or by
writing macros with the VBA editor. Excel also provides a
set of analysis tools that perform complex analysis, such
as calculating descriptive statistics.
Formula Creation
PivotTables
You can use formulas to create a custom calculation
that analyzes data values in a cell or series of cells.
You create formulas using any combination of cell
references, mathematical operators, and the built-in
functions available in Excel. See Chapter 4 for more
information about creating formulas, and Appendix D
for formula basics in Excel.
You use PivotTables to perform a cross-tabulation of
data, which is summarizing data into one or more
classifications. PivotTables analyze data from both an
Excel worksheet and an external database all within the
same table. Everything in a PivotTable is dynamic,
meaning that each time you change a value, any
corresponding cells update immediately. See Chapter 7
for more information on working with PivotTables.
You can also create custom functions that you can call
from any workbook using the VBA editor. See Chapter 9
for information on creating custom VBA functions.
Macro Creation
Because they combine a series of calculations that you
want to perform into one step, macros help you save
time by automating any tasks that you perform in Excel.
You can create a macro by recording a series of
keystrokes or by manually coding the macro using the
VBA editor in Excel. See Chapter 9 for more information
on creating custom macros.
Analysis Tools
Excel provides several other analysis tools that you can
use with your data values, including conditional
formatting, which formats data based on specific
criteria, filtering, and even data validation. See Chapter
3 for built-in Excel data analysis tools.
Excel's Add-in data analysis tools provide more complex
analysis of your data values. You can use these tools to
find moving averages, run an ANOVA analysis on your
data, or determine rank and percentile values. See
Chapter 11 for more information about Add-ins.
RESULT PRESENTATION
While Excel's analysis tools can provide detailed numeric
summaries of your data values, you can also use them to create
graphical representations of your data. After you analyze your
data, you have different options for displaying your results.
Chart Creation
PivotCharts
In Excel, you can create charts, which provide a visual
representation of your data values. You can embed a
chart directly into a worksheet or create a separate
chart sheet. Excel provides fourteen different chart
types, each of which has at least two different subtypes
or variations. After you determine the desired chart
type, you can customize it further by changing such
options as text fonts and font colors. See Chapter 6 for
more information on creating and customizing charts.
PivotCharts combine all the same functionality of
standard Excel charts with the dynamic characteristics
of PivotTables. The result is a graphic representation of
a PivotTable that updates whenever you change your
data. See Chapter 8 for more information on working
with PivotCharts.
3
02 537547 Ch01.qxd
3/4/03
11:45 AM
Page 4
EXCEL DATA ANALYSIS
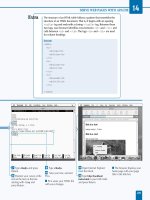
EXCEL DATA TYPES
I
n Excel, a data type refers to the type of value stored in
a cell. When you input data, Excel automatically parses it
and determines its data type. Excel recognizes three
different data types: text, numeric, and formula.
The default data type that Excel assigns to a cell determines
the type of data analysis you can apply to it. For example,
most data analysis tools require numeric values; if you try to
use a text value, the tools return error messages.
TEXT
Text data types contain letters for use as text or labels
within a worksheet. You typically place labels in a
worksheet to identify columns and rows that contain
numeric values. However, not all values that contain a
letter are text. For example, although 1.45E+05 contains
a letter, Excel recognizes it as a number expressed in
scientific notation.
You can use any combination of letters and numbers in
a cell as long as the total number of characters in the
cell does not exceed 32,000 characters. By default, when
Excel determines that a cell contains text, it left-justifies
the entire contents of the cell.
You cannot perform any mathematical operations on a
number as long as the cell also contains text. For this
reason, you may want to consider separating text and
numeric values into two separate cells. If you want Excel
to treat a numeric value, such as Zip Code or Social
Security Number, as text, you place an apostrophe (')
before the numeric value in the cell.
NUMERIC
A numeric value is any number, percentage, currency,
time, or date value. By default, Excel formats all numeric
values by right-justifying them in the cell. Because Excel
has a specific method for storing date and time values,
4
they are considered numeric values. You can customize
the look of numeric values using the Number tab on the
Format Cells dialog box.
Number
Fractions
Excel allows nearly any number you can possibly type
in a cell within the range 2.250748585072E-308 to
1.797693486231E308. You can input numbers in a
wide variety of formats or use the six different built-in
number formats to customize how a number displays in
a cell.
If you type a fraction in a cell without preceding it with
a number, Excel automatically converts it to a date.
To avoid this conversion, place an apostrophe (') or zero
(0) in front of it. No matter what number precedes a
fraction, you must leave a space between the number
and the fraction.
Numeric Characters
Number Precision
You can use any of the following characters to express a
numeric value: 0 1 2 3 4 5 6 7 8 9 + , - ( ) / $ % . E e. The
placement of the characters within the number is
important. For example, the letters E and e allow you to
express large numbers, such as 1,256,000,000,000 in a
format that is easier to display, 1.256E+12, called
scientific notation. If you use an E in any other location,
such as preceding a number (E54), Excel treats the cell
contents as text.
Excel only guarantees precision up to 15 digits and
converts any digits beyond 15 to zeros without rounding
values up to the nearest place. For example, Excel converts
both 35,555,545,365,875,988 and 35,555,545,365,875,922 to
35,555,545,875,900. Obviously this limitation makes storing
large numbers, such as a 16-digit credit card number, in
their entirety difficult. To avoid truncating credit card
numbers, you can format cells as text or create a special
number format. See the section "Create a Custom
Number Format" for more information.
02 537547 Ch01.qxd
3/4/03
11:45 AM
Page 5
GETTING STARTED WITH EXCEL
1
NUMERIC (CONTINUED)
Dates and Time
Excel uses the Western, formally called Gregorian,
calendar as a basis for all dates and times, and stores
them as a combined number. Dates are all sequential,
whole numbers from 1 to 2958465. Excel stores times,
which are all portions of the dates, as decimal values.
For example, if you type the value 12/05/02 4:00 PM in a
cell, Excel stores it as the numeric value 37595.66667,
where 37595 represents the date portion, and .66667
represents the time.
You can apply any mathematical calculations to
compare and manipulate dates and time. For example,
you can add, subtract, or determine the elapsed time
between two dates and times. The cell's formatting
determines how the date or time value displays.
Dates
Although a date displays in a cell on your worksheet,
Excel actually stores its numeric equivalent. Using the
Western calendar, Excel determines the number of days
in each month. For example, January always has 31 days,
and February has 28 days with the exception of leap year.
Excel for Windows bases all dates on what is commonly
referred to as the 1900 date system, which recognizes
1/1/1900 as the first date with a stored value of 1. The
last date that Excel recognizes is December 31, 9999 or
12/31/9999, which it stores as 2958465. If you use Excel
on a Macintosh computer, dates are based on a 1904
date system, which means 1/1/1904 has a value of 1 and
12/31/9999 has a value of 2957003.
Although the two operating systems use different date
systems, you can convert them when moving
worksheets between a Windows and a Macintosh
computer. If you open a Macintosh-created Excel
(version 2.0 or later) worksheet in Windows, the dates
automatically convert to the 1900 date format. Likewise,
opening a Windows-created worksheet on a Macintosh
converts dates to the 1904 system. You can also
manually force the date conversion in Excel for
Windows by selecting the 1904 date system option on
the Calculation tab of Options dialog box.
If you decide to use two-digit dates in Excel, you must
exercise caution when entering them. Excel interprets
two-digit years between 00 and 29 as the years 2000
though 2029. Excel interprets two-digit years between
30 and 99 as 1930 to 1999. To avoid errors, consider
always using a four-digit year.
Time
Excel stores all time values as decimal values between 0
and 0.99999999, with 12:00 midnight being 0, and
11:59:59 PM being 0.99999999. So a time that displays as
12:00 P.M. (noon) has a value of 0.5.
By default, Excel bases all times on a 24-hour clock,
commonly known as military time. This means that if
you enter 10:30 without an A.M. or P.M., Excel assumes
you mean 10:30 A.M. If you want 10:30 P.M., enter P.M.
after the time, or use the corresponding 24-hour clock
value of 22:30.
Formula
You can create formulas within any cell of a worksheet
to evaluate data values in other cells within your
worksheet. For example, the following formula adds the
numeric values in cells A1 through A10 and displays the
total in the cell containing the formula.
=SUM(A1:A10)
You must always precede formulas with an equal sign,
which signals that what follows is a formula that Excel
needs to evaluate. You can use any of the built-in
functions, mathematical operators, constant values, and
cell references to create a formula. Although you can
use any combination of elements in a formula, the total
number of characters in the formula cannot exceed
1,024 characters.
Excel formats a cell based upon the resulting value of
the formula. For example, most formulas return a
numeric value; therefore, by default, Excel right-justifies
the returned value of numeric formula cells like other
numeric cells. See Chapter 4 for more information
about creating formulas in your worksheets. For more
on formula basics, see Appendix D.
5
02 537547 Ch01.qxd
3/4/03
11:45 AM
Page 6
EXCEL DATA ANALYSIS
LOCATE A VALUE IN A WORKSHEET
T
o locate values that match specific criteria without
manually scrolling through a large list of data values,
you can use Excel's Find option. A data analyst can
quickly use this feature to find any number or word, such as
a region's sales forecast for the year or a salesman's name.
You simply enter what you want to search for in the Find
what field in the Find and Replace dialog box.
If you do not know the exact value you want to locate, you
can use one of two wildcard characters as part of the
search. You use either an asterisk (*) or a question mark (?)
to denote a missing character from a value. The question
mark represents one value. For example, if you enter a
search value of 1?4, Excel finds the values 104, 114, and any
other three digit number that matches the pattern. An
asterisk represents any number of missing characters. For
example, 1*4 finds not only the value 114, but also 1234 and
199854.
When you search, Excel finds the first match for the
specified pattern after the active cell. If the located cell is
not correct, you can repeat the search to find the next cell.
To narrow your search, you can match not only
the value in the Find what field, but also a
specific formatting. For example, you can find
a value that matches 145.34 and that displays in
Arial Bold.
To specify formatting, click the Options button
in the Find and Replace dialog box. Click the
Format button to display the Find Format dialog
box. The Find Format dialog box displays the
formatting tabs that you find in the Format Cells
dialog box. Specify the formatting for which you
want to search and click OK. The specified
formatting displays in the Preview field in the
Find and Replace dialog box. When you click
Find Next, Excel finds the text that matches the
text in the Find what field and has the specified
formatting. See the section "Create a Custom
Number Format" for more information about
formatting options.
LOCATE A VALUE IN A WORKSHEET
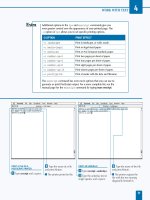
⁄ Click Edit ➪ Find.
■ Excel displays the Find and
Replace dialog box.
6
¤ Type the value you want to ■ Excel locates the cell
locate in the Find what field.
containing a matching value.
■ Use * to replace a series of
characters or ? to replace a
single character.
■ Repeat step 3 to continue
‹ Click Find Next.
value, click Close to close the
dialog box.
searching.
■ When you find the correct
02 537547 Ch01.qxd
3/4/03
11:45 AM
Page 7
GETTING STARTED WITH EXCEL
1
SELECT A RANGE OF CELLS
Y
ou can make modifications to several cells in a
worksheet simultaneously, a process referred to as
selecting a range of cells, by choosing all the related
cells together before implementing the changes. Typically,
you select a range of cells to apply different formatting
options, to copy cells, or to change the Excel value type.
The range of cells does not need to be contiguous; you can
select cells from different locations in a worksheet. See the
section "Copy and Paste a Range of Cells" for information
on copying a range of cells. See the section "Create a
Custom Number Format" for more information on
formatting cells.
You can select anywhere from a single cell to the entire
worksheet. Excel highlights the group of cells to remind you
of your selection. If you select multiple ranges of cells
simultaneously, Excel highlights each selected range.
To select an entire row or column, you simply
click the corresponding identifier. For example,
to select all cells in column C, you click the C
identifier for the column. To select multiple
columns, you click the first column and then
continue holding down the mouse button as
you drag to the other columns you want to
select. To select entire rows, you click the row
identifiers on the left side of each row.
You can select a smaller group of cells by clicking
a cell in one corner of the desired selection
range, holding down the mouse button, and
dragging until you select the desired range.
To select a noncontiguous range of cells, select
the first block of cells, and then press the Ctrl
key and select the next block. If you do not hold
down the Ctrl key, Excel unselects the first range
of cells when you select a new range of cells.
SELECT A RANGE OF CELLS
⁄ Click the corner of the
first block of cells.
¤ Drag the mouse to
highlight the desired cells.
‹ Press Ctrl.
› Select the next block of
cells.
■ Excel highlights each of
the selected cell blocks.
■ Any changes you make
affect only the highlighted
cells.
■ Repeat steps 3 and 4 to
select all cell blocks.
7
02 537547 Ch01.qxd
3/4/03
11:45 AM
Page 8
EXCEL DATA ANALYSIS
NAME A RANGE
I
You create the range name in the Define Name dialog box.
Your range names can consist of up to 255 characters, but
you only see about the first 16 characters of the name in the
Name box. Therefore, you may want to use names that you
can easily distinguish after viewing the first few characters.
=SUM(Sales_Amounts)
Excel only allows you to use a range name once in a
workbook; therefore, if you have a duplicate name in
another worksheet, you must use a different name. If you
create a range name that already exists, Excel replaces the
previously specified range with the new range. To avoid
potential errors, verify that you have a unique range name
before using it.
f you need to reference a specific range of cells in
multiple locations, it can become tedious to remember
the cell locations. You can create range names to easily
locate specific information, to avoid having to remember
the cell locations, and for use in any formulas that you
create. For example, if you create a range name in Sheet1
named Sales_Amounts, in Sheet2 you can create a formula
that sums the range by typing the following:
Using the named range eliminates the need to specify a
worksheet or cell reference. Although the example shows
how to access a range from any worksheet in the same
workbook, you can also reference a named range of cells
from another workbook. For example, =SUM(Sales2002!
Sales_Amount) references a named range in the
workbook Sales2002.xls. See Chapter 4 for more
information on creating formulas.
If you duplicate a worksheet containing a named range, Excel
only recognizes the range name in the original worksheet for
other worksheets in the workbook. You can only access the
copied range name on the copied worksheet.
NAME A RANGE
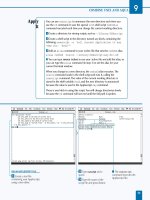
⁄ Select the range of cells
that you want to name.
8
Note: See the section "Select a
Range of Cells" for more information
on selecting a range.
¤ Click Insert ➪ Name ➪
Define.
02 537547 Ch01.qxd
3/4/03
11:45 AM
Page 9
GETTING STARTED WITH EXCEL
If you no longer want to use a named range,
you can delete it by clicking Insert ➪ Name ➪
Define. In the Define Names dialog box, select
the range name and click Delete.
When you delete a named range, you only
remove the name. The cells referenced by the
name remain unchanged. If you have a formula
that references the deleted range name, the
error #NAME ? displays in the cell containing the
reference. You must update each formula that
references the deleted range name.
1
If you have a worksheet that includes formulas that
reference cells from a named range, you can convert
the cell references to the range name. To do so, select
the cells containing the formula and click Insert ➪
Name ➪ Apply to display the Apply Names dialog
box. The dialog box displays the names that exist
within the workbook. Click OK to update the formula
in the selected cell to include the named ranges.
Keep in mind that Excel only updates the range
names within the existing worksheet and not those
in other worksheets.
C6
■ The Define Name dialog
box displays.
‹ Type the name of the
range.
■ You can click the Collapse
Content button to make a
previously assigned range
appear in the Refers to box.
■ Excel creates the new
range name.
■ You can click next to the
Name field to see the current
range names.
› Click OK.
9
02 537547 Ch01.qxd
3/4/03
11:45 AM
Page 10
EXCEL DATA ANALYSIS
CREATE LABEL RANGES
Y
ou can automatically have Excel use the column or
row labels as the range names for your worksheet.
This eliminates time required to manually create a
range for each column or row of data in your worksheet.
Excel creates names based upon the labels in the top row,
bottom row, left column, or right column within the range
of cells. For example, if your worksheet contains various
office expenses for an entire year, you can create named
ranges of monthly expenses. If the month names are in the
left column, Excel creates the range name from the left
column labels.
In the Create Names dialog box you must first select the
range of cells containing both the labels and the cells for
the named ranges. For example, if your top row contains
the column names for the worksheet, and the remaining
rows contain the corresponding data values, you must
select both the labels and the data values. When you
activate this option, Excel creates a separate range name for
each label within the range of selected cells.
If you have labels in the top row and the left column, and
you select the top row option, Excel only creates range
names for the top row. If you want to create range names
for both the top row and left column, you must select both
options in the Create Names dialog box.
Although Excel uses your worksheet labels to create the
range names, only the selected cells become a part of the
corresponding range. For example, if column C contains
telephone expenses, but you only selected a range of cells
that contained rows 1 through 12, Excel does not create a
range for any values beyond row 12.
CREATE LABEL RANGES
⁄ Select the range of cells
containing labels.
10
Note: See the section "Select a
Range of Cells" for more information
on selecting a range.
¤ Click Insert ➪ Name ➪
Create.
02 537547 Ch01.qxd
3/4/03
11:45 AM
Page 11
GETTING STARTED WITH EXCEL
You can quickly eliminate any unwanted named
ranges using the Define Name dialog box, which
you display by clicking Insert ➪ Name ➪ Define.
The Define Name dialog box lists all of the
names defined within the current workbook. To
delete a named range, click it and then click
Delete. Excel only deletes the range name. It
does not delete any data.
You can change a range from the Define Name
dialog box by selecting the desired range,
specifying the range of cells in the Refers To
field, and clicking Add. To create a new range of
cells, type the new range name in the Names in
workbook field, specify the desired range in the
Refers To field, and click Add.
1
You can use dates as the names for your ranges.
However, if your labels are numeric dates, Excel
must reformat the label to match the name rules.
For example, 1/31/2002 begins with a number and
contains a slash character, which you cannot use in
range names. If this date exists in a label column
that you use to create names, Excel changes the
range name to _1_31_2002. See "Name a Range" for
more on naming ranges. See Excel Help for specific
range naming rules.
A1
■ The Create Names dialog
box displays.
‹ Click the option
corresponding to the
location of the labels.
■ Excel creates the range
names.
■ Click next to the Name
field to see the current range
names.
› Click OK.
11