Chiến lược phát triển kinh doanh 2010 2015 của công ty cổ phần hóa dược mekophar tiếng anh
Bạn đang xem bản rút gọn của tài liệu. Xem và tải ngay bản đầy đủ của tài liệu tại đây (1.59 MB, 74 trang )
CHIẾN LƯỢC PHÁT TRIỂN KINH DOANH 2010-2015 CỦA CÔNG TY
CỔ PHẦN HÓA- DƯỢC PHẨM MEKOPHAR
DEVELOPING
BUSINESS STRATEGY FOR
MEKOPHAR CHEMICAL
PHARMACEUTICAL JSC
.
DEVELOPING
BUSINESS STRATEGY FOR
MEKOPHAR CHEMICAL
PHARMACEUTICAL JSC IN THE
PERIOD OF 2010-2015
.
ACKNOWLEDGEMENT
Our group would like to express our thankfulness to the Directors and the Faculty from
Center for Educational Technology and Career Development (ETC) – Vietnam
National University; ETC’s Southern Division and Griggs University for having
created us the best study conditions and have encouraged us in all the time of research
and writing this capstone.
We have further more to thank the Directors of Mekophar Chemical Pharmaceutical
JSC as well as its related Departments for their provided relevant information, data and
their supports for our Capstone.
We understand that due to our lack of experience and limited information, our
Capstone would have some shortcomings. However, we would really appreciate all
comments and suggestions for improvement in order to make the Capstone become,
somehow, more applicable and more meaningful to the current context of Mekophar
Chemical Pharmaceutical JSC.
Even though this Capstone is our first ever carried-out research, we know that what we
learn from doing the research will help us a lot not only in our professions but also in
our future academic pursuits, and we believe that all the theoretical and practical
business strategies withdrawn from this Capstone will bring us with success in our
career.
WORDS OF REASSURE
We affirm that the work of this Capstone is our own research and all the information
and data used are true.
TABLE OF CONTENTS
ACKNOWLEDGEMENT......................................................................................................i
WORDS OF REASSURE.....................................................................................................ii
LISTS OF TABLES..........................................................................................................vi
LIST OF FIGURES.........................................................................................................vii
FOREWORDS......................................................................................................................1
CHAPTER I: THEORITICAL FOUNDATION ON BUSINESS STRATEGY.................4
1.1. Definition of Dertermining Strategy in Business.........................................................4
1.1.1. Defintion of Strategic Management...........................................................................4
1.1.2. The roles of Strategic Management in Business.......................................................4
1.2. Competitive Strategies according to Michael Porter:...................................................4
1.2.1. Low-cost leadership strategy.......................................................................................4
1.2.2. Differentiation Strategy..............................................................................................4
1.2.3 Segmentation Strategy.................................................................................................4
1.3. Planning Company’s Strategy Process.........................................................................5
1.3.1. Determining the business task....................................................................................5
1.3.2. Analyzing External Factors........................................................................................5
1.3.3. Analyzing Internal Environment................................................................................5
1.3.4. Analyzing and Selecting Strategy...............................................................................5
1.4. Tools to develop business strategies:.............................................................................6
CHAPTER 2 BUSINESS ACTIVITIES OF MEKOPHAR..............................................10
2.1.1 General Introduction:................................................................................................10
2.1.2 Main business line:....................................................................................................10
2.1.3 History of establishment and development...............................................................10
2.1.4 Mission of MEKOPHAR............................................................................................11
2.1.5 Organizational Structure of MEKOPHAR...............................................................11
2.1.5.1 Organizational Structure:.......................................................................................11
2.1.5.2. The Company’s Organizational Chart: Chart 2.1................................................12
2.6.1. List of partners..........................................................................................................13
2.1.7 Production and Sales results of MEKOPHAR over recent 3 years.........................13
2.2 Internal Environment Analysis of MEKOPHAR........................................................17
2.2.1 Management Model...................................................................................................17
2.2.1.2 Human Resources...................................................................................................17
2.2.2 Marketing...................................................................................................................19
2.2.3 Finance and Accounting...........................................................................................21
2.2.4 Production:.................................................................................................................22
Image 2.3: Some images of the Company’s manufacturing equipments.........................24
2.2.5 Research and Development.......................................................................................24
2.3 External factors analysis:.............................................................................................25
2.3.1 Macroeconomic environment analysis......................................................................25
2.3.1.1 Political, Legal, Cultural and Social Factors........................................................25
2.3.1.2 Natural Factors.......................................................................................................27
2.3.1.2 Demographic Factors.............................................................................................27
2.3.1.4 Technological Factors:...........................................................................................27
2.3.2 Industrial environment analysis and development directions until 2015:...............28
2.3.2.1 Customers................................................................................................................30
2.3.2.1.1 Indirect customers................................................................................................30
2.3.2.1.1 Direct customers:.................................................................................................31
2.3.2.2 Suppliers:.................................................................................................................32
2.3.2.3 Substitute products:................................................................................................32
2.3.3 Competitor analysis:..................................................................................................32
2.3.3.1 Factors determining the competitiveness in the industry:.....................................32
2.3.3.2 Content of competitor analysis...............................................................................33
2.3.3.3 Potential competitors:.............................................................................................35
2.4
Evalueted Matrix:....................................................................................................35
2.4.1. The External Factors Evaluation Matrix (EFE): (Table 2.7)..............................366
2.4.2. Competition Matrix:..................................................................................................37
2.4.3. The Internal Factors Evaluation Matrix (IFE):.....................................................39
CHAPTER 3: BUSINESS STRATEGY FOR DEVELOPMENT IN THE PERIOD OF 2010
– 2015..................................................................................................................................40
3.1. Goals and Objectives of Mekophar in the period of 2010 - 2015...............................40
3.1.1. Long-term Goals to 2015: (Table 3.1)......................................................................40
3.2.2. Foundation for goal and objective definition:.........................................................40
3.2.3. Specific objectives for each year in the Period of 20011-2015 (Table 3.2).............41
3.3. Strategy Selection Matrices:........................................................................................42
3.3.1. The SWOT Matrix:......................................................................................................................42
3.3.2. Strategic Position and Action Evaluation Matrix (SPACE): (Table 3.4)................44
3.3.3. The Internal – External Factors Matrix (IE):.........................................................46
3.3.4. Preliminary selection of the strategic plans:............................................................47
3.3.5. The Quantitative Strategic Planning Matrix (QSPM):...........................................47
3.4. Strategy Implementation: (Table 3.8)..........................................................................50
3.4.1. Penetration and Development Strategy....................................................................50
3.4.1.1. Domestic Penetration and Development Strategy of Mekophar:.........................50
3.4.2. Product Development Strategy:................................................................................52
3.4.3. Vertical Integration Strategy:...................................................................................53
3.4.4. Co-operating with international partners:...............................................................54
3.4.5. Cost Strategy:............................................................................................................55
3.4.6. Developing the Human resource..............................................................................55
CONCLUSION...................................................................................................................57
BIBLIOGRAPHIES...........................................................................................................58
WEBSITES.........................................................................................................................59
APPENDICES......................................................................................................................60
LISTS OF TABLES
Table 2.1: Output and, revenue of each group of products and services through
years..........................................................................................................................10
Table 2.2: Revenue of each group of products and services through years..............10
Table 2.3: Revenue of each group of products and services through years..............19
Table 2.4: Statement of production and business results through years....................20
Table 2.5: Product distribution market rate...............................................................26
Table 2.6: Production capacity of some products......................................................28
Table 2.7: Matrix of external factors for pharmaceutical industry............................46
Table 2.8: Matrix for competitive images for pharmaceutical industry of mekophar
chemical pharmaceutical joint stock company..........................................................49
Table 2.9: Matrix to assess internal factors (IFE) ....................................................50
Table 3.1: Mission, strategic goals............................................................................53
Table 3.2: Goals of each year....................................................................................54
Table 3.3: SWOT Matrix of pharmaceutical product line of Mekophar...................56
Table 3.4: SWOT matrix of the pharmaceutical industry of Mekophar....................58
Table 3.5 : Internal – External Factor Evaluation Matrix (IE) .................................62
Table 3.6: Proposed strategies in each matrix...........................................................63
Table 3.7: QSPM matrix of the pharmaceutical industry- Group of concentrated
growth strategies........................................................................................................65
Table 3.8: Order of strategic implementation organization.... ..................................67
LIST OF FIGURES
Figure 2.1: The organizational chart of the company..............................................21
Figure 2.2: Products of Mekophar.......................................................................... 33
Figure 2.3: Some pictures of the company’s machines and equipments.................37
Capstone Project Report
FOREWORDS
1. The necessity of the research
Throughout the 20-year long of the country’s renovation, Vietnam's economy has gained
many important achievements, especially in the early years of the 21st century. The
economic growth of Vietnam has maintained relatively high with a GDP of 6.7% to
7.2%, which made Vietnam become one of the countries with fastest economic growth,
just behind China. Vietnam's economy increases integrated with the world’s economy, its
trade volume has exceeded the total domestic product, and foreign direct investment to
GDP is also increasing.
Together with great achievements in economic development, Vietnam’s health care sector
has won many achievements under the Government’s supports and investment. Some
dangerous diseases and epidemics are initially controlled and eliminated, the rate of
infections and deaths declined substantially. Vietnam was the first country in the world
successfully controlled the SARS epidemic. Grassroots health networks are strengthened,
especially the formation of village health care systems, they are closer to the people and
creating favorable conditions to access health care services. Pharmaceutical sector has
developed a very steady foundation of organizing, managing, manufacturing and
supplying. Basically, pharmaceutical industry has met the people’s demand for drugs in
term of quantity and quality.
Besides the basic achievements it has achieved in recent years, pharmaceutical industry
is also facing difficulties and challenges. The development of pharmaceutical industry
and antibiotics is almost insignificant. One of the hardest difficulties is that the raw
materials are mainly imported. Apart from that, the supply networks, the distribution of
drugs develop slowly, dispersedly and monopoly. Businesses and distributors are
functioning in a very small scale with weak capacity and lacking of experience in the
market mechanism.
The
current
Pharmaceutical market
is
chaotic
with
unfair competition,
that
required government’s intervention - this has changed the business environment. In order
Page | 1
Group 4- C0110
Capstone Project Report
to survive and develop in that severe context, Mekophar Chemical Pharmaceutical JSC
needs a better business strategy.
For that reason, our group has chosen “Develop business strategies for Mekophar
Chemical Pharmaceutical JSC in the period of 2010-2015” as our capstone research.
We really hope that the jury member, our classmates as well as the professors of business
strategy will support us with your comments and suggestions to make the Capstone
become more persuasive and applicable.
2. Objectives of the research
The Capstone focused on researching the following issues:
- Basic theories about strategy and strategy management
-
Analyzing useful models used for the implementation and selection of the
strategies.
-
The real situation of strategy implementation at Mekophar Chemical
Pharmaceutical JSC
-
Analyzing internal and external factors that affected the company’s strategy
implementation phase
-
Suitable solutions for setting up the development strategy of Mekophar Chemical
Pharmaceutical JSC
3. Beneficiary, scope and mode of researching
- Beneficiary and scope: The capstone focuses on researching strategic activities for
Mekophar’s products and proposes solutions and suggestion in the future.
- Mode of researching: The capstone uses two main form of information: primary and
secondary information. The secondary information was collected from different
sources, but mainly from Mekophar’s reports on business and marketing activities as
well as open resource on the internet.
4. Structure of the Capstone
Chapte 1:
Theoretical foundation on business strategy
Chapter 2:
Business and Manufacturing Activities of Mekophar Chemical
Pharmaceutical JSC.
Page | 2
Group 4- C0110
Capstone Project Report
Chapter 3:
Business Strategy for Development of Mekophar Chemical
Pharmaceutical in the period of 2010-2015
Conclusion:
Briefly evaluating analyzing results and naming all major contents
of the research
Page | 3
Group 4- C0110
Capstone Project Report
CHAPTER I
THEORITICAL FOUNDATION ON BUSINESS STRATEGY
1.1. Definition of Dertermining Strategy in Business
1.1.1. Defintion of Strategic Management
“Strategic Management can be defined
implementation and
evaluation
organization
achieve its
to
management focuses
of decisions
art and
of
and
science establishment,
related functionality
assigned goals. In
on integrating
accounting, manufacturing, research
as an
this
management,
that allow an
definition, strategic
marketing, finance
development, and information
and
systems to
achieve success for the organization”. (Fred R. David).
1.1.2. The roles of Strategic Management in Business
It helps the business to:
Achieve the organization’s proposed goals
Take care of concerned parties in a larger aspect
Integrate the short-term development in a long-term context
Focus on outcome and productivity
1.2. Competitive Strategies according to Michael Porter:
1.2.1. Low-cost leadership strategy
This strategy creates competitiveness by:
Low appreciating competitors in the industry, attracting target customers, who
care about pricing in order to increase profit.
Control without fully reducing the price, satisfy with the current market share and
using lower-cost tools in order to gain higher actual margin over each item sold.
1.2.2. Differentiation Strategy
This focuses on manufacturing specific products or providing specific services in the
industry, aiming at customers who are not sensitive with price difference.
1.2.3 Segmentation Strategy
Page | 4
Group 4- C0110
Capstone Project Report
This focuses on manufacturing products and services that meet the need of a small group
of customers. This narrow segment can be determined by geographical region, product
and customer types.
1.3. Planning Company’s Strategy Process
There are four main steps in this process
1.3.1. Determining the business task
Reports on business task are declarations the “existing reason” of an organization
(Drucker). Therefore, the company needs to determine its business activities, goals to
achieve, and finally planning a suitable business strategy of it.
1.3.2. Analyzing External Factors
Environment of an organization are the factors, forces and institutions, etc, outside the
businesses that the administrators could not control but has tremendous impact on the
operation and performance of
the
organization. External environment of an
organization can be divided into two levels:
- Macro environment: has impact on ever kinds of business for instance economic
environment, legal environment, social and cultural environment.
- Micro environment (or industry environment) is determined through specific
sector or business. It can consist of (1) Competitors, (2) Customers, (3) Providers,
(4) Potential Competitors, (5) Substitute products.
Analyzing external factors will help the Company find out what its Opportunity (O) is
and which is the Threats it has to face.
1.3.3. Analyzing Internal Environment
The situation of the enterprise is often assessed through functions of Departments such as
Finance, Human Resources, Executive Management, Organizational Structure,
Marketing and Information Technology. The analysis of external factor will help the
business identify its Strengths (S) and Weaknesses (W) in order to have an appropriate
business strategy.
1.3.4. Analyzing and Selecting Strategy
Based on strategic objectives, vision and core values of the company as well as analyzed
internal and external information, the company will evaluate and selecting the most
feasible business strategies.
Page | 5
Group 4- C0110
Capstone Project Report
1.4. Tools to develop business strategies:
According to Fred R. David, there are three phases in developing business strategies, and
therefore, different tools are used.
* Phase 1: Collecting and Systemizing Information
This phase summarizes all collected information and then systematizes them in
order to develop business strategies. This phase uses three tools: The EFE Matrix,
The Competitive Profile Matrix (CPM) and the IFE Matrix.
- The EFE Matrix is built following these five steps
List factors: Gather a list of external factors. Divide factors in to two groups:
Opportunities and Threats.
Assign a weight to each factor. The value of each weigh should be between 0
and 1. 0.0 means the factor is not important. 1.0 is very important. The total
value of all weighs should equal 1.0.
Assign a rating to each factor. Rating should be between 1 and 4. Rating
indicates how effective the firm’s current strategies respond to the factor. 1=
the respond is poor, 2= the respond is below average, 3= above average, 4=
superior.
Multiply each factor weight with its rating. This will calculate the weighted
score factor.
Add all weights scores for each factor. This will calculate the total weighted
score for the company.
- The CPM Matrix
This matrix shows a clear picture to the Company about their strong points and
weak points relative to their competitors in the same industry. This matrix is the
extension of EFE Matrix with the weight for each factor, meaning of each weight
and total weights score.
- The IEF Matrix is set up through 5 steps:
List from 10 to 20 factors including strengths and weakness that affect the
company
Classify the weight of each factor base on a scale 0.0 – 0.1.
Page | 6
Group 4- C0110
Capstone Project Report
Identify the weigh for each factor base on a scale from 1 to 4
Multiply the weight of each factor with its rating to have the weighted score
Sum the weighted score for each factor to have to total weighted score
If the total weighted score of the Matrix is below 2.5: the company is weak at
internal factors and if it is above 2.5: the company is strong at internal factors.
* Phase 2: Combination
This phase selects, organize and combines external factors and internal factors to
come up with a feasible strategy. This phase uses tools such as: The SWOT Matrix,
The SPACE Matrix.
- The SWOT Matrix: is a tool combines Strengths (S), Weaknesses (W),
Opportunities (O) and Threats (T) to come up with four kinds of strategies as
below:
S
W
Listing all the Strengths
Listing all the Weaknesses
S-O Combination
W-O Combination
S-T Combination
W-T Combination
O
Listing all the
Opportunities
T
Listing all the Threats
In order to set up the SWOT Matrix, the Administrator has to go through eight (8)
following steps:
Step 1: Listing all main Opportunities from external environment (O1, O2…)
Step 2: Listing all main Threats from external environment (T1, T2…)
Step 3: Listing all Company’s Strengths (S1, S2…)
Step 4: Listing all Company’s Weaknesses (W1, W2…)
Step 5: Combination of Strengths and Opportunities (SO)
Step 6: Combination of Weaknesses and Opportunities (WO)
Step 7: Combination of Strengths and Threats (ST)
Step 8: Combination of Weaknesses and Threats (WT)
- Strategic Position and Action Evaluation Matrix (SPACE)
Page | 7
Group 4- C0110
Capstone Project Report
SPACE Matrix shows what strategy a Company should choose: Aggressive,
Conservative, Defensive, or Competitive. The axes mean as follows:
- FS
: The Company’s Financial Strengths
- CA
: The Company Competitive Advantages
- ES
: Environment Stability
- IS
: Industry Strengths
In order to set up a SPACE Matrix, these steps need to be followed:
-
Step 1: Choose a set of variables to be used gauge the competitive advantage
(CA), industry strength (IS), environmental stability (ES), and financial strength
(FS)
-
Step 2: Rate individual factors using rating system specific to each dimension.
Rate competitive advantage (CA) and environmental stability (ES) using a rating
scale from -6 (worst) to -1 (best). Rate industry strength (IS) and financial strength
(FS) using rating scale from +1 (worst) to +6 (best).
-
Step 3: Find the average score for competitive advantage (CA), industry strength
(IS), environmental stability (ES), and financial strength (FS).
-
Step 4: Plot values from step 3 for each dimension on the SPACE Matrix on the
appropriate axis.
-
Step 5: Add the average score for the advantage (CA), industry strength (IS)
dimensions. This will be your final point on axis X on the SPACE Matrix.
-
Step 6: Add the average score for the SPACE Matrix environmental stability (ES),
and financial strength (FS) dimensions to find your final point on the axis Y.
-
Step 7: Find intersection of your X and Y points. Draw a line from the center of
the SPACE Matrix to your point. This line reveals the type of strategy the
company should pursue.
- The Quantitative Strategic Planning Matrix (QSPM):
This matrix used to evaluate the ranking of feasible strategic plans; therefore we have
foundation to choose the best strategy. This matrix uses all the inputs from all developed
matrices (EFE & IFE Matrix, competitive image matrix, SWOT Matrix, SPACE Matrix).
Page | 8
Group 4- C0110
Capstone Project Report
Weighted score
of the important
factors
rank
from 1 to 4:
4: very important,
3: important, 2: relatively important, 1: unimportant.
The scores of attraction in each strategy are given on a scale rank from 1 to 4;
1: completely unattractive, 2: less attractive, 3: fairly attractive, 4: very attractive.
Success factors’ affecting the choice of strategy has no point.
Page | 9
Group 4- C0110
Capstone Project Report
CHAPTER2
BUSINESS ACTIVITIES OF MEKOPHAR
2.1 Introduction about MEKOPHAR Chemical Pharmaceutical JSC
2.1.1 General Introduction:
Name of the company: MEKOPHAR Chemical Pharmaceutical JSC
Abbreviation: MEKOPHAR
Logo:
Charter Capital: 92,100,000,000.00 VND
Headquarter:297/5 Ly-Thuong-Kiet street, Ward 15, District 11, Ho-Chi-Minh City
2.1.2 Main business line:
- Producing and exporting pharmaceutical products and materials, raw materials for
medicals, medical equipment
- Producing pharmaceutical packages (plastic bottles, boxes, cartons)
- Producing and trading technological food (except producing and processing raw food)
- Leasing buildings and offices
- Leasing apartments
2.1.3 History of establishment and development
Mekophar was founded in 1975 with the initial name “National Pharmaceutical
Enterprise 24”, a subsidiary of Vietnam Pharmaceutical Corporation
On 19th December 2001, Mekophar was equities officially changing its name to
Mekophar Chemical Pharmaceutical Joint Stock Company (JSC)
In 2003, our company funded to build AN SINH hospital and the hospital came into
operation on 7th May 2006.
In June 2006, our company first issued Initial Public Offerings (IPO).
Page | 10
Group 4- C0110
Capstone Project Report
In 2009, we invested in Mekong Pharmaceutical Company.
The initial chartered capital of Mekong Pharmaceutical Company at the time of equity is
36 billion VND of which Government owns 45%. On 15 th September 2008, the chartered
capital reached 92.1 billion VND, of which Government owns 29%.
2.1.4 Mission of MEKOPHAR
As being a pharmaceutical join stock company, we provide necessary medicines, specific
medicines, antibiotic materials, and other licensed medical services.
MEKOPHAR is one of the first Vietnamese pharmaceutical companies to satisfy GMPWHO standard; the only Vietnamese pharmaceutical producing antibiotic Beta-lactam
materials for other domestic and foreign pharmaceutical companies. Our company has
operated workshops which meet GMP-WHO standards such as:
-
Workshop producing antibiotic Beta-Lactam with 2 units: raw material unit and
product unit
-
Chemical pharmaceutical workshops
Workshops with units such as Infusions, powder antibiotic for injections,
Betalactam antibiotics, Non-betalactam antibiotics, liquid mixture and ointment
-
Stem cell bank unit
-
GLP quality control department
-
GSP-standard stock system
At the moment, our company is waiting for more than 300 products to be licensed.
MEKOPHAR’s products have been produced with updated processes and equipment,
ensuring the standard quality we registered with Ministry of Health.
At the same time, we are under the progress of building new GMP-WHO standard
factory as the Government plans to move industrial factories far from residential areas.
The new plan will be located in Binh Duong industrial zone with the area of more than
41000 m2
2.1.5 Organizational Structure of MEKOPHAR
2.1.5.1 Organizational Structure:
Page | 11
Group 4- C0110
Capstone Project Report
Headquarter: MEKOPHAR Chemical Pharmaceutical Joint Stock Company (JSC)
Address: 297/5 Ly-Thuong-Kiet street, Ward 15, District 11, Ho-Chi-Minh City
With the area of 18.600 m2, the headquarter is the office of general director, vice general
directors and professional divisions such as: Administrative Division, Planning and Sales
department, Quality Assurance Department (QA), Quality control Department, Research
and Development Division (R&D), Accounting Division, Stem cell ban and main
workshops.
We have 3 branches located in 3 main regions of Vietnam:
1. Hanoi Branch :95 Lang Ha street, Dong Da district, Hanoi
2. Central Branch: 70 Phan-Van-Nghi street, Thanh-Khe District, Danang city
3. Can Tho Branch: 17A CMT8, Binh-Thuy District, Can-Tho City
Our company has 5 stores located in districts which has a lot of hospitals, drug stores
and private clinics in Ho Chi Minh City (District 3, District 10, District 11, Phi Nhuan
District)
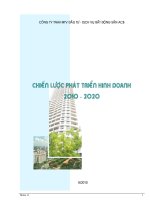
2.1.5.2. The Company’s Organizational Chart: Chart 2.1
ORGANIZATIONAL CHART
Chart 2.1: the Company’s Organizational Chart
Page | 12
Group 4- C0110
Capstone Project Report
2.6.1. List of partners
- AnSinh Hospital, stock holding 22%
- Mekong Pharmaceutical Company, stock holding 22%
Main suppliers and material producers are prestigious European, American and Asian
material producers, domestic producers, etc (Appendix 1); domestic and foreign
distributors.
Some main distributors, wholesalers of MEKOPHAR:
-
Youth Hospital 1; Tu Du hospital, People Hospital 115
-
Saigon Pharmaceutical Company – Sapharco, Mekong Pharmaceutical JSC,
National Pharmaceutical Company 2 – Codupha
-
Stores and agencies
2.1.7 Production and Sales results of MEKOPHAR over recent 3 years
a. Consumption and sales Output of some product groups over the years
Table 2.1: Consumption and sales Output of some product groups over the years
Items
Injections
Infusions
Tablet
‘Com” (is being highly
appreciated in the market)
Liquid Mixture
Ointment
Raw-materials for
Antibiotics
Raw-materials
pharmaceutical Chemistry
Unit
1.000 phial
1.000bottle
1.000tablet
Year2007
7.362
3.692
1.728.068
Year2008
5.821
2.768
1.881.251
Year2009
6.647
5.330
1.826.700
1.000pack
41.625
41.858
49.904
1.000bottle
1.000tube
1.866
3.415
1.871
3.999
1.257
6.044
1.000kg
95
101.000
64.000
1.000kg
26
18.0000
31.000
Source: Mekophar Chemical Pharmaceutical JSC.
b. Turnover of each product group over the years: (Table 2.2)
Page | 13
Group 4- C0110
Capstone Project Report
Table 2.2: Turnover of each product group over the years
Unit: Million Vietnam Dong
Items
Injections
Infusions
Tablet
‘Com” (is being highly
appreciated in the
market)
Liquid Mixture
Ointment
Raw-materials for
Antibiotics
Raw-materials
pharmaceutical
Chemistry
Other Revenues (*)
Year2007
Year2008
Value Proportion Value Proportion
18.984
3,48%
27.701
4,65%
24.074
4,41%
17.666
2,96%
366.041
67,10% 398.322 66,83%
Year2009
Value Proportion
38.330
5,93%
34.371
5,31%
412.287
63,74%
48.945
8,97%
48.613
8,16%
66.937
10,35%
10.274
7.688
1,88%
1,41%
13.420
9.100
2,25%
0,53%
5.202
15.298
0,80%
2,37%
57.036
10,46%
66.700
11,19%
33.580
5.19%
1.386
0,25%
1.339
0,22%
2.299
0,36%
11.059
545.487
2,03%
13.167
2,21%
38.541
5,96%
100,00% 596.028 100,00% 646.845 100,00%
Source: Mekophar Chemical Pharmaceutical JSC
(*) Other revenues of our company are from materials, packages sold to other
enterprises, leasing factories, offices and stem cell bank. Those revenues are insignificant
and not regular.
c. Revenue of each product group over the years
Page | 14
Group 4- C0110
Capstone Project Report
Table 2.3: Revenue of each product group over the years
Unit: Million Vietnam Dong
Items
Injections
Infusions
Tablet
‘Com” (is being highly
appreciated in the market)
Liquid Mixture
Ointment
Raw-materials for
Antibiotics
Raw-materials
pharmaceutical Chemistry
Other Revenues (*)
Year2007
Year2008
Year2009
Value Proportion Value Proportion Value Proportion
2.096
2,46%
3.138
3,91%
4.942
6,11%
(664)
-0,78% (1.131)
-1,41%
654
0,81%
57.83
52.170 61,13% 52.150
65,04%
71,47%
0
16.83
11.707 13,72% 10.545
13,15%
20,80%
0
2.512
2.94%
1.946
2,43%
443
0,55%
772.00
0,90%
1.114
1,39%
287
0,35%
0
11.431
13,39%
9.011
11,24%
-298
-0,37%
112.00
0,13%
41.000
0,05%
396
0,49%
0
5.203
6,10%
3.369
4,20%
-166
-0,21%
85.339 100,00% 80.183 100,00% 80.918 100,00%
Source: Mekophar Chemical Pharmaceutical JSC
(*) Comment: Total revenues before tax of 2009 is 80.918.143.384 VND representing an
increase of 743.724.078 VND from 2008. This can be considered as an achievement for
our company since a lot of other pharmaceutical companies are deleteriously affected by
economic crisis. Despite unfavorable economic situation, our company still operated
stably and maintained high compound interest rate. The inflation rate in 2009 increased
significantly which resulted in the increase of input and labor costs. However, the
increase in expenses of our company stayed relative with inflation rate in 2009. This is
because MEKOPHAR imposed tight control over input costs:
d. Export quota
From 2007 to 2009, average annual export revenue made up 17% of total revenues.
Export quota in 2009 reached 100 billion VND while other companies experienced
effects of economic depression. Some of traditional export markets are Laos, Cambodia,
Myanmar, Malaysia, Congo, Nigeria, etc.
Table 2.4: Results of production and business of years 2007, 2008 and 2009
Unit: Thousand Vietnam Dong
Page | 15
Group 4- C0110
Capstone Project Report
TARGET
Total asset
Net sales
Profits
Financial Revenue
Other profits
Revenue before tax
Taxable Income
CIT
Revenue after tax
Earnings per share
Dividend Rate
Year 2007
Year 2008
Proportion
of 2007
Year 2009
and 2008
(%)
Proportion
of 2008 and
2009 (%)
385.752.965 401.476.172
4,08%
447.382.505
11.43%
545.487.429 596.028.175
9,27%
646.844.920
8.53%
83.407.161 78.227.701
-6,21%
79.942.308
2.19%
1.305.311
3.278.942
151,20%
4.966.297
51.46%
1.932.003
1.955.718
1,23%
975.835
-50.10%
85.339.164 80.183.419
-6,04%
80.918.143
0.92%
85.339.164 80.183.419
-6,04%
80.918.143
0.92%
22.555.007 18.520.201
-17,89%
19.727.457
6.52%
62.784.157 61.663.218
-1,79%
61.190.687
-0.77%
7.854
7.267
-7,47%
6.753
-7.07%
20%
30%
50,00%
30%
0.00%
Source: Audit Report of years 2007, 2008 and 2009
(*) Dividends from An Sinh Hospital in 2008 and 2009 were 1.054.368.322 and
1.676.000.000 VND respectively. Until 31th December 2009, Mekophar owned 22% of
38.1 billion VND chartered capital of An Sinh Hospital.
In spite of many fluctuations in the economy, MEKOPHAR achieved positive results:
-
Net Sales was 646,8 billion VND representing an 8,53% increase from 2008
-
Profit before tax was 80,9 billion VND representing an 0.92% increase from 2008
-
Profit after tax was 61.2 billion VND, completed 108.93% plan of 2009.
(*) Comment:
- Total assets on 31st December 2009 were 447.382.505.024 VND, representing an
11.43% increase from those of 31st December 2008. The most remarkable one was an
increase in fixed intangible assets and cash item in Balance Sheet (Appendix 5: Balance
Sheet and Financial Ratios). Liquidity rate remained high as the company had high
volume of cash and didn’t use loan. This fact demonstrated our company’s financial
independence and sustainable development. According to audited financial report on 31 st
December 2009, profit after tax was 61 billion VND, completed 108.93% plan of 2009.
Page | 16
Group 4- C0110