Nghiên cứu định lượng steroid niệu bằng GC MS trong chẩn đoán rối loạn sinh tổng hợp steroid bẩm sinh ở trẻ em tt tiếng anh
Bạn đang xem bản rút gọn của tài liệu. Xem và tải ngay bản đầy đủ của tài liệu tại đây (826.52 KB, 30 trang )
MINISTRY OF EDUCATION & TRAINING
MINISTRY OF HEALTH
HANOI MEDICAL UNIVERSITY
TRAN THI NGOC ANH
Urine steroid profiling by gc/ms for
diagnosis of congenital steroid biosynthesis
disorders in children
Specialized
: Biochemistry
Code
: 62720112
SUMMARY OF DOCTORAL DISSERTATION
HANOI – 2019
THE DISSERTATION IS COMPLETED IN HANOI
MEDICAL UNIVERSITY
Advisors : 1. PhD. Tran Thi Chi Mai
2. Ass Prof. PhD. Tran Minh Dien
Reviewer 1: Ass Prof. PhD. Nguyen Thi Ha
Reviewer 2: Ass Prof. PhD. Nguyen Nghiem Luat
Reviewer 3: Ass Prof. PhD. Nguyen Phu Dat
The dissertation will be protected at the Board of University
doctoral dissertation evaluation at the Hanoi Medical
University:
The contents of the dissertation can be found at:
- National Library of Vietnam
- Library of Hanoi Medical University
INTRODUCTION
1. Necessity of the research.
Steroid disorders in children: congenital adrenal hyperplasia is a
genetic disorder with a high incidence which is early detected and
treated in newborn screening. The disease is caused by acquired
mutations in a group of genes that are responsible for the biosynthesis
from three various steroid hormones including glucocorticoids,
mineralocorticoids, and sex hormones. Deficiency of 21-OH, 11βOH, 3β-HSD II and 5α-reductase type 2 are the commonest causes of
such disorder and 17α-OH/17, 20-lyase, aromatase deficiency, 11βHSD II, 17β-HSD are some rare causes. Early diagnosis and timely
treatment for babies after birth are important to reduce mortality and
complications. Quantitative steroids permits diagnosis of other forms
of enzyme deficiencies causing steroid biosynthetic disorders that
have been applied for over 35 years in the world but have not been
processed in Vietnam. The number of patients with congenital
adrenal hyperplasia and sex development disorder in Vietnam is high,
especially at the National Children's Hospital; it's currently managing
nearly 1,000 patients, so the quantitative analysis of steroids by gas
chromatography-mass spectrometry (GC-MS) might aid diagnosis
and monitoring congenital steroid biosynthetic disorders in children.
Before applying new methods to patients, it needs to be assessed,
setup a reference interval of steroid hormones in children and apply
this for diagnosis CAH and DSD.
2. Purpose.
Purpose 1: Urinary steroid profiling with GC/MS requires an
appropriate validation and set out reference intervals for the urinary
steroid metabolomics for children under 11 years old.
Purpose 2: Urinary steroid profiling with GC/MS to diagnose some
forms of biosynthesis of steroid hormones in the congenital adrenal
cortical hyperplasia.
3. Location
The study is Department of Biochemistry - Vietnam National
Children's Hospital.
4. New contribution of the study
GC/MS analysis of urinary steroid hormones is now the go to
method in the first time in Vietnam and the evaluation criteria meet
the technical requirements of accuracy and authenticity. Reference
intervals for 17 urinary steroids and 8 diagnostic ratios are
established for children younger than 11 years of age. Based on this
method, diagnosis of 21-OH, 11β-OH, 3β-HSD II and 5α-reductase
type 2 deficiencies in many patients are confirmed by corresponding
mutation analysis.
5. Scientific and practical significance of the study.
The research is highly practical and contributes to providing a
modern diagnostic method to detect steroid biosynthetic disorders.
This method permits diagnosis of other forms of enzyme deficiencies
causing congenital adrenal hyperplasia, thereby reducing the number
of cases that require genetic analysis to reduce the cost of diagnosis
and treatment.
This research has scientific significance with tightly-packed layout,
appropriate data processing methods, international standards for new
technical implementation with the method of evaluation, reference an
interval which is applied to the diagnosis of congenital adrenal
hyperplasia and sex development disorder.
Theme of study is innovative, trendy and up-to-date which
successfully implements quantitative urinary steroids method in the
first time in Vietnam, and it has been routinely applied to patients
since 2018.
4. The structure of thesis.
- The thesis is presented in 136 pages (excluding references and
appendices). It is divided into 7 parts: 2 pages of Introduction;
Chapter 1: 40 pages of Overview; chapter 2: 16 pages of Subjects and
research methods; Chapter 3: 46 pages of Results; chapter 4: 29
pages of Discussion; 2 pages of Conclusion; 1 page of
Recommendation.
- The thesis consists of 34 tables, 34 charts, figures and diagrams,
129 references, including 20 documents in Vietnamese and 109
documents in English. The appendix includes: Sample survey and
evaluation forms; collective form, results of genetic analysis; list of
patients participating in the study.
Chapter 1: OVERVIEW
1. Pathology of steroid biosynthetic disorders
Deficiency of any enzyme responsible for the biosynthesis also
disrupts steroid biosynthesis, which is divided into three main
groups, including congenital adrenal hyperplasia (CAH), disorders of
electrolyte, and disorders of sex development (DSD). The most
common cause is deficiency of 21-hydroxylase enzyme accounted for
more than 90% of cases of CAH, deficiency of 11β-OH ranked
second with 5-8%, deficiency of 3β-HSD II and other enzymes are
rare causes of CAH. In addition, deficiency of enzyme 5α-reductase
type 2 causes a reduction in the synthesis of 5α-dihydrotestosterone,
resulting the feminisation of men-children, which is one of the two
most common causes of DSD in men-children with 46,XY
chromosomes.
Quantification of 17-OH-P from a dried blood spot helps to detect
cases of typical CAH due to deficiency of 21-OH, and some patients
with deficiency of 11β-OH, however, it cannot help to detect cases of
CAH and DSD due to deficiency of 3β- HSD II, Cyt P450
oxidoreductase (POR), 5α-reductase type 2, AME (apparent
mineralocorticoid excess). At the same time, 17-OHP test shows a
high false-positive in preterms, low birth weight newborn and it is
irrespective of CAH types also.
2. GC/MS analysis of urinary steroid quantification
Urinary steroid quantification by Selective Ion Monitoring Gas
Chromatography-Mass Spectrometry (GC/MS-SIM) has been applied
over the world since the 1980s to date in diagnosing forms of
congenital adrenal hyperplasia. The method has high sensitivity and
specificity and urine specimens, so it is suitable for all subjects,
especially children. Each pathology of enzyme deficiency has a
characteristic chromatographic pattern due to a deficiency of
hormones and an increase of precursor in previous position of
enzyme. The concentration of steroids compared with the reference
intervals and the diagnostic precursor-to-product ratios are used to
detect and distinguish different disorders of biosynthesis of steroid
hormones due to deficiency of 21-OH, 11β-OH, 3β-HSD II or 5αreductase type 2 and deficiency of 17-OH, POR, AME...
Urinary steroid quantification was first implemented in Vietnam,
so it is necessary to evaluate the method and set out the reference
intervals according to international guidelines to ensure the quality of
method and comply with ISO 15189.
Technical process is improved under the guidance of Honour JW,
Ronda F Greaves. In patients with clinical signs of CAH and DSD,
we quantify the concentration of steroid hormones met the diagnostic
criteria of steroid biosynthetic disorders and then collect the results of
electrolytes and ACTH in the medical record and a genetic analysis is
suggested to confirm the diagnosis.
Chapter 2
SUBJECTS AND METHODS OF RESEARCH
2.1. Subjects of Research
2.1.1. Control group:
Including 269 healthy children aged from 1 day to 11 years,
divided into 4 groups:
Group 1: 64 children from 1 day to 28 days old.
Group 2: 61 children from 1 month (≥ 29 days) to < 2 years
old.
Group 3: 74 children from 2 years old to < 8 years old.
Group 4: 70 children aged 8-< 11 years.
Sex: Masculine and feminine ratio is equal.
Selection criteria: Healthy children do not have abnormal signs of
CAH and sex development disorder. Full-term infant according to
WHO standards within each gestational term of 37-42 weeks, birth
weight > 2500g, with no family history of a disorder. Specimens
were collected at the Department of Obstetrics and Gynecology of
Vinh Phuc General Hospital, the commune or ward health clinics
where carríe out the routine vaccination program for children,
kindergartens and primary schools in Vinh Phuc province and Hanoi
City and from groups of disease in the meanwhile.
Exclusion criteria: The family and/or the children do not agree to
participate in the study, the child has one of the clinical signs
suspecting the above mentioned CAH or DSD or receiving
corticosteroids within 1 month.
2.1.2. Group of diseases:
Including 200 patients suspected of having a steroid biosynthetic
disorders, diagnosed with CAH, DSD, and ED by endocrinologists
and pediatricians.
Location: Department of Endocrinology - Metabolism - Genetics
of Vietnam National Children's Hospital and Department of Pediatric
Surgery - Viet Duc Hospital.
Sampling time: from October 2015 to July 2018.
Selection criteria: when there are one or more signs:
Patients with CAH: Clinical and laboratory standards based on
announced New MI standards.
Clinical symptoms: Ambiguous genitalia, genitals may not appear
clearly male or female children; signs of early puberty in boys; signs
of dehydration, adrenal insufficiency in both men and women.
Patients with disorders of sex development:
There are symptoms: Genital abnormalities such as micropenis,
narrowing of the urethra, hidden testicles, penile agenesis, double
scrotum and female external organs. Bodies of male children to
appear feminized such as breast development, menstruation, signs of
primary amenorrhea in female appearance.
Families and/or patients suspected of having CAH and DSD
consented and signed an informed consent form to participate into the
research group.
Exclusion criteria: patients and/or families do not agree to
participate in the study.
Patients with electrolyte disorders merely due to systemic diseases,
digestive organs without clinical signs CAH, DSD.
Patients with dysplasia steroid biosynthetic disorders such as drugrelated Cushing syndrome, Addison, adrenal adenoma.
Specimens: Random urine specimens were stored for 2 weeks at 280C, 6 months at -200C
2.3.3. Method of Research
- Validation of GC-MS urinary steroid method based on
Westgard's instructions with the following contents: Determine the
limits of detection, recovery, imprescision and and acuracy.
- Establish the urinary steroid reference intervals in children
according to the guidelines of the International Federation of Clinical
Chemistry (IFCC) and Clinical and Laboratory Standards Institute
(CLSI): Evaluate the distribution of each urinary steroid, calculate
the reference intervals for men and women in each age group which
be set for both men and women in case of without difference.
Calculate the diagnostic ratio, set out the concentration intervals and
diagnostic ratios for men and women in each age group. If there is no
difference the concentration intervals will be common for both men
and women. Reference interval calculated by non-parametric method
with non-standard distribution data. Arrange the data in the
increasing direction of the value, select the low value and the high
value of the reference interval from the list of referenced values so
that the low reference value corresponds to the 2.5 percentile (2.5%
percentile) and high reference value corresponding to percentile 97.5
(97.5% percentile) of the reference interval.
x0,025 = 0.025 (n + 1)
x0,975 = 0.975 (n + 1)
In which:
x 0.025 is the low reference value corresponding to 2.5 percentile.
x0.975 is the high reference value corresponding to the 97.5
percentile.
n is the number of samples that set out for reference interval
- Develop standards for diagnosis and application of urinary
steroid quantification in the diagnosis and monitoring of steroid
biosynthetic disorders in patients suspected of having CAH or DSD.
-Collect results of blood tests, genetic analysis in medical records.
Diagnostic criteria were established for a number of conditions of
steroid enzyme deficiency based on Krone et al., Chan OK et al. in
the laboratory's existing condition.
Diagnosis of 21-OH deficiency when there are the following
characteristics:
There is the appearance of peak 17OHPN, PTL on
chromatogram (qualitative).
The PT concentration is higher than the reference intervals.
The ratio of PT/ (THE +THF +5α-THF) is higher than the
reference intervals.
The ratio of THS/ (THE+THF+5α-THF) in the reference
intervals.
Diagnosis of 11β-OH deficiency when there are the following
characteristics:
There is a clear appearance of THS peak on chromatogram
(qualitative).
The concentration of THS is higher than the reference intervals.
The ratio THS/ (THE +THF +5 α -THF) is higher than the
reference.
Diagnosis of 3β-HSD II deficiency when there are the following
characteristics:
DHEA levels are higher than the reference intervals.
The ratio of DHEA/ (THE +THF +5 α-THF) is higher than the
reference intervals.
There are no signs of deficiency of 21-OH or 11β-OH when
urinary steroid quantification is conducted.
Diagnosis of 5α-reductase type 2 deficiency when there are the
following criteria:
The ratio of 5α-THF/THF is lower than the reference intervals or
the ratio of THF/5α-THF is higher than the reference intervals.
As a male patient with chromosome 46,XY, there are clinical
signs of micropenis, narrowing of the urethra, double scrotum.
Ratio of THF/5α-THF is higher than the reference intervals
and chromosome 46,XY in male children with DSD signs are two
standards became mandatory.
2.3.7. Analyzing and processing data.
Use Excell, SPSS 22.0 software, Method validation software in data
processing and method comparison.
Chapter 3: RESEARCH RESULTS
3.1. Results of method validation
Table 3.1: Limit of quantitative and recovery
Numbe
r
Steroids
LOQ (μmol/L)
CV (%)
Recovery
(%)
1
An
0.11
13.18
102,5
2
Et
0.05
10.69
114,7
3
DHEA
0.10
17.84
113,3
4
11 keto An
0.12
8.36
111,1
5
11-OH An
0.07
19.3
112,0
6
11-OH Et
0.09
10.48
113,6
7
PD
0.07
14.64
100,0
8
PT
0.07
16.86
101,5
9
A’3
0.21
9.82
91,4
10
THE
0.16
11.28
112,7
11
THF
0.11
18.43
110,2
12
5α-THF
0.11
18.07
106,3
13
α-Cortolone
0.09
8.32
91,3
14
β-Cortol
0.11
15.16
91,8
15
β-Cortolone
0.06
10,9
99,4
16
α-Cortol
0.27
13,09
90,9
Quantitative limits of 14/16 steroids ranged from 0.05 to 0.16
μmol/L, particularly α-Cortol and A'3 had quantitative limits of 0.27
and 0.21 (μmol/L) respectively which is higher than other products
but less valuable in diagnosing congenital adrenal hyperplasia.
Recovery of steroid metabolic products is from 90% to 115%.
The average is 101.9 ± 8.4% ( ± SD).
Table 3.2. Short term impresision
Steroids
Pool normal
(µmol/L)
Pool anormal
SD
CV
(µmol/L) (%)
SD
(µmol/L) (µmol/L)
CV
(%)
An
1.25
0.096
7.72
18.44
1.695
9.20
Et
1.50
0.098
6.53
12.63
1.091
8.64
PD
2.31
0.06
2.72
2.61
0.093
3.54
PT
1.49
0.015
1.01
86.87
0.677
0.78
THE
7.47
0.314
4.20
22.33
1.362
6.10
THF
2.87
0.107
3.72
6.15
0.355
5.80
5α-THF
3.03
0.132
4.34
8.02
0.459
5.70
α-Cortolone
3.13
0.051
1.62
4.42
0.090
2.04
β-Cortol
1.22
0.053
2.82
1.23
0.041
3.33
β-Cortolone
2.13
0.045
2.11
3.16
0.075
2.36
α-Cortol
0.49
0.030
6.12
0.80
0.031
3.95
Short-term accuracy of urinary steroid metabolic products
with normal specimens has CV from 1.01 to 7.72%.
Short-term accuracy of urinary steroid metabolic products
with pathological specimens has a CV of 0.78 to 9.72%.
The median value of CV in normal specimens is 4.0 ± 2.2
(%) and pathological specimens is 4.7 ± 2.7 (%) ( ± SD).
Table 3.3. Long term impresision
Steroids
Pool normal
Pool anormal
(µmol/L)
SD
(µmol/L)
CV
SD
(%)
An
1.23
0.15
12.55
15.00
2.44
16.26
Et
1.48
0.18
11.87
10.14
1.61
15.91
PD
2.42
0.34
14.04
2.50
0.35
14.13
PT
1.72
0.23
13.61
89.33
11.17
12.51
THE
8.08
1.04
12.9
22.96
3.68
16.01
THF
3.14
0.32
10.16
6.34
0.87
13.7
5α-THF
3.46
0.48
13.81
8.48
1.23
14.53
α-Cortolone
3.36
0.40
11.83
5.19
0.78
15.7
β-Cortol
1.39
0.20
14.53
1.47
0.22
15.26
β-Cortolone
2.37
0.30
12.65
3.56
0.47
13.14
α-Cortol
0.58
0.08
13.37
0.85
0.14
16.95
(µmol/L) (µmol/L)
CV
(%)
The median value ± SD of CV in normal specimens is 12.85 ± 1.24
(%) and pathological specimens is 14.86 ± 1.4 (%) ( ± SD).
Table 3.4: Correlation bethwen results and median of EQA
r
Slope
Intercept
Steroids
Phương trình
correlatio
b
a
n
An
0.969
-0.015
y=0.969x-0.015
0.991
Et
1.014
-0.024
y=1.014x-0.024
0.992
DHEA
1.250
0.0
y=1.25x + 0
0.983
11Keto An
1.106
-0.065
y=1.106x-0.065
0.991
11-OH An
1.042
-0.068
y=1.0x-0.068
0.996
11-OH Et
0.611
0.039
y=0.611x+0.039
0.981
PD
1.080
0.021
y=1.08x+0.021
0.988
PT
0.997
0.039
A’3
1.149
-0.042
y=1.149x-0.042
0.995
THE
1.250
-0.891
y=1.25x-0.891
0.990
THF
1.113
-0.406
y=1.113x-0.406
0.995
5α-THF
1.148
-0.037
y=1.148x-0.037
0.970
αCortolone
1.124
-0.211
y=1.124x-0.211
0.981
βCortolone
1.113
- 0.082
y=1.113x-0.082
0.992
α-Cortol
1.00
-0.01
y=1.0x-0.01
0.997
β-Cortol
1.013
-0.006
y=1.013x-0.006
0.994
y=0.997x+0.03
9
0.999
The urinary steroids are closely correlated with the median
values of the EQA results with a correlation coefficient r of 0.970.999. The angle coefficient approximates the value 1.0 and intersects
the vertical axis at point b with a value of approximately 0, so the
linear lines almost go through the origin. THE and DHEA are higher
than EQA value with a coefficient of 1.25 and 11-OH Et is lower than
external quality assessment value with a coefficient of 0.611. The
urinary steroids have agreement similarity to the median value of
external quality assessment.
3.2. Reference intervals of steroids in chidren
Table 3.5: Age and sex in controls
Sex
Age
Group 1th:
1-28 days
Group 2th:
1 m - <2 years
Group 3th:
2 - < 8 years
Group 4th:
8-11 years
Sum
Boys
Girls
p
n
%
n
%
34
53.1
30
46.9
0.617
31
50.8
30
49.2
0.898
43
58.1
31
41.9
0.163
29
41.4
41
58.9
0.151
137
50.9
132
49.1
0.243
There is no difference in the number of boys and girls in each age
group as well as with the total number of men and women (p> 0.05).
Distribution of urinary steroid metabolic products
All 16 parameters of steroid levels do not follow the Gaussian
distribution. Comparison is based on median value (med.), lowest
value (min), highest value (max). The reference intervals comprising
95% of the median value is taken at the cutoff points of 2.5th and
97.5th percentiles.
The concentration of An, Et, 11OH An and 11OH Et is very
low in children < 8 years of age, increasing gradually in children
aged 8-11 years. Concentration of THE, THF, 5α-THF increases with
age.
Table 3.6. Concentration of steroids
Steroids
An
Group 1
n=64
0.02
1 -0.56
Et
0.01
0-0.43
DHEA
11 Keto
An
11 OH An
11 OH Et
PD
0,14
0.013.03
0.09
0.011.25
0.02
0-0.22
0.02
0- 0.20
0.10
0-1.33
Median (min-max)
μmol/mmol creatinine
Group 2 Group 3 Group 4
n=61
n=74
n=70
0.01
0.01
0.15
0-0.71
0.0-0.35
0.011.08
0.0
0.01
0.09
0- 0.71
0- 0.19
0.010.60
0.05
0.02
0.06
0- 1.29
0-0.01
0.011.49
0.01
0.03
0.06
0- 0.71
0 – 1.32
0 – 0.60
0.03
0-1.05
0.08
0.0-0.78
0.01
0- 0.71
0.01
0-0.71
0.01
0.0- 0.43
0.02
0.0-1.02
THE
0.04
0.03
0.04
0-1.03
0-0,71
0.0-0.87
0.92
0.17
0.02
0.040-6.89
0.0-0.76
123.6
0.82
0.93
1.77
0.09-14.4 0.05-22.1 0.02-18.2
THF
0.17
0.15
0.49
0.01-4.11 0.02-1.46 0.01-5.24
PT
A’3
5α-THF
0,33
0.21
0.73
0.23
0.010.81
0.01
0.01- 0.29
0.04
0.010.52
0.08
0.0-0.36
0.02
0.0-0.20
2.6
0.016.13
0.63
0.011.37
0.65
p
0.00
0
0.00
0
0.00
0
0.00
0
0.00
0
0.00
1
0.00
0
0.00
0
0.00
0
0.00
0
0.00
0
0.00
0.02-12.4
αCortolone
β-Cortol
βCortolone
α-Cortol
THS
0.01-15.7 0.02-3.33
0.03
0.15
0.47
0.0-0.33
0-3.47 0.01-16.1
0.02
0-0.43
0.04
0-0.71
0.2
0.25
0.01-3.54 0.01-12.3
0.15
0.01-3.9
0.31
0.01-8.7
0.02
0-0.72
0.04
0-2.05
0.09
0 -4.0
0.01
0-0.20
0.01
0-0.71
0.01
0-0.10
0.031.97
0.74
0.031.68
0.12
0.010.36
0.34
0.020.82
0.08
0.010.43
0.01
0-0.04
0
0.00
0
0.00
0
0.00
0
0.00
0
0.00
0
There were differences between ages with p ≤ 0.001 (Mann
Withney U test.)
Table 3.7: Reference intervals (RI) of steroids
Steroids
Group 1th
RI μmol/mmol creatinine
Group 2th
Group 3th
Group 4th
Boys: 0 – 0.38
Girls: 0 – 0.86
An
0 – 0.1
0 – 0.1
0 – 0.17
Et
0 – 0.09
0 – 0.1
0 – 0.12
Boys: 0 – 0.29
Girls: 0 – 0.46
DHEA
0.01 – 0.68
0 – 0.86
0 – 0.26
0.01 – 0.22
11 Keto-An
0.01 – 0.58
0 – 0.26
0 – 0.29
Boys:0- 0.39
Girls: 0- 0.45
11OH-An
0 – 0.20
0 – 0.70
0 – 0.28
0.01 – 0.52
11OH Et
0 – 0.14
0 – 0.17
0 – 0.10
Boys: 0 – 0.13
Girls: 0 – 0.21
PD
0 – 0.55
0 – 0.17
0 – 0.49
Boys: 0 – 0.12
Girls: 0 – 0.23
PT
0 – 0.25
Boys: 0- 0.36
Girls: 0- 0.25
0 – 0.18
Boys: 0- 0.16
Girls: 0 – 0.24
A’3
0.05 – 18.9
0 – 5.42
0 – 0.30
0 – 0.15
THE
0.16 – 2.76
0.08 – 6.6
0.02 – 4.34
0.17 – 5.08
THF
0.01 – 0.87
0.02 – 0.9
0.03 – 1.14
0.02 – 1.11
5α-THF
0.02 – 4.0
0.02 – 2.47
0.03 – 2.43
0.03 – 1.51
α-Cortolone
0 – 0.20
0 – 1.15
0.01 – 2.74
0.03 – 1.37
β-Cortol
0 – 0.12
0 – 0.19
0.01 – 0.33
0.02 – 0.27
β-Cortolone
0.02 – 0.68
0.01 – 1.17
0 – 0.82
0.06 – 0.64
α-Cortol
0 – 0.53
0 – 0.67
0 - 0.6
0.01 – 0.18
THS
0 – 0.10
0 – 0.10
0 – 0.04
0 –0.03
There were differences between men and women in children aged 811 years in 6 parameters and PT of children from 1-month to 2-yearold p< 0.05 (Mann Withney U test).
Table 3.8: Ratios for diagnostic
Median, (Min-Max)
Ratios
p
Group
Group
Group
Group
1th
2th
3th
4th
0.03
0.02
0.02
0.02
0.001
1
0.0-0.33 0.0-0.16
0.0-0.20 0.01-0.31
0.05
0.01
0.002
0.002
0.000
2
0.0-0.33 0.0- 0.23 0.0- 0.11
0.0-0.02
1.67
1.8
1.52
1.01
0.007
3
0.34- 8.0 0.3- 10.8 0.4 – 4.1 0.20- 2.6
0.056
1.0
0.66
0.96
4
0.050.090.240.38-4.95 0.000
7.10
3.33
2.59
0.09
0.03
0.01
0.02
0.000
5
0.010.0-0.82 0.0-0.43
0.0-0.23
1.59
6
0.75
0.55
0.71
0.50
0.000
7
8
0.054.96
0.03-2.6
0.29-4.0
0.29-0.95
NA
NA
NA
0.79
0.0-4.0
1.0
0.0 – 5.0
0.72
0.0-5.0
1.61
1.0 – 3.09
0.59
0.25-1.16
0.007
0.001
There were differences between ages with p ≤ 0.01 (Kruskal-Wallis U test)
Table 3.9: Reference intervals for ratios
Ratios
Group 1
Group 2 Group 3
Group 4
Boys: <
Boys: < 0.06
1
0.19
<0.09
< 0.07
Girls:<0.15
Girls:<0.11
2
< 0.11
< 0.09
< 0.10
< 0.10
3 in boys
0.27-12.0 0.39-10.18 0.42-3.33
0.45-2.06
4 in boys 0.13 –1.85 0.09 –2.65 0.24 –1.32 0.38 – 3.31
5
< 0.31
< 0.69
< 0.13
< 0.17
Boys: < 0.82
6
< 2.94
< 1.59
< 1.47
Girls:<0.78
7 in boys
NA
NA
0.2-4.3
0.95-2.89
8 in boys
NA
0.0-2.1
0.0-5.0
0.32-1.0
Ratio 1: PT/(THE+THF+5α-THF)
Ratio 6: (THF +5αTHF)/THE
Ratio 2: THS/ (THE +THF +5α-THF) Ratio 7: An/Et
Ratio 3: 5α-THF/THF
Ratio 8: Et/An
Ratio 4: THF/5α-THF
Ratio 5: DHEA/(THE+THF+5α-THF)
The ratios (3) and (4) as well as (7) and (8) are significant in
diagnosing deficiency of 5α-reductase type 2 in men, so the reference
intervals for these ratio is established for men.
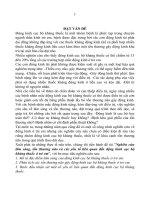
Figure 3.1: Chromatography of
standard
Figure 3.2: Chromatography of
5α-reductase type 2 def
Figure 3.3: Chromatography of
21-OH def
Figure 3.4: Chromatography of
3β-HSD II def
Figure 3.5: Chromatography of
Figure 3.6: Ion fragment of PT
11β-OH def
Chromatography total of sample with 21-OH deficiency: present
peak 17OHPN, PTL. Sample with 11β-OH: present peak THS.
Sample with 5α-reductase type 2: peak 5α-THF was very lower than
THF. Sample with 3β-HSD type 2: peak DHEA (3) was higher than
normal sample.
Table 3.10: Level of steroids in patients with 21-OH def
Steroids
Median, (min, max)
µmol/mmol creatinine
Controls
(n = 269)
Before treate
(n=69)
After treate
(n=37)
An
0.49 (0.0-63.7)
0.18 (0.0-29.7)
0.04 (0 – 27.51)
Et
0.18 (0.0-36.6)
0.09 (0.0-17.2)
0.03 (0 – 15.14)
DHEA
0.19 (0.01-29.7)
0.17 (0.0-81.9)
0.13 (0 – 25.35)
11 Keto-An
0.44 (0.01-12.7)
0.26 (0.0-19.6)
0.11 (0 – 8.81)
11OH-An
2.13 (0.01-48.3)
0.88 (0.0-57.3)
0.13 (0 – 9.03)
11OH Et
0.12 (0.0-1.81)
0.05 (0.0-3.85)
0.06 (0 – 3.73)
PD
0.4 (0.04-7.7)
0.31 (0.0-12.1)
0.11 (0 – 7.74)
PT
10.4 (0.04-110)
4.72 (0.13-416)
0.11 (0 – 3.66)
A’3
0.3 (0.003-5.07)
0.11 (0.0-21.2)
0.18 (0 – 92.03)
THE
1.51 (0.09-53.5)
3.52 (0.04-88.4)
3.67 (0.05 – 104)
THF
0.47 (0.01-20.3)
0.74 (0.0-92.7)
0.99 (0.0 – 23.6)
5α-THF
0.46 (0.02-20.7)
1.05 (0.02-64.5)
1.83 (0.0 – 21.3)
α-Cortolone
0.27 (0.03-6.22)
0.53 (0.02-4.09)
0.61 (0 – 25.15)
β-Cortol
0.09 (0,0-6.52)
0.22 (0.0-8.85)
0.2 (0 – 6.18)
0.28 (0.04-28.8)
0.68 (0.01-21.6)
0.72 (0.0 – 14.1)
α-Cortol
0.06 (0.00-2.92)
0.11 (0.01-3.41)
0.2 (0 – 5.14)
THS
0.02 (0.0-2.07)
0.02 (0.0-3.45)
0.03 (0 – 0.7)
β-Cortolone
The concentration of An, Et, and PT in patients who received
treatment is higher than those of untreated patients. The
concentration of An, Et, PT in patients with 21-OH deficiency was
higher than the control group with statistical significance with p
<0.01.
Table 3.11: Steroids in patients with 5α-reductase type 2 deficiency
Code
Ages
(year)
VD17
0.5
VD21
1.5
VD11
1.9
VN106
2.6
VN108
5αTHF/THF
Result
THF/5α-THF
RI Result
0.11
0.300.04
10.8
0.08
9.0
24.0
13.0
102
RI
0.092.65
0.241.32
Tỷ lệ An/Et
Tỷ lệ Et/An
Result
RI
Result
ND
ND
ND
ND
ND
ND
ND
ND
ND
2.5
0.24.3
4.0
3
0.01 0.420.02 4.1
40.1
VD18
3.5
0.02
42.6
ND
0.5
VD12
4
0.05
18.7
ND
ND
VD19
5
0.13
7.9
ND
1.0
ND
1.0
RI
0.02.1
0.05.0
VD14
5.1
0.02
41.0
0.05
2.8
VD15
5.5
0.03
30
1.14
2.5
VD13
8.5
0.04
27.3
0.33
34.0
VD16
10.5
32.3
VN107
12.3
0.03 0.200.05 2.6
19.2
0.383.31
0.21
0.50
0.952.89
5.04
5.83
0.32
- 1.0
VD20
12
0.04
23.8
0.80
2.84
ND: Not detected
14 patients with 5α-reductase type 2 deficiency had a lower ratio of
5α-THF/THF than the reference intervals, the ratio of An/ Et was
lower than the reference intervals in 5 patients aged 5.1-12.3. 14/14
patients had a THF/α-THF ratio higher than the reference intervals,
the Et/An ratio was high in children > 8 years old.
Table 3.12: Level of steroids in patient wtih 3β-HSD II def
No
Steroids
1
2
3
4
5
6
7
8
9
10
11
12
13
14
15
16
An
Et
DHEA
11 Keto-An
11OH-An
11OH Et
PD
PT
A3
THE
THF
5α-THF
α-Cortolone
β-Cortol
β-Cortolone
α-Cortol
Level µmol/mmol
creatinine
Results
RI of
8-11 years old
0.73
0.01– 0.38
0.65
0 – 0.29
8.6
0.01 – 0.22
0.26
0.01 – 0.39
0.78
0.01 – 0.52
0.17
0 – 0.13
0.08
0 – 0.12
0.12
0-0.16
0.06
0 – 0.15
1.69
0.17 – 5.08
1.03
0.02 – 1.11
0.65
0.03 – 1.51
0.54
0.03 – 1.37
0.02
0.02 – 0.27
0.20
0.06 – 0.64
0.20
0.01– 0.18
Conclution
High
High
Very high
Normal
High
High
Normal
Normal
Normal
Normal
Normal
Normal
Normal
Normal
Normal
Normal
17
THS
0.01
0 –0.03
Normal
The concentration of DHEA, An, Et, 11-OH An and 11OH Et of
the patients was higher than the control group.
The ratio of DHEA/ (THE +THF +5α-THF) = 2.55 is 17 times
higher than the upper limit of the reference interval (<0.17).
The ratios of PT/(THE +THF +5α-THF)=0,034 and THS/(THE
+THF +5α-THF)=0.002 are in the reference interval.
CHAPTER 4: DISCUSSSION
4.1. Results of validation method
Urinary steroid quantification by gas chromatography-mass
spectrometry was first implemented in the Department of
Biochemistry - Vietnam National Children's Hospital. Method
validation is necessary and mandatory. Validation results with a
quantitative limit of 0.05 to 0.27 µmol/L ensure the sensitivity in
diagnosis even with diluted urine specimens of infants. Recovery has
reached 90-115 (%) similar to other researches by Homma K,
Caufield M. Short-term and long-term accuracy with normal urine
specimens has CV 1.01-7.72 and 10.16-14.53 (%) respectively.
Short-term and long-term accuracy with pathological urine specimens
have CV of 0.78-9.72 and 12.51-16.95 (%) respectively. Ensure the
stability of the method in one test and the various tests. Test results of
the laboratory are closely correlated with the correlation coefficient
r> 0.97 and similar to median values from 28 different laboratories in
the world participating in the External Quality Assessment Scheme
SKML.
The results of the validation have showed that the GC-MS urinary
steroid method at the Department of Biochemistry - Vietnam
National Children's Hospital met the requirements of accuracy and
authenticity to patients.
4.2 Reference intervals for the urinary steroid in
children
The reference intervals for the urinary steroid is established
for 17 steroid urinary concentrations and 8 important diagnostic
ratios to help diagnose most of the common disorders of steroid
hormones due to deficiency of 21-OH, 11β-OH, 3β-HSD II or 5αreductase type 2 and electrolyte disorders due to hyperaldosteronism
AME, High cortisol. The reference intervals for 269 healthy children
from birth (1 day of age) to 11 years in both men and women with the
same number divided into 4 age groups.
The distribution of urinary steroids and diagnostic ratio is not
Gaussian, so the reference interval is 95% of the range from the 2.5
to 97.5 percentile after disposition. The values are in ascending order
according to IFCC guidelines.
There are differences in the concentration of steroids between age
groups of group 1 (from 1-28 days of age), group 2 (1 month - <2 years),
group 3 (2- <8 years) and group 4 (8- ≤11 years old, so the reference
intervals is set out for each age group. The concentration of cortol and
cortolone increases with age, the concentration of An, Et, 11OH An and
11OH Et is lower in children <8 years of age and markedly increased in
children aged 8-11 years. DHEA, 11 Keto An, A'3 in newborns were
high and decreased in group 2 and then increased in group 4.
Concentration of THS is low at all ages. The reference intervals of 17
steroids in group 1, group 2 and group 3 has without difference between
men and women except for group 2 and was increased for both men and
women. Particularly for group 4, concentration of 6 urinary steroids
includes An, Et, 11keto-An, 11OH Et, PD, PT in female is higher than
male with p <0.05. Female puberty comes earlier than male (female
puberty is between 8-12 years, while male puberty is about 1-2 years,
from 11-14 years). The reference intervals for the urinary steroid is
established in µmol/mmol creatinine while different authors build other
reference intervals for different ages in different units such as µmol/L,
µg/mg creatinine, µg/mmol creatinine or µmol /24h.
The diagnosis ratio is considered as an effective tool to help to detect
and diagnose different types of CAH. Based on the diagram of the
biosynthesis and metabolism of enzymes involved in steroid
synthesis, many authors offer different diagnostic ratios for each
pathology of enzyme deficiency involved in steroid biosynthesis. The
ratio of PT/(THE + THF +5α-THF) was used in diagnosis of 21-OH
deficiency has differences between age groups and between men and
women in newborns and children 8 - ≤11 years which is similar to
Krone et al., Kamrath C et al.
The ratio of THS/(THE + THF +5α-THF) was used in the diagnosis
of 11-OH deficiency, it is low at all ages and did not differ between
men and women similar to Krone N, Kamrath C.
We use the ratio of DHEA/(THE +THF +5α-THF) in diagnosis of
3β-HSD II deficiency, it is markedly different between ages but
between men and women, it has no sign.
An/Et and 5α-THF/THF ratios are used in the diagnosis of 5αreductase type 2 deficiency in men-children (chromosome 46,XY)
with sex development disorder. In which the ratio of 5α-THF/THF is
used in diagnosis in children ≥ 6 months.
The ratio (THF + 5α-THF)/THE is used in AME diagnosis, it varies
between men and women at 8-11 years old.
4.3. Characteristics of urinary steroids in patients with CAH,
DSD
Application of GC-MS urinary steroid quantification in diagnosis
of CAH and DSD for 200 patients shows that 106 patients found with
21-OH deficiency, 5 patients with 11β-OH deficiency, 14 patients