Nghiên cứu sự biến đổi nồng độ cortisol máu, chức năng tiết cortisol của tuyến thượng thận ở bệnh nhân viêm khớp dạng thấp tt tiếng anh
Bạn đang xem bản rút gọn của tài liệu. Xem và tải ngay bản đầy đủ của tài liệu tại đây (266.26 KB, 24 trang )
1
INTRODUCTION
1. The necessity of thesis
Rheumatoid arthritis (rheumatoid arthritis) is a typical systemic
autoimmune disease, with chronic inflammatory manifestations in
many peripheral joints, accompanied by extracellular and systemic
manifestations of varying degrees, complex movements. trash has
serious consequences.
In patients with rheumatoid arthritis, chronic inflammation causes
internal changes to affect the function of endocrine glands, including
the hypothalamic-pituitary-adrenal axis (hypothalamo -pituritinadrenal, HPA). Patients with rheumatoid arthritis often use long-term
glucocorticosteroids (GC) to treat the disease, which also contributes
to the decline of HPA axis activity.
In the world, there are many studies in-depth about the mechanism of
immune disorders, hormonal, cellular and humoral changes, related
to the clinical manifestations, progress and treatment response of the
rheumatoid arthritis disease. In Vietnam, no research has focused on
the change of cortisol and related hormone levels and the
pathophysiological mechanisms of interactions between endogenous
anti-inflammatory hormones of patients with the stage and level of
disease activity of rheumatoid arthritis. We found that the study of
day-to-day changes in hormone levels of cortisol and hormones that
stimulate it is ACTH in patients with rheumatoid arthritis may shed
some light on the physiological mechanism of pathology of
interactions between gland functions Endocrine and activity levels of
rheumatoid arthritis. From there, we can apply more effective
approaches to treating rheumatoid arthritis in our country. The topic
"Study on changes in blood Cortisol concentration, cortisol function
of adrenal gland in patients with rheumatoid arthritis" is conducted
with the following two objectives:
1. Survey of cortisol, ACTH, cortisol / ACTH blood ratio in
rheumatoid arthritis patients.
2
2. Analysis of the relationship between cortisol, ACTH, cortisol /
ACTH blood ratio with disease activity and disease stage in
rheumatoid arthritis patients.
*Scientific significance
Quantifying ACTH, cortisol partially reflects the HPA axis activity
with inflammatory response, finding an association between
inflammation in rheumatoid arthritis and HPA axis dysfunction,
according to the level of disease activity advanced stage of
rheumatoid disease
*Practical significance
-ACTH, Cortisol levels at 8 and 23 hours in the GC group had a
lower median value than the non-GC and control groups.
-There is a moderate correlation (r = 0.41; r = 0.34) between ACTH
and cortisol blood levels in both non-GC groups, using GC and the
relationship between blood cortisol / ACTH ratio. with the level of
disease activity and the stage of rheumatoid arthritis. Only
multivariate correlation between concentration of Cortisol 8 hours
and serum CRP concentration with p <0.001
-ROC curve with cutting point of blood Cortisol concentration at 8h
35.5ng / ml is valid for diagnosis of patients using GC
2. New contributions of this doctoral thesis
1. The determination of ACTH and cortisol in plasma is 2 of 9
functions that assess the adrenal glands. Quantifying ACTH at the
same time as Cortisol and quantifying ACTH and cortisol levels at
8am and 23h is the nocturnal rhythm of the adrenal gland.
2. Determine the ratio of Cortisol / ACTH, one of the factors
assessing adrenal response to ACTH stimulation. This is an indirect
ratio used to assess adrenal response to ACTH with the ability to
meet the theoretical basis for the synacthen test.
3. The doctoral thesis arrangement: This thesis contains 122 pages
(without references and appendixes): Introduction: 02 pages, Chapter
1 Overview: 32 pages, Chapter 2 Subjects and methods: 14 pages,
Chapter 3 Results: 29 pages, Chapter 4 Discussion: 42 pages,
Conclusion: 02 pages, Recommendations: 01 page. It includes 30
3
tables, 12 graphs, 5 figures, 1 diagram and 135 references(15
Vietnamese references and 133 English references).
CHAPTER 1. OVERVIEW
1.1. Overview of rheumatoid arthritis
1.1.1. Concept of disease
Rheumatoid arthritis is a typical autoimmune disease, chronic
progression with joint and systemic manifestations at different levels.
1.1.2. Epidemiology
Rheumatoid arthritis occur in all countries of the world. Vietnam has
a common morbidity rate of 0.5% of the adult population, more
women than men with a rate of 2-3 / 1.
1.1.3. Causes and mechanisms of pathogenesis
**Causes: the disease is not clear, people consider rheumatoid
arthritis to be a disease that has the same mechanism of action
through the mechanism of immune response disorder
**Mechanisms of pathogenesis: the onset of the disease is thought
to begin with T-CD4 + that identify strange antigens that have
inflammatory properties. Antigenic identification leads to activation
of a series of immune response reactions in which stimulation of B
lymphocytes will produce autoantibodies (RF, anti CCP ...),
stimulation of monocytes phagocytes produce a series of
inflammatory cytokines (TNF-α, IL-1, IL-6) that stimulate the
synovial membrane cells, fibroblasts, and cartilage cells ...T
lymphocytes release cytokines activation of capillary endothelial
cells synovial membrane produces adhesion molecules, attracting
inflammatory cells to the joint cavity. The consequence of these
processes is the formation of a chorionic membrane in the synovial
membrane (pannus), invading the cartilage, causing cartilage and
bone cartilage destruction, causing joint disruption, leading to
stickiness, stiffness and The role of HPA axis also contributes equally
important to the adjustment and control of the HPA axial immune
response and dysfunction associated with the pathogenesis of
rheumatoid arthritis.
1.1.4. Clinical symptoms
4
** Clinical symptom: signs of morning stiffness, pain in many joints
of symmetry in hands, feet, wrists, ankles, elbows, knees, shoulders,
groin. Late stages may have deformations in the hands and feet.
External manifestations of joint damage to the heart, pulmonary
fibrosis, chronic anemia, low grain under the skin.
** Subclinical symptoms: Rate of blood sedimentation, reactive C
protein (CRP), rheumatoid factor RF (+) at 70%, anti-CCP, hand
radiograph, ultrasound, magnetic resonance imaging joint
1.1.5. Diagnosis of rheumatoid arthritis
Diagnosis of rheumatology is based on ACR 1987. Recently, ACR /
EULAR 2010 standards have been used to early diagnose rheumatoid
arthritis.
1.1.6. Treatment
Coordinate non-drug measures and medications including NSAIDs
and Glucocorticoid (GC). Basic drugs for treatment of classic
DMARDs and the use of biological drugs DMARDs
1.2. A number of studies on cortisol and ACTH concentrations in
patients with rheumatoid arthritis
1.2.1. Research in the country
Tran Quang Nam et al 2011 studied 101 patients including many
diseases including rheumatoid arthritis. Luu Thi Binh et al (2016)
Study on rheumatoid patients, found a proportion of 37.5%
adrenocortical insufficiency due to GC use with Cortisol
concentration <3 μg / dL
1.2.2. Study abroad
Gudbjornsson B et al (1996) The ratio of cortisol / ACTH hormones
in patients with rheumatoid arthritis at the group is not treated with
GC was significantly lower than that in the control group. Ehrhart
BM et al (1998) increased cortisol / ACTH ratio due to inadequate
regulatory interaction of the hypothalamic and adrenal pituitary axis.
Straub et al (2002) The morning serum Cortisol levels were
significantly higher in the non-GC group compared to healthy
subjects, but there was no difference between ACTH levels and the
control group. Kirwan et al (2006) measured the effect of low-dose
5
GC treatment. The HPA axis response remains within the normal
range. Straub et al (2008) were not treated with GC, the improvement
in DAS28 was inversely correlated with blood cortisol concentration
(R = -0.52; P = 0.011) and cortisol: ACTH ratio (R = - 0, 7; P =
0.0002). Lee MK et al (2013), patients with primary adrenal
insufficiency all had cortisol / ACTH ratio <3. Li et al (2018) use the
ratio of Cortisol / ACTH to assess the function of adrenal cortex in
patients with excretion of Cortisol
CHAPTER 2. SUBJECTS AND METHODS
2.1. Subjects
140 patients with rheumatoid arthritis and control group of 60
patients without rheumatoid arthritis, treated at Department of
osteoarthritis Cho Ray hospitals from 4/2014 - 9/2015.
2.1.1. Criteria for selecting patients into research groups
- Diagnosed with rheumatoid arthritis according to the standard of
ACR 1987
- Rheumatoid arthritis in non-GC group (using common antiinflammatory, analgesic (paracetamol, NSAIDs, using GC equivalent
of prednisone 5 mg / day in short, intermittent <1 month)
- Rheumatoid disease in the GC group (Prednisone, prednisolone,
methylprednisolone, hydrocortisone), equivalent to prednisone 20 mg
/ day, duration of continuous use lasts> 1 month
- Accepting participation in research.
2.1.2. Criteria for selecting patients into control groups
The disease does not suffer from rheumatoid arthritis: there are
common conditions such as osteoarthritis, chronic lumbar pain
syndrome. Similarities in age and gender with rheumatoid diseases.
2.1.3. Standards exclude the research group
- Subjects do not agree to participate in the study.
- Patients with other chronic chronic diseases: heart failure, chronic
bronchopulmonary disease, unstable hypertension, hepatitis,
cirrhosis, alcoholism, Basedow, reactive arthritis, chronic renal
failure , chronic gout, diabetes, systemic lupus erythematosus ...
6
-Trauma, surgery within 1 recent month, with surgical diseases,
malignancy, pituitary adenoma, adrenal adenoma
2.1.4. Standards exclude the control group
- Being infected with rheumatoid arthritis has been using GC
-There are other chronic chronic diseases: heart failure, chronic
bronchopulmonary disease, unstable hypertension, hepatitis,
cirrhosis, alcoholism, Basedow, reactive arthritis, pituitary adenoma,
adrenal adenoma
2.2. Research Methods
2.2.1. research design
- Research method: research, descriptive cross-section, control group
comparison.
- Sample size: convenient selection, patients diagnosed with
rheumatoid arthritis
2.2.2. Steps to conduct research
- Clinical examination of patients according to a uniform medical
record, routine laboratory tests, instructions and interviews with the
patient to fill in the questionnaire. Data collection and data
processing according to statistical algorithms.
2.3. research content
2.3.1. Clinical examination and laboratory tests
- Exploiting history of history:
+ Age, gender, occupation, time of disease detection, factors related
to smoking, obesity ... time of GC drug treatment?
+ General examination of patients' condition: Pulse, blood pressure,
height, weight, BMI, abdominal measurement, time of morning
stiffness, joint deformation?
+ Cardiovascular examination, respiratory, digestive, urological,
endocrine examination ...
+ Large number of joints, small joints (according to EULAR / ACR
2010)
+ Assess the pain situation through the scale of pain VAS, DAS 28ESR disease activity point
Laboratory tests:
7
+ Peripheral blood cells, erythrocyte sedimentation rate-ESR,
Reactive protein C (CRP), Urea blood, Blood creatinine
+ Rheumatoid factor (RF) uses immunological measurement of
opacity and antibody CCP- Anti CCP using ELISA measurement
method
+ Quantitative blood cortisol 8h and 23h by Hitachi machine of
Roche-cobac 6000, model 727-0189, by method of luminescence.
+ ACTH quantification 8h and 23h by Hitachi machine of Roche
cobac 6000, model 727-0189, with luminescent sandwich
immunization
Process of sampling cortisol, ACTH
Patients were given blood samples to measure cortisol levels, ACTH
should ensure that no exogenous glucocorticosteroid is used. When
measuring cortisol to be sure cortisol is measured by the adrenal
cortex. Patients need to discontinue glucocorticosteroids within 2448h before measuring blood cortisol. The patient and family member
should explain the purpose of the test. Patients need to coordinate to
take blood according to the time and quantity requirements. Blood
samples were taken by Osteoarthritis Nursing at 8:00-9:00am at the
same time as other basic routine tests and followed by a blood sample
of Cortisol and ACTH measurements at 22:00 - 23:00. Heterosexual
blood samples are kept in ice containers to the Cho Ray Hospital
Biochemistry Department within 05 minutes after taking blood.
+ Conventional x-ray of neck joints - hands on both sides straight
+ Cardiopulmonary X-ray, electrocardiography, general abdominal
ultrasound
2.3.2. Standards used in research
- Diagnostic criteria for rheumatoid arthritis according to ACR 1987
- Diagnosis of rheumatism disease stage according to Steinbroker
- Evaluate the extent of X-ray damage according to Steinbroker
- Evaluate disease activity points DAS28-ESR
- Diagnosis of anemia according to WHO 2011 standards
- Assessment of adrenal cortex function: Based on clinical standards
and some laboratory tests.
8
- Test indicators according to prescribed standards and tests at the
Department of Biochemistry of Cho Ray Hospital (Hospital under the
Ministry of Health)
2.3.3. Data processing
- The collected data is processed by SPSS 18.0 software
- Quantitative variables without normal distribution are presented in
the median form (quarter-quartile Q1-Q3). Variable denoted (*)
2.3.4. Ethical issues in research
-The thesis is reviewed and approved by the Science and Medical
Council of Cho Ray Hospital before implementation.
- Patients was fully explained and voluntarily participated in the
study
Research diagram
Research subjects
Researchers
140 patients with rheumatoid
arthritis
- 70 patients do not use GC
- 70 patients use GC-
Control group
60 patients Without rheumatoid
arthritis
Do not use GC
Objectives 1: Survey of cortisol,
ACTH, cortisol / ACTH blood
ratio in rheumatoid arthritis
patients.
Objectives 1: Analysis of the
relationship between cortisol, ACTH,
cortisol / ACTH blood ratio with disease
activity and disease stage in patients
with rheumatoid arthritis.
CONCLUSION
Recommendation
9
CHAPTER III:
RESEARCH RESULTS
3.1. Characteristics of rheumatoid arthritis patients
3.1.1. General characteristics of the research object
Table 3.1.Age and gender characteristics of the research group
of both groups
control group
p
Gender, age
n=140
n=60
amount
ratio % amount
ratio %
Male
20
14,3
28
46,7
<0,001
female
120
85,7
32
53,3
≤39
16
11,4
14
23,3
40-49
31
22,1
11
18,3
50-59
48
34,3
9
15,0
<0,05
≥60
45
32,1
26
43,3
The
53,49 ± 12,2
53,± 19,02
average age
20-84
15-84
Women account for 85.7%, the rate of female / male is approximately
6/1 higher than in the control group. The average age of the two
groups is similar.
Graphs 3.1. The clinical symptoms associated with the history of the
disease accounted for the highest proportion of 49.3% infection,
2.1% injury
Table 3.2 and Table 3.3. The group that did not use GC had the
abdominal ring male 74.50 ± 11.29cm; Female text 79.62 ± 13.45cm;
abdominal fat (AF) male 8.3%; BB female 43.1%; BMI 22.24 ± 3.61
kg / m² is lower than GC and control group.Except abdominal ring,
male abdominal fat, with P1,2 <0,05, in the GC group, there is a male
text higher than the female text, AF male 50%; BMI 22.52 ± 3.65 kg /
m², except for female AF 45.2% lower. The level of hypertension of
study group was lower in the control group, with P> 0.05
Table (3.4; 3.5; 3.6; 3.7). The time of detection of disease from 1-10
years accounted for the highest rate of 68.6%, an average of 3.87 ±
2.72 years. The number of swollen joints is 9.71 ± 3.95. Number of
painful joints 11.55 ± 2.97. VAS 57.75 ± 9.04 mm, morning stiffness
10
66.18 ± 9.49minutes. The white blood cell group increased by 32.9%,
red blood cells decreased by 41.1% and Hb decreased by 74.3%.
Mild anemia was highest at 73.6% compared to 70% of NC, with P
<0.05
Graphs 3.2 and 3.3. There is anemia of 87.1%, according to the stage
of disease in both groups is the highest in Phase I (79.7%), the lowest
in Phase IV (0.7%).
Tables (3.8; 3.9 and 3.10). RF rates (-) 27.4%, RF (+) 72.6% and the
rate of anti-CCP (-) 41.1%, anti-CCP (+) 58.9%. The 1 hour ESR is
57.53 ± 40.62, the 1-hour ESR rate increases by 78.6%, the DAS28ESR disease activity is 98.4%, DAS28-ESR is 5.30 ± 1.06
Graphs (3.4; 3.5).DAS28-ESR rate of disease activity is 66.4%. In
the non-GC group, ACTH levels were 8 hours <8.92 pg / ml; ACTH
23h <4.15 pg / ml is lower than the GC group, higher than control
group. In contrast, ACTH 8 hours: 8.92-22.88 pg / ml and ACTH 8
hours> 22.88pg / ml higher than the GC group, lower than control
group and ACTH levels 23h: 4.15-12.03 pg / ml; ACTH 23h> 12.03
pg / ml is higher than the GC group, lower than control group.
3.2. Concentrations of cortisol, ACTH, cortisol / ACTH ratio in
patients with rheumatoid arthritis
Table 3.11. Blood levels of ACTH and Cortisol were 8 hours and 23
hours of the study groups
Ch ar act e
r i st ic s
Non-GC
users (1)
(n=70)
(±
SD;median
; IQR)
GC users
(2)
(n=70)
( ± SD;
median;
IQR)
A CTH 8h
(p g/ m L)
18,44± 21 ,08
13,25
(6,09- 20,7 4) *
8 ,34± 10,56
4 ,89
(2,24- 8,7 4) *
control
group (3)
(n=60)
( ± SD;
median;
IQR)
19,39± 15 ,2
14 ,55
(8,92- 22,88)
P
p1,2<0.001
p1,3 >0,05
p2,3<0,001
11
AC TH
23h
(p g/ m L)
Cort i sol
8h
(ng/ ml )
Cort i sol
23h
(ng/ ml )
9,24± 10 ,11
5,63
(3 ,7 5- 9 ,7 4) *
7 8,06± 65 ,27
67 ,94
(35 ,7 9- 91,7 0)
26,94± 32 ,50
17 ,18
(10 ,87- 29 ,51) *
5 ,17 ± 6 ,99
3 ,39
(1,6- 5,89) *
25 ,50± 43,89
14 ,65
(10,05- 22,17 )
17 ,95± 20,19
13 ,51
(8 ,81- 21,8 0)
11 ,7 1± 20 ,14
6 ,54
(4,15- 12 ,03) *
67 ,90± 43 ,21
60,03
(37 ,7 9- 93,94)
34 ,28± 34,96
23 ,28
(13,44- 40 ,59) *
p1,2<0,05
p1,3 >0,05
p2,3<0.05
p1,2<0.001
p1,3 >0,05
p2,3<0,001
p1,2<0,05
p1,3 >0,05
p2,3<0,05
(*) Variables are presented as medians (IQR-quartet)
ACTH concentration 8h, 23h; Cortisol 8h, 23h in the group that did
not use GC by median value was higher than that in the GC and
lower than control group group, with p1,2 <0.001; p1,2 <0.05. Except
for 8 hours cortisol was 67.94 ng / ml higher than control group 60.03
ng / ml, with p1.3> 0.05.
The concentration of ACTH 8h, 23h, Cortisol 8h, 23h in the group
using GC according to GTTV is lower than that of the study, p2,3
<0,001, p2,3 <0,05.
Table (3.12; 3.13). The concentration of cortisol 8 hours: in the nonGC group in men, median was higher than female, with p1 <0.05;
Normal waist circumference (WC) has higher median than WC
increased; BMI ≥23 is lower than BMI <23. GC group in men has
lower median than female; Normal WC has lower median than WC
increased; BMI ≥23 is higher than BMI <23. The cortisol
concentration of 23 h: the non-GC group in men had the same results
as the cortisol 8 hours, the GC group in men had median higher than
the female; except BMI ≥23 higher than BMI <23.
Table (3.14; 3.15; 3.16). The longer the detection time, the cortisol
concentration is 8 hours, 23 hours in the research group with median
decreased, with (P1 <0.05; P2 <0.05).The cortisol concentration of 8
h, 23 h in the GC group using, median was lower than that of the
non-GC group, with (p1 <0.001; p2 <0.05). The longer the detection
time, the more ACTH concentrations are 8 hours, 23 hours, cortisol 8
hours, 23 hours in both groups with median decreases, with (P1>
0.05; P2> 0.05)
12
Table 3.17. Reference value of ACTH concentration, Cortisol at
lower quartile threshold, upper quartile of control group
ACTH concentration
Four quartiles Four quart iles
(pg/mL), Cortisol
below
above
(ng/ml)
ACTH 8h
8,92
22,88
ACTH 23h
4,15
12,03
Cortisol 8h
37,79
93,94
Cortisol 23h
13,44
40,59
ACTH concentrations 8h, 23h, Cortisol 8h, 23h: smaller than the
lower quartile is considered to reduce secretion; Higher than the
above quartile is considered to increase secretion. In the interval
between the lower quartile and the upper quartile see as normal.
Table 3.18. The average ratio of Cortisol / ACTH concentrations at
8:00, 23:00 in the study groups
Ra ti o:
Cort i sol /A C TH
(nmol / pmol )
Non-GC
users (1)
(n=70)
(±
SD;median;
IQR)
123,81± 260 ,46
48,6 (28,21124,91 ) *
71,31± 139 ,45
37 ,5 (19,8678,51 ) *
GC users (2)
(n=70)
( ± SD;
median; IQR)
62,67 ± 65,59
39 ,14(18 ,97 8,7 2) *
71,82± 60 ,85
51,48 (27 ,5298 ,91)
control
group (3)
(n=60)
( ± SD;
median;
IQR)
58 ,08 ± 45 ,85
41 ,7 5(24 ,8580,48 )
69 ,7 1 ± 82 ,06
45 ,67 (20 ,8178,55 ) *
(*) Variables are presented as medians (IQR-quartet)
This Cortisol / ACTH ratio is presented in units of nmol / pmol
8-hour Cortisol / ACTH ratio: Non GC users group with median
higher than the GC users and control group. In contrast, GC users
group lower than control group and the ratio of blood Cortisol /
P
>0,05
>0,05
13
ACTH of 23h group without GC with median was lower than GC
users and control group, with p> 0.05.
Table 3.19. Reference value of Cortisol / ACTH ratio at lower
quartile threshold, upper quartile of control group
Four
Four quart iles
Ratio: Cortisol/ACTH
quartiles
above
(nmol/pmol)
below
24,85
80,48
20,80
78,55
(*) Variables are presented as medians (IQR-quartet)
The ratio of Cortisol / ACTH 8h, 23h smaller than the lower quartile
is considered reduced; Higher than the above quartile is considered
an increase. in the interval between the lower quartile and the quartile
above is considered normal.
Figures 3.7 and 3.8. The ratio of blood levels of Cortisol / ACTH of 8
hours <24.85 of the GC group was higher than that of the non-GC
and control group, the ratio of blood Cortisol / ACTH 8h: 24.8580.48: both groups were lower than control group. In the non-GC
group, the ratio of blood levels of Cortisol / ACTH at 8 hours> 80.48
and Cortisol / ACTH at 23h> 78.55 was higher than in the control
and GC groups and the ratio of Cortisol / ACTH 23h <20.80 was
lower than the GC group and NC; The ratio of Cortisol / ACTH at
23h: 20.80-78.55 is higher than that of GC and control group
equivalents.
Table.3.20. Multivariate correlation between Cortisol
concentration at 8am with CRP, anti-CCP, RF,DAS28-ESR and VAS
Independent variables
Constant = 17,72
CRP
Anti-CCP
RF
DAS28-ESR
Beta
coefficient
0,38
0,14
0,075
0,062
Value-p
0,711
<0,001
>0,05
>0,05
>0,05
14
VAS
-0,059
>0,05
Multivariate correlation between Cortisol concentration at 8am and
some indicators of rheumatoid disease showed that only serum CRP
concentration was statistically significant with p <0.001.
Table 3.21. Multivariate correlation between ACTH concentration at
8 o'clock with some indicators of rheumatoid disease showed only
serum CRP concentration, with (p <0.001, p <0.05).
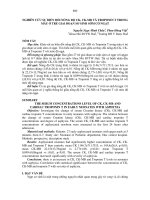
Graphs 3.9: Graph of ROC curve of blood cortisol concentration
at 8pm for patients with rheumatoid disease using GC
The cut-off point of blood Cortisol concentration at 8am ≤35.5ng / ml
has a diagnostic value of BN using GC with sensitivity: 77.1%;
specificity: 91.4%; The value of 35.5 ng / ml is the most optimal
cutting point compared to other cutting points. The area under the
curve (AUC) is 0.828 with p <0.001.
Cortisol _8h
300.00
200.00
100.00
f(x) = 1.37x + 45.88
R² = 0.17
0.00
0.00 20.00 40.00 60.00 80.00
ACHT_8h
15
Graphs 3.11: Interrelation between ACTH concentration 8 hours
and cortisol concentration of 8 hours in the group without
corticosteroids
There is a positive correlation between ACTH concentration 8 h and
cortisol concentration of 8 h in the non-GC group, with r = 0.41; p
<0.001
Graphs (3.10; 3.12). With a cut-off point of blood ACTH
concentration of 8 h ≤10.0 pg / ml, the diagnostic value of the patient
was used GC and positive correlation between ACTH concentrations
of 8 h and cortisol 8 h in the group with GC, with r = 0.34; p <0.005
Table (3.22; 3.23; 3.24). Multivariate correlation between Cortisol /
ACTH ratio 8 hours with some indicators of rheumatoid disease
showed that no index was statistically significant. ACTH
concentration 8 hours: in the non-GC group, median 16.78pg / ml is
higher than the average of 11 pg / ml and 3.7pg / ml. In the GC group
with strong activity level, median was higher than that of patients
with moderate and mild activity level. ACTH concentration 23h: both
groups have similar meaning to ACTH concentration at 8 hours, with
p2> 0.05.
Table 3.25. The 8-hour cortisol concentration of the study group
with the level of disease activity
Non-GC users (1)
GC users (2)
(n=59)
(n=66)
Disease activity
level
( ± SD;median; IQR)
( ± SD; median;
(ng/ml)
IQR)
(ng/ml)
Mild
25,39 ± 8,18
72,93 ± 132,22
(2,6-<3,2)
24,81 (9,17-46,52)
20,51 (2,94-309) *
DAS 28
ESR
p
Moderate
(3,2-5,1)
47,95±34,34
45,59(14,09-69,76)
15,29 ± 9,19
14,81 (3,17-36,54)
Strong
(>5,1)
100,35±74,6
72,93(46,87-133,75)
25,49 ± 36,64
14,78 (5,93-166) *
p1> 0,05
p2> 0,05
16
(*) Variables are presented as medians (IQR-quartet)
The concentration of Cortisol 8 hours: in the Non-GC users with
strong activity level, the higher the average value compared to
patients with moderate and mild activity level, GC users with strong
activity level, median was the lower than compared to patients with
moderate and mild activity level, with p1,2> 0.05.
Table 3.26. The higher concentration of Cortisol 23h in both groups,
the higher the GTTV content compared to moderate and light SBB.
Table 3.26. The concentration of Cortisol 23h in both groups with
strong activity level, median was the higher median is compared with
moderate and mild activity level.
Table 3.27. The cortisol / ACTH concentration ratio 8h, 23h of
the study group with disease activity level
Ratio: cortisol/ACTH
(nmoL/pmoL)
DAS 28ESR
Disease activity level
Non-GC users (1)
(n=59)
( ± SD;median;
IQR)
72,79±100,09
32,04(22,4880,86)
158,03±332,82
Strong
49,58(34-162,25)
(>5,1)
*
p
p1>0,05
42,46±37,86
Moderate
29,57 (12,15(3,2-5,1)
90,09)
90,88±180,56
Strong
42,26(24,45(>5,1)
91,22) *
p
p1>0,05
(*) Variables are presented as medians (IQR-quartet)
Moderate
(3,2-5,1)
GC users (2)
(n=66)
( ± SD;
median; IQR)
50,49±48,72
28,59(20,8862,78)
61,73±68,91
39,38(18,7677,28) *
p2>0,05
63,98± 41
52,72(42,1081,75)
78,54±68,11
54,36(27,26116,4)
p2>0,05
17
This Cortisol / ACTH ratio is presented in units of nmol / pmol
The concentration of Cortisol / ACTH 8h, 23h in a group that does
not use GC and the GC group with a high level of disease activity, the
ratio of Cortisol / ACTH has a median value higher than the level of
moderate disease activity; There was no statistical significance with
(p1> 0.05, p2> 0.05).
Table 3.28 and table 3.29. ACTH concentration 8 hours, 23 hours in
the group without GC had increased median according to the disease
stage. In contrast, the ACTH concentration of 8 h, 23 h in the GC
group had a decreased median according to the disease stage, with
p2> 0.05. Cortisol levels of 8 hours, 23 hours in both groups had a
decrease in median according to the disease stage.
Table 3.30 The ratios of Cortisol / ACTH 8 hours, 23h of the
study groups according to the stage of disease
Ratio:
Cortisol/ACTH
(nmol/pmol)
Injury
matches
Steinbroke
r
stage 1
stage 2
stage 3-4
p
stage 1
Non-GC
users (1)
(n=70)
(±
SD;median;
IQR)
GC users (2)
(n=70)
( ± SD;
median; IQR)
129,57± 283,05
49,25 (27,54134,64) *
115,14±144,59
47,95 (30,03180,94) *
53,14±62,54
31,71(4,1377,65)*
p1>0,05
75,44±153,25
39,43 (18,33-
60,53±67,81
38,77 (19,6975,25)*
48,79±55,58
18,81(8,9883,74)*
94,86±59,68
69,45(47,46153,80)
p2>0,05
69,96±56,62
51,36(27,62-
18
82,36)*
107,84)
50,99±42,32
64,59±76,09
stage 2
35,93 (24,5937,19(12,9678,16)
88,82)*
56,65±58,40
90,12±80,09
stage 3-4
32,96 (8,7963,02(35,8880,58)*
167,65 )
p
p1>0,05
p2>0,05
(*) Variables are presented as medians (IQR-quartet)
This Cortisol / ACTH ratio is presented in units of nmol / pmol
Cortisol / ACTH ratio 8h, 23h: in the non-GC group, median
decreased gradually according to the disease stage, with p1> 0.05, in
the GC group with median at Stage 1 and 2 lower than Stage 34,however with p2> 0.05.
CHAPTER IV:
DISCUSSION
4.1. General features
Gender, age: female accounts for 85.7%; male accounted for 14.3%,
age <60 accounted for 67.9%; > 60 years old 32.1%, age of medium
53.49 ± 12.2. Our results are also consistent with the results of other
studies
Disease detection time 3.87 ± 2.72 years, the number of swollen
joints 9.71 ± 3.95; number of painful joints 11.55 ± 2.97, duration of
morning stiffness 66.18 ± 9.49 minutes, pain level VAS (mm) 57.75 ±
9.04 mm. Compared with Imran M.Y et al (2015) number of swollen
joints 2.6 ± 3.18; Pain joint number 4.54 ± 4.35
The rate of anemia is 87.1%, the first time ESR: 57.53 ± 40.62 mm;
RF (+) accounted for 72.6%. Osteoarthritis of stage I occupies the
highest 79.7%. According to Isik A et al (2007) RF (+) 84.1%, ESR:
42.5 ± 26.9mm. Imran M. Y et al (2015) RF (+) 100%.
* Results DAS 28 - ESR: 5,30 ± 1,06, strong activity level accounts
for 66.4%; moderate is 31.2%; mild 2.4%. According to Son K.M et
al (2011), Tran Thi Minh Hoa (2011) similar results
19
4.2. Concentrations of cortisol, ACTH, cortisol / ACTH ratio in
patients with rheumatoid arthritis
4.2.1. Compare blood levels of ACTH and Cortisol 8h and 23h
between study groups
Cortisol levels of 8 hours, 23 hours in the group did not use GC
according to median respectively: (67.94, 17.18) ng / ml higher than
the GC group (14.65, 13.51) ng / ml and lower than control group
( 60.03, 23.28) ng / ml. Except for cortisol 8h, there is median with
67.94 ng / ml, higher than control group 60.03ng / ml, with p1,3>
0,05. According to Kanik et al (2000), Mirone L et al (1996); and
Straub et al (2002) our results are lower. Cortisol concentrations 8 h,
23h in the GC group using median respectively (14.65; 13.51) ng / ml
were lower than those of median in turn (60.03; 23.28) ng / ml. Luu
Thi Binh (2016), Tran Quang Nam (2014) and even Kirwan et al
(2006) our results are lower.
ACTH concentrations at 8 o'clock in the non-GC group, according to
median 13.25pg / ml lower than control group 14.55 pg / ml and
ACTH concentrations at 23h are lower than control group. Our
results are similar to Kanik et al (2000); Zoli A et al (2002) and
Lower Straub et al (2002). The ACTH concentration was 8h, 23 h in
the GC group using median lower than the non-GC group. According
to Gudbjornsson B et al (1996), the results are similar to ours.
The cortisol 8h concentration in the non-GC group at male 124.24 ±
88.79 ng / ml was higher than the female 68.51 ± 55.62 ng / ml. In
the GC group at male the median 13.74 ng / ml lower than female
14.95 ng / ml. Normal WC was lower median than WC increase. The
cortisol concentration of 23 h in the non-GC group in male had
median 23.05 ng / ml, which was higher than female 16.97 ng / ml.
According to Zoli A et al (2002) the results differ from ours, so
compare some other authors
The concentration of cortisol 8h in the GC group ≥ 1 month median
14.78 ng / ml is lower than the group without GC 69.76 ng / ml,
similar to the result of cortisol 23h concentration. According to
20
Kirwan et al (2006) there are some similarities with us. Luu Thi Binh
(2016) has the opposite result.
The concentration of ACTH 8h in the group that did not use GC
under disease detection time (DDT) <1 year had median 17.98 pg /
ml higher than DDT ≥ 1 year, 11.14 pg / ml, similar to ACTH
concentration results 23h. Cortisol concentrations of 8 hours in the
group that did not use GC under DDT <1 year 78.20 ± 63.64 ng / ml
were higher than DDT > 1 year 77.95 ± 67.46 ng / ml, similar to
Cortisol 23h results. According to Straub et al (2002) and Kanik et al
(2000), the results are similar to ours. Cortisol concentration of 8
hours in the group with GC using DDT <1 year has higher median
than DDT > 1 year, similar to the concentration concentration of
Cortisol 23h.
ACTH 8h concentration<8.92 pg / ml in GC group accounted for the
highest proportion of 77.1% compared with no GC 32.9% and
control group 25%. The concentration of cortisol 8h<37.79 ng / ml in
the GC group accounted for the highest proportion of 92.9%
compared with the group without GC 27.1% and control group 25%,
with p2,1 <0.001; p2,3 <0.001 higher than Tran Quang Nam (2014)
71% and Luu Thi Binh (2016) 37.5%.
4.2.2. Average ratio of Cortisol / ACTH at 8h, 23h in the study
groups
The ratio Cortisol / ACTH at 8h in the non-GC group with median
48.6 nmol / pmol was higher than that of GC 39,14nmol / pmol and
control group 41.75nmol / pmol. According to Woo YS et al (2005)
and Machado MC (2016), the results are similar to ours. According to
Lee MK et al (2013), IQR application is like us. The ratio of blood
levels of Cortisol / ACTH 8h<24.85 in the group that did not use GC
under lower IQR accounted for 20% lower than the group using GC
31.4% and control group 25%. The ratio of Cortisol / ACTH at 23h
<20.80 in the group without GCR IQ less than 24.3% was lower than
the group with GC 32.9% and 25% control group. Similar results
compared to 8 h of Cortisol / ACTH blood
21
4.2.3 Multivariate correlation between concentration of Cortisol,
ACTH and Cortisol / ACTH ratio at 8pm with CRP, anti-CCP,
RF, DAS28-ESR and VAS
There was a positive correlation between ACTH concentration 8h and
cortisol concentration of 8h in the group without GC and the group
had GC in r = 0.41, r = 0.34 with (p <0.001, p <0.005). According to
Kanik et al (2000), Erturk et al (1998), the results are similar to ours.
Multivariate correlation between Cortisol and ACTH concentrations
at 8h with some indicators, only serum CRP was significant for p
<0.001 According to Gudbjornsson B et al (1996) the results were
similar. With the cut-off point of blood Cortisol concentration of 8h
≤35.5ng / ml, the diagnostic value of patient was used GC as the best
cutting point compared to other cutting points. According to Erturk et
al (1998), Tran Quang Nam (2014 ) the cutoff threshold of cortisol is
different from ours.
4.3. Relationship between cortisol, ACTH levels, cortisol / ACTH
ratio with disease activity, rheumatism
4.3.1. ACTH, cortisol, cortisol / ACTH ratios in the study groups
with the degree of disease activity
ACTH concentration of 8h in the group that did not use GC with
strong disease activity, median 16.78 pg / ml, higher than the average
disease activity 11.0 pg / ml and mild 3.71 pg / ml, similar to the
concentration of ACTH 8h group GC. ACTH concentration 23 h in
the group that did not use GC with strong disease activity 6.19 pg /
ml, higher than the average disease activity 5.93 pg / ml and mild
3.81 pg / ml. According to Carlesso L.C et al (2016), Straub and et al.
2008 evaluated the land consolidation according to DAS28, which
will further clarify our research.
The concentration of Cortisol 8h group did not use GC with strong
disease activity 72.93 ng / ml, higher than average disease activity
45.59 ng / ml and mild 24.81 ng / ml. In the group using GC with
strong disease activity, median is lower than medium and mild.
According to Luu Thi Binh (2016), there is the opposite result
Cortisol 23h concentration in both groups with strong disease activity
22
higher than moderate and mild. In the group, do not use GC Cortisol /
ACTH ratio 8h, 23h with moderate disease activity lower levels of
strong disease activity. In the GC group with moderate disease
activity, the ratio of Cortisol / ACTH 8 hours with median 28.59
nmol / pmol is lower than the 39,38 nmol / pmol strong disease
activity, with moderate disease activity Cortisol / ACTH 23h with
lower median than the with strong disease activity. According to
Zautra AJ et al (1994), Straub et al (2008) similar results to us
4.3.2. The relationship between ACTH concentrations, cortisol,
cortisol / ACTH ratios in the study groups with the lesion phase
according to Steinbroker
The ACTH 8h concentration without GC in GĐ1, 2 with the median
order (12.81; 14.24) pg / ml lower than GĐ3-4 was 18.03 pg / ml,
and ACTH concentration 23h at Stage 1, 2 have median lower than
Stage 3-4. In the group with GC levels of ACTH at 8 hours in Stage 1
and 2, there was a decrease in median according to Stage and ACTH
concentration at 23 h in Stage 1, with GTTV higher than Stage 3-4.
According to Yousri NA and et al. 2017, Pincus T et al. Cutolo M and
cs (2018), the results are similar to ours. Cortisol concentration of 8h,
23h in the group that did not use GC in GĐ1, 2 had median decreased
gradually. In the group with GC concentration of Cortisol 8h, 23h,
the median decreased gradually according to the Stage. According to
Cutolo M et al (2018), Buttgereit F et al (2011), the results are similar
to ours. Cortisol / ACTH ratio 8h, 23h in the group without GC with
median decreased gradually according to Stage. In the GC group, the
ratio of Cortisol / ACTH 8 hours in Stage 1, 2, with median order
(38.77, 18.81) nmol / pmol lower than Stage 3-4 was 69.45 nmol /
pmol, Cortisol / ACTH ratio 23h at Phase 1,2 is lower than GD3-4.
According to Lee MK and et al (2013), Li L et al (2018) have similar
meaning results to us
CONCLUSION
1. Concentration of cortisol, ACTH, cortisol / ACTH ratio in
patients with rheumatoid arthritis
23
-ACTH, Cortisol concentration at 8h and 23h in the GC group had a
lower median value than the control group, the difference was
statistically significant (p2.3 <0.001, p2,3 <0.05 ).
-ACTH, Cortisol concentration at 8h and 23h in the GC group were
lower than the group without GC, the difference was statistically
significant (p1,2 <0.001; p1,2 <0.05).
-ACTH, Cortisol concentrations at 8h and 23h in the non-GC group
had a lower median value than the control group, except for cortisol
8h: 78.06 ± 65.27 ng / ml with a higher value with 67,90 ± 43,21ng /
ml, with (p1,3> 0,05)
-The average ratio of Cortisol / ACTH 8h in the group without GC
was the highest, but the difference was not statistically significant.
-ACTH, Cortisol and Cortisol / ACTH ratios at 8h, 23h in the GC
group at the lower quartile were the highest compare with in the nonGC group and control group (p2.1 <0.001; p2,3 < 0.001). Except for
Cortisol / ACTH ratio 8h, 23h, with P> 0.05
2. Relationship between cortisol, ACTH, cortisol / ACTH blood
ratio with disease activity and rheumatism
-Patients with mild activity of the rheumatoid arthritis (both using
and not using GC) ACTH levels 8h and 23h have lower median
values than patients with moderate and strong activity levels
-Patients with mild activity of the rheumatoid arthritis do not use GC
cortisol concentration at 8h, 23h with lower median value than
patients with moderate and strong activity level.
-Patients with mild activity of the rheumatoid arthritis in the GC
group cortisol concentration of 8h is higher but cortisol 23h
concentration is lower than patients with moderate and strong activity
level, with p2> 0.05
₋ ACTH concentration 8h, 23 h in the non-GC group in the median
tends to increase gradually according to the disease phase. In
contrast, ACTH concentrations of 8 hs and 23 h in the GC group
tended to decrease gradually according to the disease history.
24
-Cortisol concentration of 8h, 23h in the group that did not use GC,
the group using GC median tends to decrease gradually according to
disease phase, the most decrease is phase 3 and 4.
-Cortisol / ACTH ratio 8h, 23h in the non-GC group, the group using
GC increased with disease activity level, with p1> 0.05, p2> 0.05
-There is a moderate correlation (r=0.41; r=0.34) between ACTH and
cortisol blood levels in both groups without GC, using GC
-ROC curve with cut-off point of blood Cortisol concentration at 8h
≤35.5ng / ml is valid for diagnosis of patients using GC with
sensitivity:77.1%;Specificity:91.4%.The AUC is 0.828 with p <0.001
-Only a multivariate correlation between cortisol concentration at 8
am and serum CRP concentration with p <0.001
RECOMMENDATIONS
-Although GC is still considered an effective measure to control
inflammation of rheumatoid arthritis, the use of GC for patients with
rheumatoid arthritis needs to be individualized, only when necessary
(Good bridging treatment treatment of disease outbreaks, must
optimize the basic treatment (background treatment) and avoid abuse
of GC
-For patients with rheumatoid arthritis with clinical manifestations
suggesting adrenal insufficiency or long-term illness, the amount of
ACTH and cortisol should be determined to make appropriate
adjustments. The levels of cortisol and ACTH vary widely in patients
with rheumatoid arthritis, depending on the degree of disease activity
and the duration of the disease ..., which may contribute to increased
disease activity, difficulty controlling the disease, increasing
variability and adverse effects of treatment drugs
₋It is possible to use the ratio of Cortisol / ACTH used for
preliminary assessment of the ability to secrete cortisol, otherwise the
synacthene test can be performed.