Ebook ECG at a glance: Part 1
Bạn đang xem bản rút gọn của tài liệu. Xem và tải ngay bản đầy đủ của tài liệu tại đây (14.62 MB, 67 trang )
ECG at a Glance
ECG at a Glance
Patrick Davey
Consultant Cardiologist
Northampton General Hospital
Northampton, and
Honorary Senior Lecturer
Department of Cardiovascular Medicine
John Radcliffe Hospital
Oxford
A John Wiley & Sons, Ltd., Publication
This edition first published 2008, © 2008 by Patrick Davey
Blackwell Publishing was acquired by John Wiley & Sons in February 2007. Blackwell’s publishing
program has been merged with Wiley’s global Scientific, Technical and Medical business to form
Wiley-Blackwell.
Registered office: John Wiley & Sons Ltd, The Atrium, Southern Gate, Chichester, West Sussex,
PO19 8SQ, UK
Editorial offices: 9600 Garsington Road, Oxford, OX4 2DQ, UK
The Atrium, Southern Gate, Chichester, West Sussex, PO19 8SQ, UK
111 River Street, Hoboken, NJ 07030-5774, USA
For details of our global editorial offices, for customer services and for information about how to
apply for permission to reuse the copyright material in this book please see our website at
www.wiley.com/wiley-blackwell
The right of the author to be identified as the author of this work has been asserted in accordance with the
Copyright, Designs and Patents Act 1988.
All rights reserved. No part of this publication may be reproduced, stored in a retrieval system, or
transmitted, in any form or by any means, electronic, mechanical, photocopying, recording or otherwise,
except as permitted by the UK Copyright, Designs and Patents Act 1988, without the prior permission
of the publisher.
Wiley also publishes its books in a variety of electronic formats. Some content that appears in print may
not be available in electronic books.
Designations used by companies to distinguish their products are often claimed as trademarks. All brand
names and product names used in this book are trade names, service marks, trademarks or registered
trademarks of their respective owners. The publisher is not associated with any product or vendor
mentioned in this book. This publication is designed to provide accurate and authoritative information in
regard to the subject matter covered. It is sold on the understanding that the publisher is not engaged in
rendering professional services. If professional advice or other expert assistance is required, the services
of a competent professional should be sought.
Library of Congress Cataloguing-in-Publication Data
Davey, Patrick,
ECG at a glance / Patrick Davey.
p. ; cm. – (At a glance series)
Includes index.
ISBN 978-0-632-05405-3
1. Electrocardiography – Handbooks, manuals, etc. I. Title. II. Series: At a glance series (Oxford,
England) [DNLM: 1. Electrocardiography – Handbooks. WG 39 D248e 2008]
RC683.5.E5D32 2008
616.1′207547–dc22
2007016865
ISBN: 978-0-632-05405-3
A catalogue record for this book is available from the British Library
Set in 9/11.5pt Times by Graphicraft Limited, Hong Kong
Printed in Singapore by Fabulous Printers Pte Ltd
1
2008
Contents
Preface 6
Acknowledgements 7
1 Introduction to the ECG 8
2 Strengths and weaknesses of the ECG 10
3
4
5
6
Part 1 The normal ECG
Basis of the ECG 12
The normal P wave 16
The normal QRS complex 18
The T and U waves 20
Part 2 ECG abnormalities
7 Abnormalities in the shape of the P wave – left and right atrial
enlargement 22
8 Increased QRS amplitude 24
9 Q waves and loss of R wave height 26
10 QRS axis deviation 28
11 Long PR interval and QRS broadening 30
12 Delta waves 32
13 ST elevation 34
14 ST depression 36
15 Mild T wave flattening 38
16 Deep T wave inversion 40
17 QT interval and U wave abnormalities 42
18
19
20
21
22
23
24
25
26
27
28
Part 3 Clinical syndromes
Acute chest pain 44
Chronic chest pain 46
Acute breathlessness 48
Chronic breathlessness 51
Palpitations 54
Syncope 57
Hypertension 60
Shock 62
Stroke 64
Emotion and the ECG 66
Sudden cardiac death 68
Part 4 Diseases
Acute coronary syndromes 70
Non-ST segment elevation myocardial infarction 72
ST segment elevation myocardial infarction 74
Aortic valve disease and hypertrophic
cardiomyopathy 76
33 Mitral valve disease 78
34 Cardiomyopathy and myocarditis 80
29
30
31
32
35
36
37
38
39
Pulmonary hypertension 82
Congenital heart disease 84
Endocrine disease and electrolyte disruption 86
Psychological disease and its treatment 88
Genetic pro-arrhythmic conditions 90
Part 5 Tachyarrhythmias
40 Distinguishing supraventricular from ventricular
tachycardia 92
41 Narrow complex tachycardia 95
42 Atrial ectopic beats 98
43 Atrial fibrillation 100
44 Atrial flutter and atrial tachycardia 102
45 Atrioventricular nodal re-entrant tachycardia 104
46 Atrioventricular re-entrant tachycardia 106
47 Ventricular ectopics 108
48 Non-sustained ventricular tachycardia 110
49 Monomorphic ventricular tachycardia 112
50 Polymorphic ventricular tachycardia 114
51 Ventricular fibrillation 116
52
53
54
55
56
57
Part 6 Bradyarrhythmias and related diseases
Sinus node disease 118
Left bundle branch block 120
Right bundle branch block 122
First degree atrioventricular block – long PR interval 124
Second degree atrioventricular block 126
Atrioventricular block – third degree (complete) heart block 128
Part 7 Pacemakers
58 Pacemakers – basic principles 130
59 Anti-bradycardic pacemakers 132
60 Anti-tachycardic and heart failure devices 134
61
62
63
64
65
Part 8 ECG-based investigations
External and internal loop recorders 136
Tilt-table test and carotid sinus massage 138
Twenty-four hour ECGs 140
The exercise stress test 144
Invasive electrophysiological studies 148
Part 9 Self-assessment case studies
Case studies and answers 150
Appendix 162
Index 163
5
Preface
As you are reading this preface, you wish to learn more about the ECG.
Many books will try and persuade you that learning how to interpret the
ECG is easy, will require little or no effort, and certainly won’t take you
long, just a brief read of a short book over a night or two should do it.
These views are incorrect. Learning the ECG is difficult, there are many
challenges to be overcome, and it will take you a long time before you
become competent. As learning takes time and is challenging, ultimately, it is very rewarding.
The basic principle in learning the ECG, as is true for much of
medicine, is that you should understand the basics, and then develop
this knowledge using individual patients. I hope this book introduces
you to the basics, then as it takes you through the many different
examples, you can extract the general principles as you go along.
As a guide, I would suggest the following approach to those new to
the ECG:
• Start off by reading the first two chapters to give yourself a very basic
introduction to the topic. Take a break for a few days, maybe even longer.
• Re-read the first two chapters, then read and understand the four
chapters on the basic properties of the normal ECG. Take another break.
• Read the next 11 chapters in Part 2, first briefly revising the four
chapters on the normal ECG. As you go along, rehearse in your own
mind what you have learnt, and in particular try and understand why
things are as they are. Ask yourself questions; use the index to look up
the answers.
• These initial sections give you a basic understanding of the ECG; try
and embed this knowledge early on.
• Don’t overfill yourself too quickly with knowledge from these
sections and press on too quickly on to the main body of the book.
Whenever you need to, take a break for a few days, or even longer.
These initial sections may well take you, gently, a good few weeks to
assimilate. Be quite certain that you understand them before you
progress onwards to the more clinical sections of the book.
• When you feel ready progress on to the next sections. These six sections are on more advanced areas of the ECG, either a clinical syndrome
(e.g. chest pain), a disease process, arrhythmias, complex ECG based
investigations, or device therapy. Dip in here in random order as your
interest takes you; this is allowed for as there is much repetition in the
book, and much cross-referencing. Often the best way to learn is to hang
your learning around a case that you have seen. Accordingly, as you see
cases on the wards, and in outpatients, look them up in these sections,
then follow your curiosity to related chapters.
The mainstay of learning is experience. How many ECGs do you need
to read before you are competent? Most national cardiac societies feel
6
about 500 ECGs are needed. Try very hard to read the ECG blind, i.e.
before you know what it is meant to show: it is in the intellectual act of
you trying to work out what is going on that learning occurs, so you
should allow this to happen. Ask more senior colleagues what they
think the ECG shows, to confirm or deny your views. The figure of 500
ECGs gives you an estimate of how long it may take you to learn to read
the ECG competently. Say you read blind 10 ECGs a week, this will
take one year; I think this is an optimistic figure, a more reasonable five
ECGs per week gives two years, a more reasonable time period. This
means that you will have to ‘parallel track’ your ECG reading with
attachments in many clinical areas, just as you do for your radiological
experience. If you do this steadily, you will become most proficient.
Whenever you look at an ECG, ask the following questions:
• ‘What does this show?’ Examine the ECG systemically (name, date
of birth, date and time recorded), then: (1) cardiac rhythm, (2) heart rate,
(3) P wave abnormalities, (4) PR interval, (5) QRS duration, axis,
whether any Q waves, (6) ST segment, (7) T wave, (8) QT interval.
Compare the ECG with a normal one (there are several examples in the
book), if possible with an old one from the patient, then summarize how
your patient’s ECG differs from this. Describe the differences using
ECG phraseology, e.g. there is ST elevation leads II, III, and aVF,
otherwise the ECG is normal. These are new findings.
• ‘What does it mean?’ Sometimes one explanation leaps out, e.g. in
the above example, an inferior wall ST segment elevation MI.
• ‘Consider what the alternative explanations might be?’ Most ECGs
have a differential diagnosis, for example, might the example above
reflect pericarditis?
• ‘How can I distinguish these alternatives?’ This depends on the
situation, in the example above, a cardiac ultrasound.
Try and go through this systematic approach for every ECG you read;
this will help you develop an ordered comprehensive approach. In due
course you will develop legitimate short cuts, but do so only when you
are confident in ECG interpretation.
Though this process of gathering experience takes time, it also provides the fun. Did I get it right? Yes – be pleased, indeed, very pleased.
This feeling should drive you onwards. No - try and learn why. This is
the frustrating part of learning, though often the most instructive – we
learn most from our mistakes, make sure you do.
I would like to wish you good luck, and I hope you enjoy learning
about the ECG, it is endlessly fascinating.
Patrick Davey
2008
Acknowledgements
The author and publisher have made every effort to contact copyright
holders of previously published figures and tables to obtain their
permission to reproduce copyright material. However, if any have
been inadvertently overlooked, the publisher will be pleased to make
the necessary arrangements at the first opportunity.
Fig. 18.3(b): Collinson, J et al. (2000) Clinical outcomes, risk stratification and practice patterns of unstable angina and myocardial infarction without ST elevation: Prospective Registry of Acute Ischaemic
Syndromes in the UK (PRAIS-UK). European Heart Journal, 21,
1450–1457, by permission of Oxford University Press.
Fig. 18.3(c): Diderholm, E et al. (2002) ST depression in ECG at entry
indicates severe coronary lesions and large benefits of an early invasive
treatment strategy in unstable coronary artery disease. The FRISC II
ECG substudy. European Heart Journal, 23, 41–49, by permission of
Oxford University Press.
Table 31.2(b): Morrow, DA et al. (2000) TIMI risk score for
ST-elevation myocardial infarction: a convenient, bedside clinical
score for risk assessment at presentation. Circulation, 102, 2031–2037,
by permission of Lippincott Williams & Wilkins.
Fig. 36.3: Brichner, EM et al. (2000) Congenital heart disease in adults.
New England Journal of Medicine, 342, 256 –263, 334–342. Copyright
© 2000 Massachusetts Medical Society.
Fig. 42.2: Blomstrom-Lundqvist et al. (2003) ACC/AHA/ESC
guidelines for management of SVA. Journal of American College of
Cardiology, 42 (8), 1493–1531, by permission of Elsevier.
Fig. 44.1: Konings, KT et al. (1994) High-density mapping of electrically induced atrial fibrillation in humans. Circulation, 89, 1665–1680,
by permission of Lippincott Williams & Wilkins.
Fig. 46.1: Ganz, L (1995) Supraventricular tachycardia. New England
Journal of Medicine, 332 (3), 162. Copyright © 1995 Massachusetts
Medical Society.
Table 63.1: Brignole, M et al. (2000) New classification of haemodynamics of vasovagal syncope: Beyond the VASIS classification;
analysis of the pre-syncopal phase of the tilt test without and with
nitroglycerin challenge. Europace, 2, 66–76, by permission of Oxford
University Press.
Fig. 64.2: Malik, M et al. (1996) Heart rate variability: standards of
measurement, physiological interpretation and clinical use. European
Heart Journal, 17, 354–381, by permission of Oxford University Press.
Fig. 65.1: Jarcho, M. (2006) Biventricular pacing. New England
Journal of Medicine, 355, 288–94. Copyright © 2006 Massachusetts
Medical Society.
7
1
Fig.1.1
Introduction to the ECG
(a)
(c)
(b)
(d)
Fig.1.2
Right and left arm
leads should be placed
outwardly on the shoulders
(preferentially over bone
rather than muscle)
V4 should be placed in the fifth intercostal
space on the mid-clavicular line
V1 and V2 are positioned in
the fourth intercostal space
V3 lies halfway between
V2 and V4
RA
LA
V1
Fig.1.3
V2
V3
V4 V5 V6
V4, V5 and V6 should
be placed along a
horizontal line – this
line does not
necessarily follow the
intercostal space
Anterior axillary
line
aVR
aVL
V6
III
The right leg lead
(ground lead)
should be placed
below the umbilicus
8 Introduction to the ECG
aVF II
aVL
aVR
Posterior wall
V6 I
LL
The left leg lead
should be just
below the umbilicus
Horizontal
plane with
precordial
leads
Frontal plane
with extremity
leads
Mid-axillary
line
RL
I
V1 V2
V3 V4 V5
V6 (I)
Inferior wall
II
III
aVF
V5
V4
V1
V2 V3
The electrocardiogram (ECG) is a wonderful tool, cheap, widely available, and incredibly useful. It informs diagnosis, guides and assesses
the response to therapy and provides vital data on prognosis. In epidemiological use it gives great insights, e.g. it informs us that 30% of
myocardial infarctions (MIs) are clinically silent, and that hypertensive
heart disease when associated with certain ECG changes has a high
mortality. The ECG informs us not only in acquired heart disease but
also in genetic disease, e.g. hereditary long QT or Brugada syndrome.
The diagnostic role extends beyond cardiac disease to pulmonary
emboli, electrolyte imbalance, rheumatic disease, fitness level, liver
disease, diabetes, starvation, etc. It is probably the most useful investigative tool in the whole of medicine.
arrhythmias were elucidated in the mid 20th century, leading inexonerably to greater understanding and better treatment. Catheters allowing
the recording of intracardiac ECG signals became available in the
mid-century, leading logically to protocols to stimulate the heart to
provoke arrhythmias (the electrophysiological study). These intracardiac recordings led to major progress in the diagnosis and treatment
of arrhythmias. The external ambulatory recorder, developed by the
Montana physician Holter in the 1950s led to discoveries in arrhythmias, circadian rhythm, and cardiac autonomic function (heart rate
variability). Technology allowed the development of implantable ECG
recorders (the Reveal device), and defined the role of the tilt-table test
and carotid sinus massage. Advances continue, e.g. the discovery of the
genetic pro-arrhythmic disease by the Brugada brothers in 1992.
A brief history of the ECG
The development of the ECG started in the mid 19th century with ideas
concerning the role of electricity in the heart, then with the development
of increasingly sensitive ways to measure this electricity. The early
ECG machines were vast and required a water-cooled jacket! Technological advances in the early 20th century saw recording devices
become increasingly small and by 1928 weighed ‘only’ 50 lbs (22 kg),
described as being ‘portable’. Weight and size reduction continued
and current devices weigh only a few pounds. The modern 12 leads of
the ECG were formalized in 1942, with:
• the addition of the three augmented limb leads (aVR, aVL and aVF)
of Emanuel Goldberger; to the
• pre-existing three standard leads (I, II, III) so fully explored by the
‘greats’ of the ECG, Einthoven, Lewis, Mackenzie, and Wilson; and the
• six chest leads (V for voltage 1–6, the technical aspects being
formalized in 1938 by the American Heart Association and the British
Cardiac Society).
Subsequent years saw an explosion in ECG-based research, and
> 150 000 articles on the ECG have now been published!
The ECG in arrhythmias
The early use of the ECG was in arrhythmias, with the classic finding of
Wenckebach in 1899 (Wenckebach block), of John Hay in Liverpool in
1905 (Mobitz type II block) and Arthur Cushny, a London professor, in
1907 on atrial fibrillation, an arrhythmia subsequently greatly investigated by Thomas Lewis (University College Hospital, London). Lewis
obtained an ECG from a horse with atrial fibrillation and confirmed the
diagnosis by examining the atria when the horse was slaughtered!
Einthoven made vital contributions and earned the Nobel prize in 1924,
the same year that Mobitz published his seminal ECG findings in
second degree heart block. The surface ECG findings in many cardiac
Fig. 1.1 (a) Willem Einthoven, in the early 1990s. (b) Early ECG
recording required the arms and legs to be placed in saline buckets.
(c) An early ECG machine. (d) One of the first ECGs recorded by
Augustus Waller (top trace = time, middle trace = chest wall motion,
bottom strip = the ECG).
Fig. 1.2 ECG lead placement for an exercise ECG – in a resting
ECG the leads to the legs are attached to electrodes just above the
The ECG and arrhythmia device therapy
Pacing therapy for slow heart beats had been known of for many years
before external devices (bulky and unreliable) became available in
1952. The real breakthrough came in 1958 with the first implantable
pacemaker. Subsequent years saw increasing miniaturization, longer
battery life, sensing functions and full programmability. Though the
knowledge that large direct current applied across the heart could terminate ventricular fibrillation was known from the work of Prevost and
Batelli, professors at Geneva, from 1899, it was not until 1947 that
Beck, in Cleveland was able to successfully demonstrate defibrillation
from ventricular fibrillation (VF) during heart surgery. This led to successful closed chest cardioversion in 1956, and by the 1960s external
defibrillators were routinely saving many lives. A logical development
was the internal defibrillator, widely available by the mid 1990s. Even
more recent is cardiac resynchronization therapy, useful in treating
heart failure.
The ECG and coronary disease
The early 19th century saw the discovery of the classic changes of ‘fullthickness’ myocardial infarction and angina. It was realized early on
that many patients with coronary disease had normal resting ECGs.
Using exercise to provoke angina, and then record an ECG became
widely accepted by the middle third of the century and in 1963 Bruce
proposed his classic exercise test. The ability to diagnose coronary
disease became widespread, underpinning both the need for and the
development of coronary angiography and revascularization. In the
1980s the role of thrombolytic therapy in ST segment elevation but
not non-ST segment MI was understood. The role of the ECG in risk
stratifying MI continues to evolve, with multiple ECG-based risk
scores now available.
ankles. The ECG can be extended further beyond V6, to include
leads V7–9, which extend posteriorly on the left chest. The leads
can also be extended further rightward beyond lead V1, as
‘right-sided chest leads’.
Fig. 1.3 The direction from which the basic 12-leads of the ECG
examine the heart.
Introduction to the ECG 9
2
Strengths and weaknesses of the ECG
Fig.2.1
Patients with the disease
Patients free of the disease
Diagnostic test
positive
A [True +ve]
B [False +ve]
Positive predictive accuracy
= Predictive value of a positive test
= Post-test likelihood of disease with a positive diagnostic test
= A/A+B
Diagnostic test
negative
C [False –ve]
D [True –ve]
Negative predictive accuracy
= Predictive value of a negative test
= Post-test likelihood of no disease with a negative diagnostic test
= D/C+D
Sensitivity
= A/A+C
Specificity
= D/B+D
Prevalence = pre-diagnostic test likelihood of disease
= [A+C]/[A+B+C+D]
Fig.2.2
ECG highly reliable
STEMI - diagnosis
Arrhythmias (during
an episode)
ECG modestly reliable
STEMI – patent artery
following thrombolytic
therapy
Non-STEMI
Exercise ECG for prognosis
in chronic stable angina
Exercise ECG for diagnosing
IHD in chronic stable angina
ECG in confirming the
presence of an old non-STEMI
Diagnosis of WPW
syndrome between
episodes of arrhythmias
Propensity to arrhythmias
(outside an arrhythmic
episode)
Memo device in
diagnosing palpitations
Internal loop recorder
(Reveal® device) in the
diagnosis of syncope
Presence of acquired
long QT syndrome
Identification of a group at
very low risk of sudden
cardiac death post-MI
(narrow QRS/no late
potentials/high HRV)
Prediction of sudden cardiac
death post-MI
Prediction of future
sudden cardiac death
in the broad population
External loop recorder in
diagnosing palpitations
occurring > once/week
24-h ECG in the diagnosis
of frequent palpitations
Resting ECG in
diagnosing palpitations
between events
Tilt-table test/carotid sinus
massage in the diagnosis of
syncope
24-h ECG in the
diagnosis of syncope
Prediction of future
arrhythmias in those with
acquired long QT syndrome
Prediction of arrhythmias
occurring in those with
Brugada syndrome
ECG in the diagnosis
of hypertension
External loop recorder in
the diagnosis of frequent
(≥ 1/week) syncope
Presence of hereditary
long QT syndrome HLQTS
Presence of Brugada
syndrome
ECG in determining
regression of LV
hypertrophy
ECG in diagnosing
hypertensive heart
disease
ECG in predicting future
events in those with
hypertension
Diagnosis of hypertrophic
obstructive cardiomyopathy
Diagnosis of acquired LVH
Diagnosis of RV hypertrophy/
ECG in estimating
pulmonary artery pressure
Left atrial enlargement
Right atrial enlargement
Exclusion of heart failure
(normal ECG)
Prediction of benefit from
multi-site ventricular
pacing in heart failure
Presence of heart failure
Prediction of future
arrhythmias in those with
HLQTS
ECG in supporting a clinical
diagnosis of aortic stenosis
Diagnosis of the presence of
an atrial septal defect
Diagnosis of the presence
of complex cyanotic
congenital heart disease
(RVH)
ECG in the diagnosis of
↑ or ↓ K+ related
arrhythmias
10
Strengths and weaknesses of the ECG
ECG in the diagnosis of
thoracic aortic dissection
Resting ECG for diagnosing
IHD in chronic stable angina
ECG in confirming the
presence of an old STEMI
Presence of ventricular
fibrillation
Internal loop device
in the diagnosis of
palpitations
ECG highly unreliable
ECG in diagnosing the cause ECG in diagnosing the cause
of chest pain in the
of troponin negative chest
emergency room (all comers) pain in the ER
Diagnosis of patent
foramen ovale
Diagnosis of the exact
nature of complex cyanotic
heart disease
ECG in increasing suspicion ECG in diagnosing moderate
of ↑ T4 (sinus tachycardia/ hypo/hyperkalaemia
atrial fibrillation)
ECG in increasing suspicion
of ↓T4 (bradycardia, long QT
interval, ↓ QRS size)
ECG in the diagnosis of
isolated ↑ or ↓ in Ca2+
or Mg2+
The ECG is a powerful tool, useful diagnostically and therapeutically in
suspected cardiac disease, in non-cardiac problems, e.g. non-accidental
poisoning, metabolic disturbance, etc, and in monitoring the heart rate
of sick patients. ECGs are so widespread that physicians should understand its strengths and weaknesses.
Diagnostic role of the ECG
You should be aware of what proportion of those with a diagnosis have
a diagnostic ECG, what proportion do not, and what proportion of
people with a diagnostic ECG do not have that diagnosis (Fig. 2.1). If
you do not have a good idea about these figures, then you do not know
whether the ECG has ruled in or out the disease in question and regardless of what it shows, the ECG will have been unhelpful. Usually the
problem with the ECG is not so much what it shows (e.g. flat T waves,
right bundle branch block, etc) as to the pathological interpretation of
these findings. If the finding/interpretation is unique, then the ECG
is useful, if there are multiple interpretations then the ECG is less
helpful.
Highly diagnostically reliable ECGs
As a generalization, the grosser or more unusual ECG changes are, the
more likely there is only one explanation and so the more useful is the
ECG. The following conditions have unique ECGs, gross changes, and
often only one interpretation:
• ST elevation myocardial infarction (MI) (STEMI), only rarely confused with physiological or pericarditis-related ST elevation.
• Major ST depression during a stress test, in someone at risk of
ischaemic heart disease (IHD), fairly reliably indicates coronary disease.
• Arrhythmias are reliably diagnosed on their ECG appearances.
• Wolff–Parkinson–White (WPW) syndrome, ‘classic’ Brugada/hereditary long QT syndrome (HLQTS).
Moderately diagnostically reliable ECGs
There are often relatively few interpretations to the ECG in:
• Many cases of non-ST segment elevation MI, the ECG is reasonably
reliable, e.g. ‘proximal left anterior descending (LAD)’ pattern or
marked ‘dynamic’ changes.
• Marked left ventricular hypertrophy (LVH) – the grosser the changes,
the more reliable is the ECG diagnosis, and the less likely is LVH not to
be present. The ECG usually does not reveal the cause of LVH.
Diagnostically less useful ECGs
Most ECG abnormalities are frequent and/or mild, can result from
many diseases and are not useful diagnostically:
• T wave flattening, classically due to hypokalaemia – most patients
with such ECGs are not hypokalaemic.
• Arrhythmia predisposition may be suspected from the ECG, but the
relationship between suspicious ECG findings and actual arrhythmias
is weak:
(a) Conducting tissue disease (e.g. left bundle branch block
[LBBB]/long PR interval) predisposes to heart block – most such
patients do not have high-grade atrioventricular (AV) block.
(b) Acquired long QT interval predisposes to torsade-de-pointes
(TDP) ventricular tachycardia: most patients with moderate QT prolongation do not have TDP.
Fig. 2.1 The definition of sensitivity, specificity, positive and negative
predictive accuracy.
This leads to an important principle: if you suspect an arrhythmia, the
only way to confirm the diagnosis is to record that arrhythmia!
Prognostic role of the ECG
The ECG can be modestly helpful prognostically, but is rarely the only
factor determining outlook:
• ST elevation acute MI, prognosis relates to:
(a) Site of infarction: best with inferior, worst with anterior MIs.
(b) Distribution/extent of ST elevation: the more leads, and the
greater the sum total, the worse the outlook.
(c) Degree of ST segment elevation resolution with thrombolytic
therapy: the quicker, the more likely reperfusion therapy has opened
the artery, the better the outlook.
(d) Q waves post-MI, especially if extensive, are associated with
larger MIs, worse LV function and outlook.
• Non-ST segment elevation MI. Prognosis relates to many factors
including resting ECG changes – worst for ST depression, intermediate
for T wave inversion.
• Ambient post-MI arrhythmias have some prognostic importance. Ventricular ectopics are weakly related to sudden cardiac death (SCD), but
there is a stronger association between non-sustained ventricular tachycardia and SCD. LV function is much more strongly related to outlook.
• QRS duration: in heart failure those with the broadest QRS complexes have the worst outlook.
Limitations to the ECG
The main problems with the ECG are:
• That the ECG fails to confirm the suspected diagnosis, when it is present. For example:
(a) ST depression is not induced during an exercise tolerance test
(ETT) in some patients with severe coronary artery disease (CAD),
i.e. they have a high-level negative ETT. If you know this, you will
not fall into the trap of ruling out CAD solely on the basis of an ETT.
(b) Intermittent profound bradyarrhythmias, e.g. high-grade heart
block or sinus node arrest can occur in those with a normal resting
ECG/normal prolonged ambulatory monitoring. If you know this,
you may still implant a pacemaker in such a patient to their benefit.
(c) A single ECG with a normal QT interval does not exclude the
long QT syndrome, as diagnostic changes can be intermittently present.
Relying too heavily on the ECG, without knowing its limitations, will
lead to the right diagnosis being dismissed – unless the situation is one
where the diagnosis will always be confirmed by the ECG (e.g. arrhythmias, ST segment elevation MI [STEMI] – crucially not an MI, which
can present with a normal ECG) you must be aware that a normal ECG
rarely rules a condition out.
• The ECG suggests a diagnosis when the patient is normal, e.g. in
musculoskeletal chest pain, the ECG shows ST elevation, misinterpreted as pericarditis/STEMI, whereas it is physiological without
pathological significance.
• The ECG suggests one diagnosis, whereas another is present, e.g.
in syncope, the ECG shows extensive conducting tissue disease, suggesting bradyarrhythmias due to AV block, but in fact ventricular
tachycardia is the diagnosis.
Avoid ‘putting all your eggs in one basket’ on the basis of the ECG; use
it to guide diagnosis rather than relying entirely on it.
Fig. 2.2 The reliability of the ECG in diagnosis and management.
Strengths and weaknesses of the ECG 11
3
Basis of the ECG
Fig.3.1
0 mV
Resting
membrane potential
–80 mV
Net extracellular charge
Excess negative charge
Excess positive charge
Na+
Sarcoplasmic reticulum
K+
Ca2+
Intracellular K = 140 mmol/L:Na = 5 mmol/L
Extracellular K = 5 mmol/L:Na = 140 mmol/L
Fig.3.2
(a) Cells that have
depolarized
Cells yet to
depolarize
Ca2+
Na+–Ca+
exchanger
Na+
Na+–K+
ATPase pump
Na+
K+
(b)
Direction of current flow between cells
Fig.3.4
Fig.3.3
b
b
a
c
b
b
a
c
c
c
a
a
c
b
b
a
c
c
c
a
a
12
The normal ECG
Basis of the ECG
a
a
a
a
The basis of the ECG
The ECG is a clever device designed to detect current flow. The heart
generates electricity, which is transmitted to the chest wall, where it can
be detected. The ECG records the pattern of spread of electricity in the
various phases of the cardiac cycle. Its utility relies on the pattern of
spread changing in a characteristic fashion in many diseases. In understanding the ECG, be aware that:
• Electrons carry current, which flows from areas with negative charge
to areas with more positive charge; when current moves towards an
observing electrode a positive deflection results and vice versa. The
ECG only shows a deflection when current is moving in the heart. No
current flow means no ECG deflection.
• The basis of current flow around the heart starts off as current flow
within individual heart cells, which induce current flow between cells.
With depolarization positively charged Na+ ions move into the cell;
with repolarization, positively charged K+ move out of cells – this
leaves excess negative charge outside the cell at the start of the cardiac
cycle, excess positive charge outside the cell at the end of the cycle.
• Current flows from areas just depolarized (excess extracellular
negative charge) into areas yet to depolarize, then onto an observing
electrode. This current flow depolarizes neighbouring cells, firing
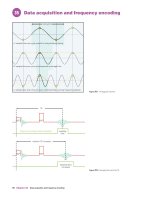
Fig. 3.1 The top part of the figure shows an action potential, with voltage
measured by an intracellular electrode; the middle part of the figure shows
the net extracellular charge at different times during the action potential;
the bottom part of the figure shows ion movement into, out of and within a
myocyte during the action potential. The action potential: intracellular
[K+] is 130–140 mmol/L; extracellular K+ is 4–5 mmol/L. Intracellular
[Na+] is 5 mmol/L, extracellular [Na+] 140 mmol/L. The resting myocyte
membrane is permeable only to K+; during rest some K+ moves down its
concentration gradient from the inside to the outside of the cell, with its
positive charge, leaving negative charge inside the cell. This results in a
potential difference between the outside and inside of the cell of –90 mV.
The excess extracellular positive charge prevents more positively charged
K+ moving out of the cell. During the upstroke of the action potential
(phase 1), the cell membrane becomes impermeable to K+ and rapidly
more permeable to Na+, which along with its positive charge moves down
its concentration gradient into the cell, leaving net negative charge outside
the cell, so the interior of the cell becomes positively charged to +30 mV.
This positive intracellular voltage triggers the release of Ca2+ from its
sarcoplasmic reticulum (SR) and other storage sites, initiating myosin
contraction. During the plateau phase (phase 2), the cell membrane
remains much more permeable to Na+ than K+, so the intracellular
environment is positively charged. Furthermore, there is also a net flow
of Ca2+ into the cell, which helps maintains net positive charge in the cell,
and myosin contraction. With repolarization the membrane becomes
much less permeable to Na+ than K+, so K+ again flows out of the cell
action potentials, and in sequence fully depolarizing the whole heart.
When fully depolarized, the extracellular charge throughout the heart is
the same; there is no current flow, and no ECG deflection.
• At the end of the cardiac cycle, individual myocytes repolarize,
moving positively charged K+ ions out of the cells, leaving the outside
extracellular space more positive than the extracellular space of those
parts of the heart yet to repolarize. Current, as electrons, moves into the
repolarized area from the areas of the heart yet to repolarize.
• In summary, the heart does not depolarize or repolarize simultaneously – some areas de/repolarize before other areas, so that in
depolarization, current flows into areas about to depolarize, with
repolarization, current flows away from areas about to repolarize. This
spread of currents give rise to a characteristic sequence of currents
flowing over the heart with each heartbeat.
• The utility of the ECG in medicine is that many, but far from all,
diseases change this electricity pattern in a characteristic way.
• It is crucial to remember that abnormal ECG reflect deviations in the
flow of the current from normal – they may indicate something seriously wrong with the heart, they may not – abnormal ECGs do not
always mean the heart is abnormal!
(as repolarizing potassium currents), allowing the interior to become
negatively charged (phase 3), so restoring the resting status. Ca2+ is
removed (by SR pumps) from the cytoplasm around this time, terminating
myosin contraction. The membrane permeability alters due to the opening
and shutting of ion-specific membrane channels (these switch on or off
according to the intracellular voltage, spontaneously over time, or in
response to hormones and intracellular messengers). Intracellular ionic
concentration is maintained by pumps that consume adenosine
triphosphate (ATP) (e.g. the Na+K+ATP’ase membrane pump).
Fig. 3.2 Current flows between different areas of the heart either
when some areas have depolarized and others are still to depolarize or,
conversely, when some areas have repolarized and others are still to
repolarize. (a) Here depolarized cells are shown with excess negative
charge, which flows in the direction of the depolarization wavefront.
(b) This shows the current flow loops round the dipole, producing
current flow to the side and behind the depolarization wave.
Fig. 3.3 This shows a more complex and so more realistic pattern of
current flow than Fig. 3.2b. In the centre is a dipole (labelled as – or + for
the polarity at either end), which generates a complex series of looping
currents around itself.
Fig. 3.4 The surface correlates of internal current flow, projected onto a
torso. The pattern of current flow is complex. There is no current flow
towards an observing electrode at right angles to the dipole, and maximal
flow directly in front or behind the dipole.
Basis of the ECG The normal ECG
13
Fig.3.6
Fig.3.5
Electrocardiogram
Aortic pressure
(mmHg)
Left ventricular pressure
(mmHg)
Left atrial pressure
(mmHg)
Left ventricular volume
(mL)
Heart sounds
Fig.3.7
Fig.3.8
R wave
5 mm
0.2 s
T wave
P wave
R
5 mm
0.5 mV
1 mm
1 mm
0.1 mV
0.04 s
S wave
25 mm/s
10 mm/mV
R wave
PR
segment
ST
segment
P
T
U
Q wave
Q
R prime wave
R wave
PR
interval
ST interval
S
QRS
interval
S wave
14
The normal ECG
Basis of the ECG
QT interval
The basic ECG
The ECG is the surface recording of the electricity associated with the
cardiac cycle. To understand the ECG you should know: (i) the key
components of the cardiac cycle; (ii) when the different parts of the
heart depolarize and repolarize; (iii) where the different ECG leads are
sited.
The cardiac cycle
1 The heart fills during diastole and contracts during systole.
2 The cardiac cycle begins with electrical activation of the atria, starting at the cardiac pacemaker in the sino-atrial (SA) node, high up in
the right atrium.
3 A key property of the heart is that electrical activation (i.e. depolarization of a cell sufficient to fire an action potential) of some heart cells
activates adjacent cells (i.e. they become depolarized sufficient for an
action potential to fire). So, activation of the SA node initiates a wave of
depolarization that spreads over the right atrium and, via the bundle
of Bachmann into the left atrium. Electrical atrial activation leads to
co-ordinated atrial pumping.
4 The electrical impulse travels downwards into the atrioventricular
(AV) node, the only electrical connection between the atria and the
ventricles. The AV node delays the electrical impulse, allowing atrial
systole to finish before ventricular systole starts.
5 After a short delay (150–200 ms), the electrical impulse crosses the
AV node and enters the specialized conducting tissue of the ventricles
– the bundle of His, bundle branches and their divisions.
6 The specialized conducting tissue quickly (50–60 ms in health)
distributes the electrical impulse throughout the ventricle and into the
myocytes, initiating contraction. Though the electrical impulse spreads
quickly via the specialized conducting tissue, myocyte-to-myocyte
spread of electrical activity is much slower.
7 The specialized conducting tissue is sub-endocardial, so the wave
of excitation spreads endocardially to epicardially, and then onto an
observing electrode. This accounts for most leads observing the left
ventricle having a positive deflection.
8 After depolarization, the action potential of the myocytes has a
prolonged plateau phase, during which the ventricular myocytes are
contracted, and little current flows.
9 After the plateau phase, repolarization occurs, the intracellular
level of calcium falls rapidly and the myocytes relax, starting
diastole. Repolarization starts sub-epicardially and spreads subendocardially.
Fig. 3.5 The basic elements of the cardiac cycle.
Fig. 3.6 Sequence of depolarization of the heart. The impulse
starts at the sino-atrial (SA) node, then activates the atria, both
right (downwards and rightwards) and left (via the bundle of
Bachmann). The impulse then reaches the atrioventricular
(AV) node, is delayed briefly before passing into the
bundle branches and more distal Purkinje fibres.
Naming of the different waves of the ECG (Fig. 3.7)
• Atrial systole results in the P wave. Atrial repolarization results in a
small current flow, not seen, without a named wave.
• Ventricular depolarization is quick and results in the QRS complex:
(a) A Q wave is defined as an initial negative deflection of the QRS
complex.
(b) An R wave is defined as the first positive deflection of the ventricular complex.
(c) An S wave is a negative deflection of the QRS complex following
an R wave – it cannot be the first deflection of the QRS complex.
(d) An R′ wave (pronounced R prime) is a second positive deflection,
i.e. an R wave, followed by an S wave, and then a second R wave.
• During repolarization, current flows result in the T wave, and possibly the U wave.
Siting of the ECG leads
Much work in the early years related to ECG lead positioning and
signal processing. It is not necessary to comprehend processing details
to understand how the different leads observe the heart (see Figs 1.2
& 1.3). Though an almost infinite array of positions could be used,
lead localization is fixed by convention to allow standardization and
comparison; non-standard positions (e.g. right ventricle [RV], posterior
leads) are used if appropriate.
• The four limb leads are attached to the two arms and legs (red = right
arm; yellow = left arm; green = left leg; black = right leg): using these
leads, positions I, II, III, aVR, AVL and aVF are derived.
• The six chest leads are attached as follows:
V1 Red: fourth intercostal space, right sternal border.
V2 Yellow: fourth intercostal space, left sternal border.
V3 Green: midway between V2 and V4.
V4 Brown: fifth intercostal space, left mid-clavicular line.
V5 Black: level with V4, left anterior axillary line.
V6 Violet: level with V4, left mid-axillary line.
Paper speed and sensitivity
The ECG is usually recorded at a paper speed of 50 mm/s. Each large
square is 1 cm long, records 200 ms of activity and is divided into
five smaller ones of 40 ms duration. Always check the paper speed
of the recording. The sensitivity is usually 10 mm/mV. The size of the
deflection on the paper relates to the sensitivity setting, if it is increased
(e.g. 20 mm/mV) then complexes are larger, and vice versa. At the end
of each ECG modern machines insert a square wave pulse of 1 mV for
200 ms; confirming the settings.
Fig. 3.7 Naming of the different ECG waves. P wave reflects atrial
activation, T wave ventricular repolarization. Whether the T wave is
positive (i.e. above the line) or negative (below the line) it is always
called the T wave. The waves of the depolarization complex
(QRS complex) are defined in the text.
Fig. 3.8 The basic ECG nomenclature, demonstrating the basic ECG,
recorded at a standard paper speed of 50 mm/s, and sensitivity of
10 mm/mV, and showing the timing of the normal ECG.
Basis of the ECG The normal ECG
15
4
The normal P wave
Fig.4.1
(a)
(b)
-120º
-30º V6
aVL
–30∞
–150∞
±180∞
–90∞
I
±180º
0º V5
+30∞
+150∞
+120∞
+60∞
+90∞
III
II
aVF
Fig.4.2
+150º
+120º V1
Fig.4.3
(a)
(a)
+90º V2 +60º V3
+30º V4
Bachmann's bundle
Atrium
L
R
-60º
-150º
–120∞ –90∞ –60∞
aVR
-90º
Sinoatrial (SA) node
Left bundle branch
110 ms
Anterior
Normal P wave
Ventricle
Internodal tracts: Middle
Posterior
(b)
Conduction pathways
Lead II
Atrioventricular (AV) node
Right bundle branch
(b)
Lead V1
Left
atrial
1.0
0.8
n = 256
mean = 842.5 ms
σ2 = 1784 ms2
0.6
0.4
0
(c)
140
Heart rate (b/min)
120
RR interval (s)
Right
+ left
atrial
RR interval (s)
Right
atrial
1.0
50
100
150
Beats
n = 256
mean = 564.7 ms
σ2 = 723 ms2
0.8
0.6
0.4
200
250
0
50
100
150
Beats
Heart rate (1 min avg.)
200
250
HR mean = 65 b/min
HR max. = 118 b/min
100
80
60
40
HR min. = 44 b/min
20
12:00
16
The normal ECG
The normal P wave
18:00
00:00
06:00
12:00
The P wave reflects the electrical activation of the atria, and allows one to:
• Have some idea of where atrial depolarization started and whether the
atria are enlarged, as P wave shape relates to where depolarization starts
and the route it takes.
• Assess many properties of the sinus node, including heart rate variability, as the P wave reflects sinus node function.
The key points are:
• The best leads to look at the P wave are those directly in or away from
the path of atrial depolarization, i.e. lead II and lead V1 (Fig. 4.1a,b).
• The direction of travel of the depolarizing wave through both atria
determines the exact shape of the P wave.
• Depolarization starts at the sinus node (Fig. 4.2a,b), then travels
directly into the right atria and, via specialized conducting tissue known
as the bundle of Bachmann, into the left atria. The time taken for electricity to travel down the bundle of Bachmann means that left atrial
depolarization starts a little while after right atrial depolarization, and
accordingly goes on for a little while after right atrial depolarization has
finished (Fig. 4.3a–c).
The duration of the P wave reflects how long atrial depolarization
lasts. The duration is increased if the wave of electricity travels slower
than normal (e.g. some cardiomyopathies), or if the wave travels at the
normal speed but the atria is enlarged (see Chapter 7). In the former the
P wave size is usually diminished, whereas in the latter the P wave is
often of a good or better size.
The size of the P wave reflects both the volume of electrically active
tissue and the insulation between the atria and the observing electrode.
If the atria have more/larger myocytes, then the size of the P wave
increases; conversely if the number/size of myocytes decreases, or
there is more insulation between the heart and the ECG electrode (e.g.
pericardial effusion, obesity) then the P wave size diminishes.
Fig. 4.1 The position of the atria in the chest in the frontal and horizontal
planes, illustrating why leads II and V1 are best for examining the P wave.
From the frontal plane (a) it can be seen, as depolarization starts superiorly
and spreads inferiorly, that the wave of depolarization, and hence the
current flow, is largely directed towards lead II, completely so for the right
atrium, largely so for the left atrium. From the horizontal view (b) it can
be seen that as the sinus node lies high up in the right atria, and to its back,
the wave of right atrial depolarization passes directly towards lead V1.
However, the wave of left atrial depolarization passes largely away from
lead V1. It is easy to see why in left atrial enlargement the late
depolarization phase of the P wave is prolonged and negative in lead V1.
Fig. 4.2 (a) Timing and size of the contribution of right and left atria to the
shape of the P wave. Right atrial depolarization occurs first, and occupies
the first two-thirds of the P wave; left atrial depolarization onset is delayed
by about one-third of the duration of the P wave, and then occupies the
remaining two-thirds. In health, both contribute equally to the size of the P
wave. Thus the first and last thirds of atrial depolarization are exclusively
the domain of the right and left atria. Both atria contribute to the middle
third of the P wave and hence in health the overall P wave is largest in the
middle of the P wave. (b) P wave shape in leads II and V1; both left and
right atrial depolarization are directed towards lead II. Right atrial
depolarization is directed towards lead V1, though left atrial
depolarization is largely away, accounting for the appearance
of a late but small negative P wave deflection in lead V1.
Fig. 4.3 (a) Atrial depolarization, which starts at the sinus node,
spreads down internodal and interatrial (‘bundle of Bachmann’)
pathways, respectively allowing for right and left atrial depolarization.
The impulse then proceeds into the atrioventricular [AV] node and
the rest of the heart. (b) Heart rate variability. Two traces of RR interval
(essentially the same as PP interval) plotted out against beat number
(i.e. instantaneous heart rate). Left lying, right tilted up. Vagal tone,
higher when lying, increases high-frequency heart rate variability
(σ 2, measured in milliseconds squared), seen as instantaneous
increases/decreases in RR interval (sharp ‘spikes’ on the tachogram).
Standing increases sympathetic tone, increasing heart rate (i.e. lessening
RR interval) as vagal tone is withdrawn, lessening the high-frequency
changes seen when lying (n = number of beats assessed, μ = average
RR interval). (c) Trace of heart rate (HR) plotted out against time from
a normal 24-h ECG; normal heart rate variability, with a clear decrease
in heart rate at night when asleep.
Sinus node function
The P wave rate reflects sinus node activity, which is more complex
than imagined. The easiest way to assess sinus node function is from a
24-h ECG (Fig. 4.3c) and, though it is possible to look at PP intervals, it
is more usual to look at RR intervals (predicated on assuming the PR
interval is fixed, or changes only slowly). Important measures of sinus
node function include:
• Heart rate which responds to activity (e.g. slows during sleep,
increases during exercise), psychological influences and disease.
• Heart rate variability. Heart rate fluctuates over very short time
periods (seconds and minutes) in response to autonomic influences.
These heart rate fluctuations do not change the average heart rate,
but do change the instantaneous heart rate. The sympathetic nervous
system is believed to alter heart rate with a periodicity of about 0.1 Hz,
and the vagus with a periodicity of about 0.25 Hz.
The normal P wave The normal ECG
17
5
The normal QRS complex
Fig.5.1
(a)
(b)
2
1
3
Fig.5.2
(a) Normal: steady increase in R wave
height, falling off about V5
Fig.5.3
(a)
Step 1
Lead I
Step 4
Obtain angle
V1
V2
V3
V4
Increased size of S wave
from V1 to V2, then falling off
(b)
V5
V6
Small lateral lead Q waves,
reflecting depolarization of
the interventricular septum
P and T wave omitted
for clarity
Step 2
Lead
aVF
Poor R wave progression: instead of the normal increase
in R wave height across the chest leads, the R wave
height remains the same size for the first 3 or 4
chest leads
V1
V2
V3
V4
V5
Step 3
Plot out
resulting
point
Step 1: Determine the magnitude
of the QRS complex in lead I
Step 2: Determine the magnitude
of the QRS complex in lead aVF
Step 3: Plot the overall QRS vector
Step 4: Measure the QRS angle
V6
(b)
Left axis
deviation
The S wave depth may or may not increase from V1 to V2 and V3
–120°
aVR
(c)
–90°
–150°
–60°
aVL
–30°
±180°
LA
RA
+120°
III
LV
V5
V1 V2 V3 V4
The normal ECG
The normal QRS complex
+30°
+150°
V6
RV
18
–90°
I
Right
axis
deviation
+90°
aVF
+60°
II
Normal
axis
The QRS complex represents ventricular depolarization. The path of
depolarization (Fig. 5.1a–c) is from the atria into:
• The atrioventricular (AV) node, which slows down the depolarization wave to ensure that atrial contraction is over before ventricular
contraction starts.
• Then into the bundle of His.
• Then into the left side of the septum, with the current then passing
both down the septum, and from the left to the right side of the septum
(so accounting for the small ‘septal’ Q waves in left-sided ECG leads).
• Then via the Purkinje cells into the sub-endocardium of the
ventricles, and through the myocardium towards the epicardium, so
producing a co-ordinated contraction that results in the greatest cardiac output for the least energy.
This pattern of depolarization (Fig. 5.1a–c) gives rise to the different
shape of the QRS complex in the different leads (Fig. 5.2a–c).
• In the left-sided leads there is often a small Q wave, reflecting septal
depolarization (which is directed left → right, i.e. away from the leftsided leads), followed by a large R wave as the bulk of the left ventricle
(LV) depolarizes towards the left sided electrodes.
• In the right-sided leads there is a small R wave, followed by a large S
wave, as the later QRS complex is dominated by depolarization of the
large bulk of the LV rather than the small right ventricle (RV); the LV
depolarization wave moves away from the right-sided leads, leading to
a negative deflection (the S wave) in these leads.
• There are no large Q waves in the normal ECG (i.e. all Q waves are
physiological, being ≤ 2 mm depth, < 1 small square in duration or
≤ 25% of the R wave), as current passes from the endocardium to the
epicardium, i.e. always initially towards an observing electrode. The
exception to this is lead aVR, which looks ‘through’ the AV valve ‘into’
the ventricle, so observing current flow away from it, resulting in a large
Q wave.
Important properties of the QRS complex include:
• The upstroke of the QRS complex is very steep, reflecting the
fact that the specialized conducting tissue of the ventricle (the His–
Purkinje system) distributes the electrical impulse throughout the
sub-endocardial ventricular tissue very quickly, allowing myocyte
depolarization to be initiated nearly simultaneously.
• The duration of the normal QRS is short, certainly < 120 ms, though
more often < 100 ms.
• The overall vector of depolarization (Fig. 5.3a,b), termed ‘the QRS
axis’ is determined by plotting the largest R wave in two leads (often
lead I and aVF) against each other (Fig. 5.3a,b). A ‘quick’ way to determine whether the axis is normal is to look at leads I and II; if both QRS
complexes are positive, the axis is normal. Left axis deviation results in
a negative deflection in lead II and III (positive in lead I). Right axis
deviation results in a negative QRS in lead I; lead II is usually positive
but may be negative; lead III is positive.
• The size of the QRS complex is determined by: (a) the size of the
patient (fatter patients have smaller complexes); (b) the ventricular
muscle mass – the lead directly opposite the largest mass of ventricular
tissue has the largest QRS complex; (c) the age of the patient (older
patients have smaller QRS complexes for any given muscle mass).
Fig. 5.1 (a) The specialized conducting tissue of the heart allows the
depolarization wave to quickly pass throughout the heart. (b) The
sequence of ventricular depolarization. 1. Initially the septum depolarizes,
with the bulk of the movement being left to right, accounting for the vector
of depolarization being mainly left to right. 2. Subsequently the free walls
of both ventricles depolarize. The depolarization vector is dominated by
the depolarization of the left ventricle (LV) (which is much larger than the
right ventricle [RV]), and is therefore directed towards the left. 3. Finally
the terminal portions of the septum, RV and LV depolarize, giving a small
superiorly directed vector.
Fig. 5.2 (a) The size of the normal QRS complex in the chest leads. The R
wave increases initially as one progresses from lead V1 to V6, while the S
wave decreases till a maximum R wave is reached (usually around lead
V4). The maximum R wave size is in the lead overlying the largest bulk
of the left ventricle. The R wave of the QRS complex then declines
slightly in size. The transition point is where the R wave height = the S
wave depth, and is usually around lead V3. Its physiological significance
is that this is along a line extending down the interventricular septum; (b)
shows this in the typical heart. The transition point may be moved either
earlier (i.e. towards V1), termed ‘clockwise rotation’, or towards lead V6,
termed ‘anti-clockwise’ rotation. If the R wave height in the anterior leads
does not increase steadily, the term ‘poor anterior R wave progression’ is
applied (c). This can be due to obesity (which results in counter-clockwise
rotation of the heart), or to damage to the front of the heart (e.g. an old
anterior wall myocardial infarction [MI]). LA, left atrium; LV, left
ventricle; RA, right atrium; RV, right ventricle.
Fig. 5.3 (a) Determination of the QRS axis. The maximum R wave in
the QRS complex is obtained from two leads (in this example leads I and
aVF) at right angles to each other, and plotted out: the resulting angle is
measured and termed the QRS axis. (b) Normal and abnormal QRS axis.
The normal QRS complex
The normal ECG
19
6
The T and U waves
Fig.6.1
(a) Depolarization spreading outwards
Endocardium
1
(d)
Epicardium
Posterior base
2
Epicardium
A
R wave
1
2
2 1
Endocardium
Apex
B
(b) Ventricles depolarized
Fig.6.2
R
ST
segment
J
T
U
P
(c) Repolarization spreading inwards
Q
S
T wave
QRS
ST
PR
interval
segment
segment
PR
interval
Fig.6.3
20
The normal ECG
The T and U waves
QT
interval
TP
interval
P
The T wave reflects current movement during repolarization. In understanding the T wave, note that:
• The direction of depolarization is endocardial to epicardial (from
inside the heart to the outside), as the first tissue to depolarize is closest
to the specialized conducting tissue (the Purkinje cells), which lies just
under the endocardium (Fig. 6.1a–c). Depolarization moves positively
charged ions into the cell, leaving excess negative charge (electrons)
outside the cells, which flow into areas with more positive charge, i.e.
areas yet to depolarize (and then on to an observing electrode). Current
flow during depolarization is therefore endocardially to epicardially,
resulting in an R wave.
• As the action potentials of epicardial cells are shorter than those of
endocardial cells these cells, despite being activated later, repolarize
earlier, i.e. epicardial cells repolarize first, followed by endocardial
cells (Fig. 6.1a–c). Thus, though the direction of repolarization is
epicardial to endocardial, in the opposite direction to depolarization,
the current flow associated with this is endocardial to epicardial. This
current flow moves towards an observing electrode causing a positive
deflection, the T wave.
• The key principle is thus established that in health where there is an R
wave, there is an upright T (Fig. 6.3). This translates as the T wave axis
(calculated in the same way as the QRS axis – Chapter 5) should be
within 60° of the QRS axis.
• Where the R wave is equivocal or absent, the T wave polarity is
equivocal or variable; e.g. lead aVL in many people.
• The inferior leads (especially lead III, aVF) often show variable T
wave polarity, as the bulk of other parts of the heart balance out any
local inferior wall repolarizing current flow. In addition, posture affects
the inferior lead T waves – hence during an exercise test an ECG should
initially be recorded in the lying, then the standing position.
• aVR (which looks through the atrioventricular [AV] valves at the
endocardial surface of the heart) has a deep Q wave and so an inverted
T wave.
• In lead V1 (where the bulk of the posterior wall balances out currents
from the septum) there is usually only a very small, sometimes absent,
R wave, and so usually the V1 T wave is inverted.
From the above it is clear that if one sees a QRS complex with a good R
wave, but a flat or inverted T wave, then that ECG is abnormal. In determining the cause, it is actually not very helpful trying to understand the
underlying pathophysiology, though from what has been
said it is clear that the sequence of repolarization must be altered, with
either there being no endo–epicardial differences (flat T waves) or the
sequence being reversed with repolarization occurring from the endocardium to the epicardium (inverted T waves). For causes see Chapters
15, 16 and 17.
U waves are positive deflections occurring after the T wave, sometimes merging with it (Fig. 6.1a–c). The origin of the U wave is speculative. Some regard it as reflecting repolarization of papillary muscles.
Prominent U waves are normal in youth (< 35–40 years) but are rare in
those more elderly. In disease they can occur (but are not inevitable)
in hypokalaemia, left ventricular hypertrophy, those on class I antiarrhythmic drugs, mitral valve prolapse. Bizarre U waves may occur in
the extraordinarily rare hereditary long QT syndrome.
Fig. 6.1 (a–c) Sequence of depolarization and repolarization.
The diagram shows the specialized conducting tissue of the heart.
The depolarization sequence starts at the sinus node, then proceeds
through the atria to the atrioventricular (AV) node, then into the
specialized conducting system, which in the ventricles is situated
sub-endocardially. Thus depolarization proceeds in an inward →
outward direction. Repolarization proceeds in the opposite direction
to depolarization (outward → inward), but as the current associated
with repolarization moves in the opposite direction to the one
associated with depolarization (see text), an observing electrode
will see a positive deflection both for depolarization (the R wave)
in most leads, and for repolarization (the T wave). (d) Sequence of
endocardial and epicardial depolarization and repolarization. The
endocardium depolarizes first, whereas the epicardium repolarizes
first. Endocardial/epicardial differences account for the
positivity of the T wave in health (see text).
Fig. 6.2 The U wave. This ECG shows the position of the U wave.
Their origin is uncertain, and there maybe a number of physiological
explanations. Most people do not show U waves. When present, they
may be normal (e.g. the young), or, if associated with flat T waves,
may indicate hypokalaemia. If the ECG shows a long QT interval,
they may indicate hereditary long QT syndrome. They also
occur in other pathologies.
Fig. 6.3 Normal 12-lead ECG. This ECG is used to illustrate the normal T
wave. Note that wherever there is a well-developed R wave, the T wave is
clearly upright. Where there is a poor R wave, the T wave is equivocal
(e.g. lead III, V1), and in lead aVR, where there is no R wave, rather there
being a well developed Q wave, the T wave is inverted.
The T and U waves
The normal ECG
21
7
22
Abnormalities in the shape of the P wave –
left and right atrial enlargement
ECG abnormalities Abnormalities in P wave shape
The P wave shape is altered in atrial enlargement (though the relationship between ECG and cardiac ultrasound findings is not close) and
arrhythmias. The normal P wave is the sum of the right and left atrial
depolarization vectors (Fig. 7.1a,b) and is best examined in lead II
and V1:
• Lead II reflects both atria (right atrial [RA] depolarization proceeds
towards lead II, left atrial [LA] depolarization is mainly directed to lead
II). As the sinus node activates the RA first, the initial part of the P wave
reflects RA depolarization, the mid-part both, and the latter part LA
depolarization.
• Lead V1 mainly reflects LA depolarization, which moves directly
away from lead V1. Right atrial depolarization makes only a small,
initial, contribution to the P wave in lead V1.
rheumatic mitral stenosis). P mitrale is a sign of advanced, rather than
early, LA enlargement.
• As the vector of LA depolarization proceeds away from lead V1, after
a small initial positive deflection arising from the normal right atria, the
P wave is dominated by a late negative deflection (Fig. 7.1a,b). This late
negative deflection is a moderately reliable and sensitive marker of LA
enlargement.
Biatrial enlargement
Biatrial enlargement results in a combination of the above signs: a large
P wave in lead II, both early and late on, with a late negative deflection
in lead V1.
Causes of atrial enlargement
Right atrial enlargement (Fig. 7.2 and see Fig. 35.1)
The ECG is not reliable in diagnosing RA enlargement. When the
RA is enlarged depolarization takes longer (more distance to travel)
and involves greater current flows (depolarizing atrial myocytes let
in more ions, increasing current flow). The vector directed towards
lead II is:
• Larger, so the P wave in lead II becomes taller, usually ≥ 0.15 mV.
• Longer, not usually seen, as normal RA depolarization is over well
before the end of the P wave.
Lead V1 is affected by RA enlargement, but less so as the vector of RA
depolarization is at right angles to this lead. However, there is an
increased voltage here in the first two-thirds of the P wave.
The clinical situation (history/examination) and associated ECG
changes allow a diagnosis. Left atrial enlargement is common in:
• Hypertension: look for ECG left ventricular hypertrophy (LVH).
• Aortic and mitral valve lesions: listen for characteristic murmurs.
• Previous myocardial infarction (MI): Q waves or loss of R wave
height on a regional basis.
• Cardiomyopathy: non-specifically abnormal ECG or conducting
tissue disease.
Right atrial enlargement is often due to chronic obstructive pulmonary
disease (COPD)-related pulmonary hypertension and often the QRS
axis is swung to the right. Occasionally in severe pulmonary hypertension a dominant R wave in lead V1 is seen.
Left atrial enlargement (Fig. 7.3 and see Fig. 33.1)
Ectopic atrial pacemaker
In LA enlargement, the LA depolarization vector is prolonged and
increased:
• In lead II there is a long late high voltage positive deflection after the
initial RA P wave, resulting in a classic bifid shape (P mitrale, from
If the pacemaker is situated other than in the sinus node then the P wave
shape differs, according to where the pacemaker is sited (Fig. 7.1a,b).
Most ectopic pacemakers are variants of normal: sometimes their
presence indicates sinus node disease or, for low atrial pacemakers, an
atrial septal defect.
Fig. 7.1 (a) Typical findings in right, left and biatrial enlargement.
Normally right atrial (RA) depolarization occupies the first two-thirds and
left atrial (LA) depolarization the latter two-thirds of the P wave. The left
atrium accounts for the small negative terminal deflection in the P wave
of lead V1. In RA enlargement, the RA contribution is increased in size,
leading to an increased early phase of the P wave. This contribution is
positive in both lead II and V1. In LA enlargement, the late phase is
increased; this is positive in lead II (leading to the classic bifid appearance
of P mitrale – commonly found in rheumatic mitral valve disease), and
negative in lead V1 (LA depolarization is mainly away from lead V1).
A late negative deflection in lead V1 is a more sensitive sign of LA
enlargement than a bifid P wave in lead II. Biatrial enlargement leads to a
combination of these signs. (b) Findings in ectopic atrial pacemaker. The
pacemaker can move, usually within the RA, often either higher up, or,
more typically, much lower down. The ECG leads ‘in line’ with this
movement are the inferior ones, and the pattern of the ECG changes in a
predictable manner, as shown. AVN, atrioventricular node; SN, sinus node.
Fig. 7.2 An ECG showing right atrial (RA) enlargement, from a patient
with pulmonary hypertension (QRS axis shifted to the right, a dominant R
wave in lead V1, repolarization changes [inverted T waves] leads V1–V3
due to right ventricular ‘strain’). Compare with a normal ECG (see
Fig. 6.3). The abnormal P wave findings are really quite subtle; there
is a peaked P wave in lead II (so-called ‘gothic’ P wave, or P pulmonale).
What amplitude of the P wave in lead II constitutes P pulmonale is
debatable. The early positive amplitude of the P wave in lead V1 is also
increased; an early voltage in lead V1 of ≥ 0.15 mV (i.e. ≥ 1.5 mm) is
fairly suggestive. Unfortunately, most patients with RA enlargement do
not have these ECG signs, and most patients with these ECG signs do not
have RA enlargement.
Fig. 7.3 An ECG showing left atrial (LA) enlargement. Aside from the
changes to the P wave, the ECG is otherwise normal. There is a wide
(though surprisingly not bifid) P wave seen in lead II, and a large late
negative deflection in the P wave in lead V1. This comes from a patient
with severe isolated mitral stenosis, with a very large LA.
Abnormalities in P wave shape
ECG abnormalities 23