Một số đặc điểm dịch tễ học bệnh sốt xuất huyết dengue và hiệu quả mô hình giám sát chủ động vector truyền bệnh tại tỉnh bình phước tt tiếng anh
Bạn đang xem bản rút gọn của tài liệu. Xem và tải ngay bản đầy đủ của tài liệu tại đây (329.6 KB, 28 trang )
1
INTRODUCTION
For decades, dengue has been one of the most infectious diseases in many
countries and has spread to many parts of the world. The disease occurs in the
tropics and subtropics, in which Southeast Asia and the Western Pacific are the
two places with the highest incidence. It is estimated that there are about 390
million dengue hemorrhagic cases worldwide each year with 96 million people
have serious clinical manifestations. The world in general and Vietnam in
particular are looking for effective measures to control dengue fever. The
radical solution is to reduce and eliminate mosquito breeding resources. But
after many years of implementing measures to prevent dengue, the dengue
epidemic is still complicated. In 1999, the National Program against Dengue
Hemorrhagic Fever in Vietnam was established and put into operation with the
goal of reducing death, reducing morbidity, preventing epidemics and socializing
dengue fever prevention activities. Binh Phuoc is one of the provinces in the
Southeast where high prevalence of dengue fever. Although the National Dengue
Hemorrhagic Fever Project has been implemented throughout the districts,
dengue fever often arises every year, sometimes arising and spread in some
communes and wards. After many years of implementing the project, due to
budget constraints, the cooperative network only implemented in about 10% of the
communes, prioritizing the selection of communes with high disease incidence,
low educational level and economy, difficult to reach the mass media.
However, after 2013, dengue fever prevention activities have been integrated in
the activities of the health centers. Therefore, with the hypothesis that building
a volunteer network in the community along with grassroots health will help
replace the collaborator model for effective community-based dengue
prevention, we conducted research on the subject: “Some epidemiological
characteristics of dengue hemorrhagic fever and effectiveness of active
surveillance model of vector transmission in Binh Phuoc province” with the
following objectives:
1. Describe the epidemiological characteristics of dengue hemorrhagic
fever in Binh Phuoc province for the period of 2008 - 2016.
2. Evaluate the effectiveness of the dengue viral vector surveillance model
at the grassroots level for the period 2013-2016.
2
NEW CONTRIBUTIONS OF THE DISSERTATION
This study was the first to have a well-established scientific database on
the epidemiological characteristics of dengue hemorrhagic fever in Binh Phuoc
for the period 2008-2016, showing the cyclical nature of the epidemic.
At the same time, the study provides a model using grassroots health
workers and volunteers to build a vector surveillance network, prevention and
control of dengue fever in the community
LAYOUT OF THE DISSERTATION
The dissertation consists of 123 pages, 28 tables, 10 charts, 5 boxes and 123
references including 57 foreign ones. There are 3 page background, 30 pages
Literature review, 21 pages Research methodology, 35 page research results, 31
pages discussion, 3 page conclusion and 3 page recommendations.
CHAPTER 1. LITERATURE REVIEW
1.1. History of Dengue virus detection and vectorization
1.1.1. Dengue hemorrhagic fever concept
Dengue fever or Dengue hemorrhagic fever (DHF) is an acute Dengue
virus infection that is transmitted by mosquitoes and can cause major
epidemics.
1.1.2. History of virus detection and vectorization
In the years 1778 - 1780, the first recorded dengue epidemic occurred in
Asia, Africa and North America. After World War II, a dengue epidemic
appeared in Southeast Asia and has since spread throughout the world. Dengue
virus is the main cause of dengue fever. By 1906, Bancroft had demonstrated
that the main vector was Aedes aegypti. Recent studies in the Philippines,
Indonesia, and the Western Pacific have demonstrated that Aedes albopictus,
Aedes polyneiensis are also vectors that are involved in dengue transmission.
1.2. Dengue hemorrhagic fever epidemiology
Dengue has become an epidemic and is now circulating in more than 100
countries in tropical areas, Southeast Asia and the Western Pacific, Africa, and
Africa with about 2.5 billion people living in epidemic risk areas. Southeast Asia
and the Western Pacific are the two most affected regions. Dengue is one of the
major public health burdens and is a major public health concern around the
3
world. The annual number of dengue cases is estimated at 50 million people,
500,000 cases of DHF are hospitalized each year, 90% of which are under 15
years old. The average death rate is about 5%. The number of dengue cases
reported over the past 55 years has increased to 2,427 times. The worst affected
areas are Southeast Asia and the Western Pacific. In particular, countries with high
mortality and morbidity in recent years are Vietnam, Thailand, Indonesia,
Malaysia, Philippines, Singapore, Laos, Cambodia.
In Vietnam, the first dengue epidemic occurred in the North in 1958, in the
south in 1960 with the death of 60 pediatric diarrhea patients. Before 1990,
DHF occurred cyclically with an average duration of 3-4 years. After 1990, the
disease has continued with increasing intensity and scale. From 1999 to 2003,
the average number of cases was reduced to 36,826 cases and 66 deaths each
year. Peak season of DHF is from June to October every year. Between 2001
and 2011, 76.9% of dengue cases and 83.3% of dengue deaths occurred in 20
southern provinces. About 90% of deaths from DHF are below the age of 15.
Currently, the population in the DHF area is estimated at 70 million people
1.3. Some measures to control transmission vector of dengue hemorrhagic
fever
1.3.1. Chemical measure:
Use insecticides, but currently the situation of Aedes mosquito resistance
to chemicals is increasing, so sooner or later, chemical intervention will be
ineffective
1.3.2. Biological measure
Biological measures are mainly used to eliminate larvae, cut off the
infectious cycle of diseases such as Mesocyclop, water bugs, dragonfly larvae,
fungi, Wolbachia bacteria, by raising fish in water containers etc.
1.3.3. Community model involved in dengue fever prevention
Many studies of foreign authors have highly appreciated the model of
community-based dengue prevention. Community participation is integral to
dengue prevention. Social mobilization and behavior change communication
have brought many benefits to the dengue prevention program such as reducing
the frequency of dengue transmission in epidemics, helping health facilities not
to be overloaded by too many infected cases at the same time; reducing dengue
virus infection multiple times; The community plays a crucial role in rapid
action when outbreaks occur and at the same time, improve the environmental
4
health conditions. In Vietnam, since 1999, the national dengue fever prevention
and control project has been established and operated nationwide with the goal
of reducing the morbidity and morbidity of dengue. The project's main
strategy is to control community-based larvae. In order to implement this
strategy, the project focused on communication education in both direct and
indirect forms. Indirect communication is carried out through mass media
such as radio, television, newspapers, pictures etc. In this way, the project
provides the community with the most basic knowledge about Prevention of
dengue fever, with the ultimate desire is that people themselves change their
attitudes and behaviors properly in dengue prevention. However, changing
the behavior of people is a very complex matter. Therefore, in addition to the
indirect communication, the dengue fever prevention and control project has
piloted the method of direct communication in the community, monitored with
the support of local authorities. In order to effectively implement the project,
governments and health authorities at all levels work out action plans to take
appropriate measures to eliminate the source of the transmission vector at
home. Collaborators will be the intermediary in communicating the plans,
methods and basic knowledge on dengue fever control and at the same time
help people implement necessary measures to eliminate the larvae. However,
the resources of the project are insufficient to cover the entirety of the project
but only in the pilot communes which account for about 10% of communes and
wards.
1.4. Research on the effectiveness of community-based dengue prevention
activities through collaborative activities.
Assessing the effectiveness of collaborators is a complex task that
involves many aspects: from the input, the operation process, to the outputs.
Changes in people's knowledge, attitudes and behaviors, and the increase in the
number of households without larvae are the most direct, recognizable, and
most visible manifestations. Most of the studies focused only on investigating
the improvement of insect indices through household surveys before, during,
and after the intervention, without surveying the behavior of the people. Other
studies are concerned only with the behavior of people before, during and after
intervention, with little attention to insect indices.
5
CHAPTER 2
SUBJECTS AND METHODOLOGY
2.1. Research subjects
* Phase1: study the epidemiological characteristics:
- Patients with dengue fever
- Transmission vectors
* Phase 2: community intervention study:
- Volunteers are participating in the monitoring team for dengue control in
2 intervention communes.
- Heads of household s or representatives.
- Water containers and household waste.
- Transmission vectors: mosquitoes, larvae.
2.2. Research methodology
2.2.1. Study Design: M
ixed method study combining quantitative and qualitative research
2.2.1.1. Cross-sectional descriptive study: Evaluate the epidemiological
characteristics of dengue in Binh Phuoc for the period 2008 - 2016.
2.2.1.2. Community-based interventions with before and after assessment
and comparison with the control group
The main intervention in the study was the establishment of an insect
screening network at the grassroots level in two communes without
collaborators of the dengue prevention program. Commune health workers are
trained to monitor the insect indices in the commune every month. Volunteers
have been trained in basic knowledge on dengue communication, larval control
and treatment methods in the villages. Every month, volunteers visit each
household, communicate the knowledge about dengue, help people understand
the main agent to spread the disease and guide people to remove the larvae
inside and outside their houses.
2.2.2. Sample selection and sample size
- Sample size for epidemiological study: Select the entire sample
- Sample size for intervention study:
Use the formula for calculating the sample size:
{z
n=
1−α / 2
}
2p(1− p) + z1−β p1(1− p1) + p2 (1− p2)
( p1 − p2)2
2
6
The sample size was 276, in fact, there were 294 participants after
intervention and 287 participants in the control group were eligible for
inclusion in the data analysis
2.2.3. Techniques used in the study: interviews, group discussions, mosquito
larvae monitoring, adult mosquitoes, dengue diagnostic tests.
2.3.4. Data processing: Data were analyzed using SPSS 16.0 software and
statistical tests in biomedical research.
CHAPTER 3
RESEARCH RESULTS
20
6000
5237
18
5000
4000
16
3521
3470
2881
3000
2
1
0
2008
2009
1415
5
4
1000
8
1895
6
2
630
2
6
4
3
2
0
2010
2011
Number of morbidity
12
10
2346
2099
2000
14
2012
2013
2014
2015
0
2016
Number of deaths
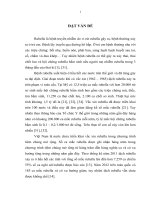
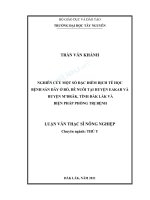
Chart 3.1. Number of morbidity/ deaths from DHF in the period 2008-2016
Chart 3.1. shows that DHF is regularly detected in Binh Phuoc province
with the number of cases fluctuates over the years. In 2008, the number of
morbidity was 3521 patients, then tended to decrease markedly in 2009 and
then increased and decreased slightly in the next 2 years. The epidemic was in
2012 with over 5000 cases but then the number of cases fell sharply and the
lowest was in 2014 and then tends to increase in the years of 2015 and 2016.
Thus, the chart has shown an evident trend of the epidemic cycle in every 4
years.
7
1200
1000
968
964
954
922
800
600
658
624.6 662
594.2
523
453
453.4 424
440.2
423
400
200
58.4
50
28
25
0
1
113
61.4
23
14
44
43.6
26
10
2
3
2008
4
257.2
198
180
124
116.4
57
29
17
5
2012
6
113
7
TB (08'‐12')
213
176
8
9
287
269.6
231
227
224
205
168.6
10
2015
11
244
197
167
131
12
2016
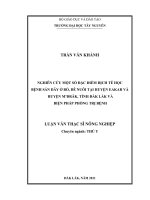
Chart 3.2. Number of dengue cases from 2008 to 2015 by the months of the
year
Chart 3.2 shows that patients with DHF occur throughout the year from
January to December. Dengue epidemic starts in May and large outbreaks occur
from June to August and then gradually reduce. In 2008 and 2012, the
incidence of DHF in Binh Phuoc province was higher than the average for
2008-2012
573.8
600
4
3.5
500
412.9
3
367.8
400
322.5
300
2
259.1
239.2
2.5
205.6
1.5
200
149.8
0.7
0.4
100
0.1
1
0.5
0.2
0.2
67.6
0.2
0.3
2013
2014
2015
0
0
0.5
0
2008
2009
2010
2011
2012
2016
Number of morbidity/100000 people
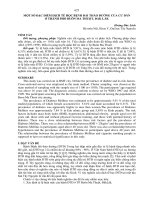
Chart 3.3. Number of morbidity/ deaths from DHF per 100000 people for the
period 2008-2016
8
The results of Chart 3.3 show that the incidence of dengue hemorrhagic
fever per 100,000 people in the years of 2008, 2012 and 2016 was the highest.
Thus, according to the population structure, the trend of epidemic cycle is still
every 4 years. However, the mortality rate tends to decrease
665.5
700
600
500
477.7
437.5
400
359.6
315.9
300
266.6
202.6
200
129.6
97.6 124.5
100
0
Binh Bu
Long Dang
Bu Bu Gia Chon Dong Hon Loc Phuoc Đong
Dop Map Thanh Phu Quan Ninh Long Xoai
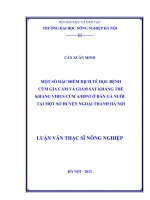
Chart 3.4. Average number of morbidity/100,000 people by living area
It is clear in Chart 3.4 that the average number of cases per 100,000
people is highest in Chon Thanh (665.5), then Dong Xoai (477.7), Hon Quan
(437.5), Dong Phu (359.6) ). Bu Dang has the lowest average number of cases
in the province
400
332
300
269
344
369
339
297
209
200
138
91
100
64
58
37
67
0
≤5
5 ->10 11->15 16-20 21-25 26-30 31-35 36-40 41-45 46-50 51-55 56-60
>60
Chart 3.5. Average number of DHF cases by age group
Chart 3.5 shows the number of cases with dengue hemorrhage fever
occurring most in the 16-20-year-old group, followed by the groups aged 11-15,
21-25, 25-30, 5-10. The group of 5-year olds had 269 cases per year, on
average. The incidence of DHF in the group of 30 years old and over gradually
decreased
9
Table 3.1. Index of households with Aedes aegypti, distributed monthly
Months
01
02
03
04
05
06
07
2008
28
30
32
38
50
56
60
2009
12
16
20
40
40
20
12
2010
12
12
36
36
8
16
20
2011
21
25
34
30
33 61.5
42
2012 17.5 17.5 17.5
33
55 23.5
43
Average 18.1 20.1 27.9 35.4 37.2 35.4 35.4
08’-12’
2013
20
20
23
35 43.5 40
25
2014 17.5 17.5 17.5 30
34
25
33
2015
8.5 10
5
23
33 28.5 20
2016 6.67 10
6.7 26.7 33.3 40
30
Years
08
09
10
11
12
54
32
44
36
36
44
36
40
20
10
50
26
42
34
26
38
22
22
36
31
25 33.5 16.5 33.5
10
42.2 29.9 32.9 31.9 22.6
21.5 13.4 11.5 11.5 23.5
30
22
32
25
20
28 33.5 27
23 11.5
30 56.7 33.3 33.3 23.3
Table 3.3 shows the index of households with larvae found highest in the
years of 2008, 2009, 2011 and 2016. In these years, larvae indexes in most
months were higher compared to the average of 5 years from 2008 to 2012. In
the rainy season, this index increased quite high compared to in the dry season.
Table 3.2. Index of water containers having Aedes larvae in 100 investigated
households, distributed monthly in the period 2008-2016
Years
01
02
03
04
28
30
38
42
24
28
30
50
20
16
46
48
22.5 29
25 39.5
30 37.5 31.5 78
05
92
30
10
51
75
Months
06
07
102 104
24
24
30
40
99 128
23.5 70
08
94
84
120
38
43
09
78
50
50
32
41.5
10
72
46
44
28
20
11
62
36
38
50
43
2008
2009
2010
2011
2012
Average
24.9 28.1 34.1 51.5 51.6 55.7 73.2 75.8 50.3 42 45.8
08’-12’
2013
25
20 33.5 40 46.5 58
25
28 16.5 11.5 11.5
2014 17.5 15
20 31.5 22.5 28
38
35 26.5 45 36.5
2015
8.5 11.5 5 23.5 36.5 36.5 20
30 43.5 33.5 25
2016
7
10
10
27
47
53
40
43 123 47
57
12
62
30
34
35
10
34.2
23.5
25
11.5
27
10
The Breteau index of months in the year 2008 was much higher than the
average of 5 years (2008-2012). In the years of 2010, 2011 and 2016, peaks of
BI index in the rainy season were higher than the average.
Table 3.3. Index of households with Aedesaegypti mosquito, distributed
monthly
Months
Years
01
02
03
04
2008
10
10
2009
10
13.3 13.3
16
24
10
10
2010
10
6.7
20
6.7
10
13.3
35
13.3 23.3
20
2011
13.5 17.5 21.5
23
2012
13.5 13.5 22.5
20
Average
08’-12’
2013
30
06
07
08
09
10
11
12
36.7 43.3 53.3 43.3 33.3 26.7 26.7
36.7 26.7 23.3
30
32.5 33.5 23.3
36.5 16.5
20
15
16.7 13.3
15
10
13.3
10
6.7
16.5 11.5
23.5 13.5
30
15
7
11.4 12.2 18.12 20.46 26.44 21.14 24.02 31.66 25.04 19.98 17.64 13.74
12 9.985 21.5 29.95
2014
13.5
30
7
2015
5
13.5
5
2016
05
33.5
22
22
21.5 21.5
25
11.5
20
16.5 31.5 31.5
17
33.5
20
20
23.3 36.67
35
6.67 6.67 3.33 26.67
30
30
33.3
16.5 16.5
20
15
30
22
15
21.5 11.5
30
15
16.67 16.67
Table 3.7 shows that from 2008 to 2016, the index of households with
Aedes aegypti mosquito have always been quite high and are in danger signs of
epidemics in each month, the peak of epidemic outbreaks is from April and
May to September and October every year. Compared with the five-year
average (2008 - 2012), in the years of 2008, 2011 and 2016, the number of
households with Aedes aegypti mosquitoes increased in the rainy season.
Particularly, there were two peaks in August and September 2008 and
September 2016, with the number of mosquitoes rising by about 40% to nearly
60% of the surveyed houses
.
11
2.5
0
7.5
D1
D2
D3
D4
90
0
Chart 3.66. Structu
ure of den
ngue hem
morrhagicc fever viirus typess
Thhe above chart shoows that 90%
9
of seeropositivve seropreevalence cases aree
dengue type
t
D1, the
t rest arre type 2 and 4
3.2. Devvelop a deengue vecctor survveillance unit at th
he grassrroots leveel and
evaluatee the effectivenesss of the in
nterventiion
3.2.1. Deevelop a dengue
d
veector surrveillancee unit
Studdy on buiilding a self-mana
s
aged vecttor surveiillance unnit. The commune
c
e
health station is th
he unit thhat directly perform
ms the intterdiscipliinary co-ooperation
n
and simuultaneoussly manaages and supervisees the acctivities of
o the voolunteers.
Volunteeer networrk plays an
a importtant role in
i the proogram annd is centrral to thee
program. The neetwork off volunteeers is baased on village
v
heealth worrkers and
d
local autthorities
In order
o
to develop
d
ann organizzational syystem forr the impllementation of thee
program on denggue preveention, 2 commune health workers, 15 villagge health
h
workers were traiined to bee supervissors and 445 villagee unions and 34 volunteerss
mplementting the program.
p
These people wouuld be thee
were alsoo trained before im
core grooup of thhe prograam. Villaage healthh workerrs, hamleet leaderss, villagee
youth unnions, haamlet leaders and volunteeers were trained by district health
h
centers on progrram activvities, inncluding identifyinng larvaee and soources off
larvae, identifyinng signs of
o the dissease, heealth educcation annd commuunication
n
measuress and the vector suurveillancce activities in the communiity.
12
Table 3.4.Collaborators’ activities to mobilize the community participation
during the implementation of the intervention
Content
Number of village health workers, hamlet women,
commune youth union, hamlet leader participating in the
DHF prevention program
Average number of households a collaborator must
manage
Rate of signed commitments on DHF prevention between
the local authorities and households
Number of leaflets on DHF distributed (1 time / year x 2
in 2013, 2015)
Number of broadcasts on DHF (1 month / time x 2 years)
Number of meetings for propaganda (6 months / hamlet)
Number of posters of DHF hung in public areas
Thanh Phu Phu Thinh
Commune Commune
11
4
43
52
100
100
4.520
2.410
528
88
14
192
32
7
Activities of the intervention program on DHF prevention
Health education and communication programs aiming at: Improving people's
knowledge and practice on early identification of DHF disease, changing their
wrong attitudes and opinions, changing risk behaviors on dengue prevention
and control. This program is implemented through target audience analysis to
create media products. In addition, the communication toolkit is designed based
on official letters, decisions and directives on the strengthening of DHF
prevention measures in Vietnam.
Communication products
(1) Commitments: The commitment is signed by the household head, the
collaborator, the program supervisor and leader of the Commune People's
Committee. The commitment is to instruct villagers to carry out activities to
eliminate larvae and prevent mosquito bites.
(2) Leaflets: Leaflets were designed with two sides with specific
instructions, help people know how to prevent DHF, recognize the disease early
and guide how to handle. Leaflets were distributed to each household.
(3) Poster: large size posters are hang in crowded areas to attract people's
attentions. The posters specifically guide the development cycle of vectors and
measures to eliminate mosquito larvae.
13
3.2.2. Effectiveness of improving knowledge, attitudes and practices of the people
Table 3.5. Comparing the understanding of the causes of DHF
Intervention group
Control group
Intervention
(n=294)
(n=287)
Content
effectiveness
(%)
Before After
p
Before After
p
270
276
265
269
Heard about n
>0.05
>0.05
0.1
DHF
% 91.8 96.5
92.3
97.1
DHF caused n
271
274
264
267
by mosquito
>0.05
>0.05
0.01
% 92.2 93.2
92.0
93.0
bites
The table above shows that most of the subjects have been heard about
and known that dengue is transmitted by mosquitoes (over 90%)
Table 3.6. Comparison of sources of information on dengue fever for the
study population
Information
supply source
Television
Radio
Pictures
Books,
newspapers
Public
speakers
Health staff
Collaborators
Authority,
unions
Intervention group
(n=294)
Before After
p
n
%
n
%
n
%
n
%
n
%
234
79.6
76
25.9
19
6.5
48
16.3
105
35.7
247
84.0
83
28.2
109
37.1
53
18.0
247
84.0
n
88
226
%
n
%
n
%
29.9
46
15.6
16
5.4
76.9
243
82.7
74
25.2
> 0.05
> 0.05
< 0.05
> 0.05
< 0.05
< 0.05
< 0.05
< 0.05
Control group
(n=287)
Before After
p
246
85.7
71
24.7
8
2.8
34
11.9
81
28.2
259
90.2
80
27.9
6
2.1
42
14.6
85
29.6
38
46
13.2
41
14.3
7
2.4
16.0
45
15.7
9
3.1
HQCT
(%)
> 0.05
0.3
> 0.05
3.7
> 0.05
495
> 0.05
13
> 0.05
130
> 0.05
136
> 0.05
420
> 0.05
339
14
Results from Table 3.15 show that the sources of information that people
were provided about dengue before our intervention are mainly from television.
After intervention, the information on DHF that people were provided from
photographs, loudspeakers, health workers and from local organizations and unions
organizations increased in the group of intervention. The difference with p <0.05.
Table 3.7. Comparison of knowledge about dengue disease awareness and
management
Intervention group
(n=294)
Before After
p
Hiểu biết đúng
Control group
(n=287)
Before After
p
Disease recognition
n
89
131
148
154
Continuous high
< 0.05
fever
%
30.3
44.6
51.6
53.7
n
113
139
127
131
Skin bruising
< 0.05
%
38.4
74.3
44.3
45.6
Knowledge about how to handle when a family member gets DHF
Get medical
n
102
226
186
220
examination and
< 0.05
%
34.7
76.9
64.8
76.7
treatment
HQCT
(%)
> 0.05
43
> 0.05
90.3
< 0.05
103
The results of Table 3.16 also show that, after intervention, people have
better understanding of the signs of DHF disease (p<0.05). The rate of people
with correct handling knowledge when their family member gets DHF has
doubled compared to before intervention (34.7% versus 76.9%) with the
intervention effectiveness of 103%.
Table 3.8. Rate of people accepted or supported actions to protect water
resources from insects or larvae
Action
Fish raising
Water containers
rinsed and cleaned
regularly
Get rid of water
with larvae
Intervention group
Control group
(n=294)
(n=287)
Before After
p
Before After
p
n
68
171
113
136
> 0.05
< 0.05
% 23.1 58.2
39.4
47.1
n
212
283
264
278
> 0.05
< 0.05
% 72.1 96.3
92.0
96.9
n
216
279
%
73.5
94.9
< 0.05
268
277
93.4
96.5
> 0.05
HQCT
(%)
132
28
25.8
15
n 221
282
261
278
Keep water
> 0.05
21.0
< 0.05
containers closed
% 75.2
95.9
90.9
96.9
n 194
288
260
278
Cleaning water
> 0.05
41.6
<0.05
waste
% 66.0 98.0
90.6
96.9
Table 3.20 show that people have had a very positive attitude towards the
protection of water resources, prevention of larvae living. The difference was
statistically significant when compared before and after intervention in the
intervention group (p <0.05). In the control group, the difference was not statistically
significant because the subjects have already had good attitude (p> 0.05).
Table 3.9. Evaluate the effectiveness of inspection activities where the larvae live
Intervention group
Control group
HQCT
(n=294)
(n=287)
Properly practice
(%)
Before After
p
Before After
p
n
123
258
213
262
Check larvae
> 0.05 86.8
< 0.05
%
41.8
87.8
74.2
91.3
n
106
222
210
240
Check larvae
> 0.05 97.9
< 0.05
weekly
%
36.1
76.5
73.2
83.6
Table 3.21 shows that after intervention more than 80% of the study subjects
had larvae tested, 76.5% checked larvae in their water containers weekly.
Intervention effectiveness was 86.8% and 97.9%, respectively
Table 3.10. Practice of the study subjects on killing larvae and mosquitoes
Content
Destroy the
container
Use mosquito
incense
Use mosquito
spray
Use mosquito
rackets or lamps
n
%
n
%
n
%
n
%
Intervention group
Control group
HQCT
(n=294)
(n=287)
(%)
Before After
p
Before After
p
110
260
231
272
> 0.05 118.6
< 0.05
37.4
88.4
80.5 94.8
103
129
96
115
> 0.05
> 0.05 5.4
35.0
43.9
33.5 40.1
97
114
109
120
> 0.05
> 0.05 7.5
33.0
38.8
38.0 41.8
21
24
21
27
> 0.05
> 0.05 13.7
7.1
8.2
7.3
9.4
Table 3.22 shows that after intervention, the larvae killing and controlling
practice of the study subjects was better than before intervention (p <0.05). The forms
of mosquitoes controlling and prevention do not differ much between groups.
16
3.2.3. Effectiveness on improving monitoring indexes
Table 3.11. Compare the incidence number and incidence rate of dengue in
two groups of communes
Intervention commune
Control commune
p
Years Incidence Incidence rate/ Incidence Incidence rate/
number 100,000 people number 100,000 people
2012
153
927.3
297
1117.2
>0.05
2013
14
84.6
20
82.0
>0.05
2014
4
24.2
9
36.9
<0.05
2015
8
48.5
36
147.5
<0.05
2016
4
24.2
29
118.9
<0.05
Table 3.23 shows that in 2012, there was no difference in the incidence
rate of dengue fever in the two groups of communes. However, since 2014, the
intervention commune group has had a significantly lower rate of morbidity
compared to the group of communes with collaborators from the DHF
prevention program. The difference was statistically significant with p <0.05.
Table 3.12. Comparison of the monitoring results of the index of households
with larvae
Intervention District’s regular
Months
p
group
monitoring points
9/2013
5.0
16.7
<0.05
10/2013
1.2
12.4
<0.05
11/2013
3.7
13.3
<0.05
12/2013
1.7
10.0
<0.05
1/2014
0
20.0
<0.05
2/2014
0.8
26.7
<0.05
3/2014
0
2.7
<0.05
4/2014
0.8
2.0
<0.05
5/2014
2.1
3.7
<0.05
6/2014
3.3
5.1
<0.05
7/2014
6.7
9.6
<0.05
8/2014
4.2
9.9
<0.05
Table 3.24 shows that the index of households with larvae in the
intervention group was lower than that of the distric’s regular surveillance
resultst in all months of the year (P <0.05). The most obvious difference is
between October 2013 and February 2014
17
Table 3.13. Comparison of the monitoring results of the index of water
containers with larvae
Intervention
District’s regular
Months
p
group
monitoring points
9/2013
3.0
6.5
<0.05
10/2013
0.7
10.0
<0.05
11/2013
1.5
3.1
<0.05
12/2013
0.6
2.6
<0.05
1/2014
0.0
10.0
<0.05
2/2014
0.8
10.4
<0.05
3/2014
0.0
10.0
<0.05
4/2014
0.3
6.7
<0.05
5/2014
1.2
13.3
<0.05
6/2014
0.9
10.0
<0.05
7/2014
2.5
30.0
<0.05
8/2014
2.1
20.0
<0.05
According to Table 3.25, the index of water containers with larvae in the
two intervention communes was much lower than that of the district's regular
monitoring points.
Table 3.14. Comparison of the monitoring results of the index of mosquito
density
Intervention
District’s regular
p
Months
group
monitoring points
9/2013
0.05
0.2
<0.05
10/2013
0.01
0.1
<0.05
11/2013
0.01
0.1
<0.05
12/2013
0.00
0.2
<0.05
1/2014
0.01
0.3
<0.05
2/2014
0.02
0.4
<0.05
3/2014
0.01
0.0
>0.05
4/2014
0.05
0.1
<0.05
5/2014
0.03
0.1
<0.05
6/2014
0.03
0.2
<0.05
7/2014
0.02
0.3
<0.05
8/2014
0.03
0.3
<0.05
18
Table 3.27 shows that the index of density of mosquitoes in the two
intervention communes was much lower than that of the district’s regular
monitoring point. The difference was statistically significant in all months with
p <0.05
Table 3.15. Comparison of the monitoring results of the index of households
with female adult Aedes aegypti
District’s regular
Months
Intervention group
p
monitoring points
9/2013
3.3
20.0
<0.05
10/2013
0.4
13.3
<0.05
11/2013
0.8
13.3
<0.05
12/2013
0.4
16.7
<0.05
1/2014
0.8
20.0
<0.05
2/2014
1.7
40.0
<0.05
3/2014
1.2
3.3
<0.05
4/2014
4.5
6.7
<0.05
5/2014
2.9
10.0
<0.05
6/2014
2.1
20.0
<0.05
7/2014
1.7
20.0
<0.05
8/2014
2.8
23.3
<0.05
Table 3.28 shows that the index of houses with female adult Aedes
aegypti mosquitoes in the two intervention communes was also much lower
than the regular monitoring points of the district. The difference was
statistically significant in all months with p<0.05. This difference is particularly
evident in the months of January and February of 2014.
CHAPTER 4. DISCUSSIONS
4.1. Epidemiological characteristics of Dengue hemorrhagic fever in Binh
Phuoc for the period 2008 - 2016
The study on dengue fever in Binh Phuoc province in the period 2008 2016 shows that Binh Phuoc Province is constantly experiencing dengue cases
with different changes each year. In the past 10 years (2008 - 2016), the epidemic
cycle in Binh Phuoc was not the same as the general situation in the southern
19
provinces that the peak of the epidemic occured every 10 years. In Binh Phuoc
province, DHF epidemic cycle is relatively clear with an average period of every
4 years, typical occurred in 2008 and 2012. In 2008, the number of DHF infected
was 3,521, this number tended to decrease markedly in 2009 and then increased
and decreased slightly in the next 2 years. The peak of the epidemic occurred in
2012 with more than 5,000 cases, but then the number of cases fell sharply and to
the lowest in 2014 and then tended to increase in 2015 and 2016. The number of
deaths due to dengue fluctuates differently and does not correspond to the
number of infected. The number of deaths varied from 1 to 6 per year. In 2014,
despite the very low incidence, there were still 2 deaths due to dengue. Cycle
characteristics of the epidemic in Binh Phuoc are similar to that of the southern
provinces of Ca Mau, Dong Thap and Dong Nai which outbreak every 4 years
but they are different from those in the central provinces of Nghe An, Quang Tri
with an average period of every 2 to 5 years
The mortality rate due to DHF per 100,000 people also partly helped assess
the results of DHF prevention activities in Binh Phuoc province. The mortality /
morbidity from DHF in Binh Phuoc is pretty low compared to that in other
provinces. This result is also due to the early surveillance, detection and timely
treatment.
Analyzing cases of DHF over the years to find out the risk season in order
to provide active and timely response in DFP prevention program is a very
necessary and essential task. The results of our study show that patients get DHF
throughout the year from January to December. However, Dengue epidemic
starts from May and June to August with large outbreaks and then gradually
decrease. On average, there are 600 cases per peak month. In 2008 and 2012, the
incidence of DHF in Binh Phuoc province was higher than the average of five
years from 2008 to 2012. On average, in the peak months, there are up to 400600 cases per month. In 2015, the performance curve is lower than average but
there is a slightly different trend. The incidence was very low in the months of
January, February, March and April then increased gradually from June and
increased to the highest number in October and the epidemic peak remained
unclear. By 2016, the line is essentially the same as in the years of 2008-2012
and is higher than the 5-year average. Thus, dengue circulates all year round, but
in the dry season, the number of cases is lower, and it starts to increase in the
rainy season. This shows that the seasonal distribution of DHF is constant. The
distribution of cases per month of Binh Phuoc is consistent with the situation of
20
DHF on a national scale and similar to the study of many domestic authors
studying the epidemiology of dengue in the provinces in the region. However, in
2015, dengue fever characteristics of patients in Binh Phuoc province are
different from those of the previous years. The number of cases of dengue fever
began to rise 2 months later. The epidemic began to increase from July and the
peak occurred continuously in September, October, November and December.
This may be explained that in 2014, the incidence of dengue fever in Binh Phuoc
decreased much lower than the previous year so when the next epidemic cycle
occurred, it may increase more slowly. However, the problem is that in December,
the time when the dry season in Binh Phuoc starts, the dengue fever rate is still
high, which is the highrisk of outbreaks in the next year.Iindeed, the data of 2016
and the first 6 months of 2017 confirmed the four-year cycle of dengue.
Based on the number of cases of dengue hemorrhagic fever per 100,000
population, our study shows that the incidence is highest in the years of 2008,
2012 and 2016. Thus, according to the population structure, the trend of the
epidemic cycle is still every 4 years. However, the mortality rate tends to decrease.
Le Van Tuan in his research showed that in the Central Highlands in 20112015, they got the same results of DHF epidemic. The disease occurs in all months
of the year with the incidence number increased from May to November, the peak
was in July. Most cases are dengue hemorrhagic fever and Dengue hemorrhagic
fever accompanied by warning signs and occurred on those over 15 years old.
There were simultaneous circulations of all four types of Dengue virus, in which
DEN-1 was the most common type in 2011 and 2015, DEN-2 causes the disease
outbreak in 2012 and 2013; DEN-3 was the most common type in 2014.
4.2. Establishing a dengue vector surveillance unit at the grassroots level
and effectiveness of interventions in the period 2013-2016
Dengue hemorrhagic fever contributes to the socio-economic burden,
including the direct costs of treating patients and the economic loss to patients
and their relatives who have to work leave for their care. Damage caused by the
cost of destroying and killing dengue hemorrhagic fever vertor transmission in
epidemics and affecting tourism. Therefore, the mobilization of community
participation using vector control measures is considered the leading measure in
dengue fever prevention.
The community-based dengue vector-control model we developed in this
study was set up to transfer the monitoring role from commune health staff to
hamlet health clinics to ensure the continuity. The role of selected collaborators
21
will shift from village health workers to the role for government, unions and
volunteers. In the past, collaborators were the hamlet health care provider, so the
number of households that each collaborator managed was usually from 100-150
households, so they often did not have enough time to visit the household every
month. Therefore, in this study, thanks to the mobilization of community
resources, each collaborator of the program is responsible for not more than 50
households in the place where he or she lives. This helps collaborators visit and
communicate with the households to monitor larvae in their water containers
better and more regularly. In the study done by Do Kien Quoc in four provinces
representing the southern ecological area, in fact the collaborators managed too
many households, so the percentage of households visited monthly only accounts
for 59.16%. The low monthly household visit rate will affect the model's
communication efficiency.
In our study, the sources of information that people provided about DHF
before the intervention were mainly from television (79.8%) in the intervention
group and 85.7% in the control group. Followed by information from speakers,
health workers, collaborators. After the intervention, the sources of information
provided from the pictures, loudspeakers, health workers and from local
authority and unions increased significantly in the intervention group. The
difference was statistically significant with p <0.05. There was no significant
difference in the control group.
The DHF prevention program has been effective in not only improving the
knowledge, attitudes and practice of local people, but also in controlling dengue
vector thereby reducing the number of dengue cases. Dengue hemorrhagic fever
vector control has been shown to be significantly effective as the vertor indexes
investigated in households decreased after intervention. The index of households
with larvae in the intervention group was lower than that of the district's regular
monitoring points in all months of the year (p<0.05). The most obvious
difference is between October 2013 and February 2014. The highest index of
water containers with larvae in the 100 surveyed households (Bis) in the two
intervention communes found in July 2014 is only 6.6, much lower than the
district's regular monitoring points. The difference was statistically significant in
all months with p<0.05. Compared with the Dengue Vector Surveillance Guidelines
of the Ministry of Health of Viet Nam and the World Health Organization’
surveillance guidelines, the BI of our study is much lower than the threshold for
the risk of DHF outbreaks (BI <50) and lower than the safety threshold (BI <20),
22
so there were no outbreaks in both communes. The index of mosquito density in the
two intervention communes is also much lower than that of the district monitoring
point. The difference was statistically significant inall months with p<0.05. The
index of Aedes aegypti female adult mosquitoes in the two intervention
communes is also much lower than the regular monitoring points of the district.
The difference was statistically significant in all months with p<0.05. This difference
is particularly evident in the months of January and February of 2014.
In our study, thanks to the effectiveness of vector control, there is no
difference in the incidence of dengue fever in the two groups of people in 2012
and 2013. However, in 2014, the intervention commune group had a dengue
vector surveillance team at the grassroots level, which helped this group have a
significantly lower incidence than in the control group. The difference was
statistically significant with p <0.05. However, in 2014, Binh Phuoc province had
the lowest number of dengue cases (630 cases), although in the intervention
commune showed the effectiveness of controlling dengue hemorrhagic fever
vector and the reduction in dengue cases, so this can cause interference due to the
reduction in the overall incidence. Therefore, we kept monitoring the incidence
numbers in the years of 2015 and 2016 in the field study. The results show that
when the province's overall dengue incidence number increases from 2015 and
increases rapidly in 2016, the number of dengue cases in the study area still
remained unchanged and decreased in 2016. This clearly demonstrated the
sustained effectiveness of the community mobilization model in preventing
dengue locally in our study.
The role of collaborators and volunteers in prevention activities is very
important. They are the people, who convey knowledge and help people realize
that they themselves have raised mosquitoes and mosquitoes in the home causing
serious illnesses for themselves and their families, thereby transforming into selfcleaning behaviours in cleaning larvae containers. Each project commune has
established a network of collaborators working directly with the household heads
to implement and monitor the project activities. Collaborators are local people
who wish to work in public health, have sufficient time to visit families, have the
ability to learn new technologies and preventive measures against dengue and
work enthusiastically with a modest monthly allowance. However, the national
dengue fever prevention program has not developed a system of collaborators in
all communes but only in pilot communes. In addition, the collaborators must
comply with the regulations in monitoring such as submitting regular reports and
23
joining regular meetings. This work takes more time so many people hesitate to
do. Therefore, the choice of collaborators in the community is often inappropriate.
Many people who have an important role in the community, have the ability to
communicate persuasively, are afraid to do or may be illiterate so they do not meet
the implementation of administrative procedures such as monthly activity reports.
In our study, our volunteers were highly valued for their flexibility and more
time spent on communication and community monitoring activities. District and
commune health staff all assessed the implementation of pest monitoring at the
grassroots level helped better the epidemic monitoring activity as they have a
better understanding of the role and responsibility of the job The results of
monitoring insects is a specific indicator for the commune that helps to forecast
dengue more accurately and commune officials can assess the risk of DHF
epidemic in their locals. However, the difficulty in implementing this model at the
grassroots level is the human resource and payment for those participating in
insect monitoring activities.
CONCLUSION
1. Epidemiological characteristics of Dengue hemorrhagic fever in Binh
Phuoc for the period 2008 - 2016
- From 2008 to 2016, DHF circulated in all years, epidemics tend to change
from 3 years to 4 years. This is a seasonal disease which occurs from May to
November every year, the highest incidence is in July, August and September. In
2008, the number of infected cases was 3,521, then tended to decrease markedly in
2009 and then increased and decreased lightly in the next 2 years. In this stage, the
peak was in 2012 with over 5,000 cases ((572.8/100,000 people) but then the
number of cases fell sharply and to the lowest in 2014 (67.6/100,000 people) then
tended to increase in 2015 and 2016.
- Insect monitoring indicators are also consistent with the dengue cycle over
the years.
- DHF subjects: People of all age groups were at risk for the disease but the
number of cases with dengue hemorrhage fever occurring most in the 16-20-yearold group, followed by the groups aged 11-15, 21-25, 25-30, and 5-10. The
incidence of the group under 15 years of age tends to decrease from 45.6% in 2008
to 33.7% in 2016.
- The main DHF virus type in Binh Phuoc province is DEN - 1.
24
2. Building a dengue vector surveillance unit at the grassroots level and
assessing the effectiveness of interventions for the period 2013-2016
- The study has developed a vector monitoring team with a commune health
station as a unit that directly performs interdisciplinary co-operation and manages
and supervises the activities of volunteers. Volunteer networks play an important
role in the program and are the central to the program. The network of volunteers
is based on a team of village health workers who oversee the grassroots
community, local organizations, unions and volunteers. The activities of the
volunteers have helped improve people's knowledge and practice on early
identification of the disease, change their attitude and change risk behaviors on
dengue prevention and control.
- After the intervention, the information provided for people from the
pictures, loudspeakers, health workers, from the administration groups and unions
increased in the intervention group. The difference was statistically significant
with p<0.05. The rate of people with correct handling knowledge when their
family member gets DHF has doubled compared to before intervention (34.7%
versus 76.9%) with the intervention effectiveness of 103%. More than 50% of
villagers evaluated killing mosquito larvae was an effective way against dengue,
better than killing mosquitoes.
- Over 80% of the respondents after the intervention had larvae checked in
which 76.5% checked weekly. The difference before and after the intervention is
very clear at p<0.05 and the intervention effectiveness was 86.8% and 97.9%
respectively.
- In the commune intervention group with a DHF vector control unit at the
grassroots level, the DHF incidence was significantly lower than that in the control
group. The difference was statistically significant with p <0.05.
RECOMMENDATIONS
- With the DHF epidemic cycle every 4 years, Binh Phuoc province needs to
develop forecasting charts to be able to have active plans in dengue prevention in
the community.
- Expand the model of surveillance and management of dengue vector
transmission by mobilizing community resources, raising the responsibility and
activeness of the community in preventing epidemics in the locality.