Đánh giá kết quả điều trị của thuốc sorafenib trên bệnh nhân ung thư gan nguyên phát (TT ANH)
Bạn đang xem bản rút gọn của tài liệu. Xem và tải ngay bản đầy đủ của tài liệu tại đây (477.54 KB, 28 trang )
MINISTRY OF EDUCATION AND TRAINING
MINISTRY OF HEALTH
HANOI MEDICAL UNIVERSITY
HUONG NGUYEN THI THU
ASSESSMENT OF TREATMENT EFFICACY OF
HEPATOCELLULAR CARCINOMA PATIENTS
TREATED WITH SORAFENIB
Specialty: Oncology
Code: 62720149
SUMMARY OF PhD. THESIS IN MEDICINET
HA NOI – 2020
1
INTRODUCTION
Primary liver cancer or hepatocellular carcinoma (HCC) is the
sixth most common cancer worldwide and is the second leading cause of
cancer-related death worldwide. According to Globocan 2018, each year,
there are 841,080 new cases in the world, of which 83% are in developing
countries. Vietnam, where HCC ranks first in terms of incidence rate,
takes the fourth place worldwide, after Mongolia, Egypt, and Gambia. In
Vietnam, HCC standardized age incidence rates are 39.0/100 000 people
in males and 9.5/100 000 people in females.
Although there have been many advances in diagnosis and
treatment of HCC, the treatment outcome has still been limited. The
prognosis is extremely poor, with the mortality rate being roughly
equivalent to the incidence, and the mean overall survival in all stages is
from 6 months to 20 months. The combination of cancer and preexisting
cirrhosis might lead to serious complications and add significant
complexity to treatment.
HCC is often diagnosed at an advanced stage, in which curative
treatment by surgical resection or liver transplantation are not feasible. In
this stage, treatment options are limited and systemic chemotherapy
cannot prove its benefits. Sorafenib, an oral multi-tyrosine kinase
inhibitor, is the first drug to demonstrate survival benefits through 2
studies: SHARP (the Sorafenib Hepatocellular Carcinoma Assessment
Randomized Protocol trial) and AP (the Asia- Pacific trial) in 2007. The
result showed that sorafenib reduced the risk of death by 31%, improved
the progression-free survival to 5.5 months compared to 2.8 months in the
placebo group, as well as increased the overall survival (OS) by an
average of 10.7 months. Since 2008, many new drugs have been studied
but there have been no agents that could demonstrate a significant benefit
compared to sorafenib in the first-line treatment of advanced-stage HCC.
However, because of the remarkable financial burden of treatment as well
as the risk of toxicities on patients with an underlying chronic liver
disease, the indication of sorafenib should be carefully considered in each
case. In Vietnam, the use sorafenib has been approved by Vietnamese
Ministry of Health since 2009. There have been several studies assessing
the initial efficacy of the drug with the OS ranging from 5.2 months to
10.7 months. However, these studies only had a small sample size of 15 to
25 patients, thus the efficacy of sorafenib could not be fully assessed and
the predictive factors of treatment outcome have not been identified
2
especially in Vietnamese patients. Hence, we performed this study:
“Assessment of treatment efficacy of HCC patients treated with
sorafenib” with two objectives:
1. Assessing the efficacy and adverse events of sorafenib treatment
in HCC patients
2. Evaluating some factors affecting the treatment outcome of
sorafenib
NEW CONTRIBUTION OF THESIS
1. This is the first study in Vietnam with an adequate sample size to
provide the most sufficient result of sorafenib treatment and
factors affecting the treatment efficacy in HCC patients in
Vietnam, and also the first study discussing controversial issues
in terms of sorafenib treatment in Vietnam.
2. The results showed that:
The median overall survival was 7.13 months, the proportions of 1year and 5-year OS were 36% and 5%, respectively. The median progressionfree survival (PFS) was 4.57 months. The percentages of 1-year and 5-year
PFS were 23% and 2, respectively. The response rate was low (4.5%), the
disease control rate (DCR) reached 59% and the response rates according to
AFP was 4.9%
Toxicities: toxicities were very common (78%), however the
majority of which were level 1 and 2, level 3 was found in lower than
10% of patients and level 4 toxicities were not recorded. Common
toxicities includes hand-foot skin reaction (36.4%), fatigue (25.5%) and
elevated liver enzymes (32.7%). Toxicities delayed treatment in 22.7%
patients, led to dose decrease in 26.4%, and there was no case of
treatment cessation due to toxicities.
Factors affecting survival: Multivariate analysis of negative
affecting PFS are PS = 1, liver tumors > 60 mm, distant external hepatic
metastases. Multivariate analysis of negative factors affecting OS include
hepatitis B virus, liver tumors> 60 mm, distant external hepatic
metastases, Child-Pugh B, increase AST/ALT toxicity; the positive factor
affecting OS is hypertension during treatment.
STRUCTURE OF THESIS
The thesis includes 132 pages and consist of: Introduction (2
pages), Chapter 1: Overview (40 pages), Chapter 2: Subjects and methods
3
(16 pages), Chapter 3: Results (32 pages), Chapter 4: Discussion (38
pages), Conclusion (2 pages), Recommendation (1 page). In this thesis,
there are 44 tables, 13 graphs and 2 figure. References contain 167
documents (14 in Vietnamese and 153 in English). The appendix includes
patient list, illustration pictures, study parameters and standards, case
report form, questionaire, letters and informed consent of patients.
CHAPTER 1: OVERVIEW
1.1. Epidemiology and etiological factors
1.2. Diagnosis
- Diagnosis guideline: there hasn’t been any consensus in the world
but the majority agreed with using hyper-enhancement feature of tumours
on contrast imaging techniques as a diagnosis method without biopsy
confirmation.
- Staging: while there is no universally accepted staging system,
the Americas Hepato- Pancreato- Biliary Association proposes to use
TNM classification for patients after operation and liver transplant and
Barcelona Clinic Liver Cancer (BCLC) for advanced stage.
1.3. Treatment
1.3.1. Treatment methods
- Surgical resection, liver transplant: curative methods with early stages.
- Local ablation methods include percutaneous ethanol injection
(PEI), percutaneous acetic acid injection, radiofrequency ablation (RFA),
microwave ablation, radiation therapy; which are effective for lesions at
early stages not amenable to surgery.
- Embolization methods including transarterial chemoembolization
(TACE), radioembolization are effective with intermediate stage HCC.
- Systemic therapy, especially targeted agents (sorafenib) is a
turning-point of advanced HCC treatment.
1.3.2. Advanced HCC treatment
- First-line: sorafenib and lencatinib can be indicated
- Second-line: regorafenib, cabozantinibm nivolumab, pemprolizumab
and ramucirumab.
- The role of chemotherapy is limited
- Local treatments (TACE, radioembolization) are initially assessed
in several studies.
1.4. The role of sorafenib in HCC treatment
- Single-agent Sorafenib: before 2018, sorafenib was the only drug
demonstrating treatment efficacy in advanced HCC through 2 trials the
SHARP and AP (2007). These were 2 randomized double-blind,
4
controlled, multi-center phase III trials. Results showed that sorafenib
improved median OS from 6.5 months to 10.7 months and educed
mortality risk by 31%. This drug was safe and its adverse effects could be
controlled.
After the SHARP and AP trials, the role of sorafenib continued to
be demonstrated in other trials worldwide such as some multicenter
studies in Italy (2013), Japan (2015), GIDEON (ongoing with the number
of patients up to 3000), STELLA and INSIGHT studies in Germany. In
these studies, the results more clearly demonstrate the differences in
treatment efficacy among patients with different status of liver function,
degree of hepatitis and starting dose.
- Adjuvant sorafenib after TACE and liver transplant: evidence
demonstrating efficacy is limited.
- Sorafenib combined with other methods such as HAIC, Yttrium90: a majority of studies had negative results
→ So far single-agent sorafenib has still demonstrated its role as
main choice in first-line treatment of advanced HCC although some
other targeted agents also prove their efficacy.
- Domestic studies assessing the role of sorafenib have just stopped
in the assessment of initial treatment efficacy in some clinical
cases, thus they have not identify factors significantly affecting
treatment results
1.5. Sorafenib and contorversial issues
The differences in treatment result of different populations lead to a
lot of questions: is there any relationship with etiological factors? What
about the initial dose of sorafenib? The relationship between toxicities
and treatment result?
1.6. Sorafenib and prognosis factors
Assessed factors: AFP concentration, stage, liver function, viral
hepatitis status, initial dose, toxicities during treatment and several
biological factors such as VEGF-A, angiopoietin-2, genesis factors. Over
10 years of study, there have not been any clearly determined factors.
CHAPTER 2. PARTICIPANT AND STUDY METHOD
2.1.Study participant
This study included 110 HCC patients treated with sorafenib in
Vietnam National Cancer Institute and Hanoi Medical University hospital
from January 1st 2010 to November 31st 2018.
5
* The eligibility criteria included:
- Diagnosed based on the diagnosis guideline of Vietnamese
Ministry of Health.
- Unresectable HCC or failure after local treatment methods such as
TACE, radiofrequency ablation, i.e.: Barcelona stage C, metastatic or
recurrent HCC and failure after local therapy.
- Good overall health status: ECOG PS 0-2
- Liver function was Child-Pugh A or Child-Pugh B
- Patients did not suffer from severe acute or chronic diseases
- Patients were not treated with systemic therapy before
-With patients with progressive disease after HCC loco-regional
treatments, sorafenib treatment had to start at least ≥ 28 days after locoregional treatments.
- There was at least 1 measurable lesion of which the longest
diameter could be measured correctly ≥ 10mm at first on CT scan or MRI
- Functions of organs and bone marrow were in permitted limit:
hemoglobin ≥ 90g/l, number of granulocytes ≥ 1.0 G/l, number of
platelets ≥ 75 G/l, total bilirubin ≤ two-fold upper limit of normal range,
ALT and AST ≤ 5-fold upper limit of normal range, GFR ≥ 50 ml/min
(according to the Cockcroft- Gault formula)
- Patients were treated with sorafenib with the starting dose being
at least 400 mg per day.
- Medical charts were stored sufficiently
* Exclusion criteria
- Metastasis from other sites
- Patients were allergic to studied agents
- Patients had symptomatic or uncontrollable hypertension
- Overall health status: ECOG PS 3-4
- Patients were at risk of death in near future due to other severe
diseases (disease of cardiology, acute infection, and other advanced cancers)
- Psychiatric disorders
- History of other malignant diseases except diseases with curative
goal, no disease in active status (at least 5 years before sorafenib
treatment) and low risk of recurrence; local-stage cancers that were
treated sufficiently and there is not any evidence of disease at the
moment.
- Brain metastasis or spinal cord compression.
2.2.
Study methods
6
2.2.1. Study design: this was a retrospectively and prospectively
descriptive study with longitudinal follow-up
2.2.2. Study setting
Location: Vietnam National Cancer Hospital and Department of
Oncology, Hanoi Medical University Hospital
Time: retrospect from January 2010 to December 2015 and
prospect from January 2016 to November 31st 2018
2.2.3. Sample size of study
The formula to calculate the sample size:
Applying the above formula, sample size is 86.
In this study, we included 110 patients.
2.2.4. Study process
- Enroll eligible patients. Information was collected based on a
consensus medical record sample. All patients participating in this
study were treated with sorafenib with the starting dose at least
400 mg per day, at maximum 800 mg per day. The toxicities were
evaluated after 2 weeks of treatment, the dose would be adjusted
according to toxicity level. Data were collected at the following
moments: starting point of treatment, during treatment, ending of
treatment and ending of follow-up (time of death or when final
information was collected or when follow-up was ended
(November 31st 2018)).
- Assessment of several characteristics of study patients: age,
gender, viral hepatitis, PS, characteristics of liver tumour,
diagnosis characteristics, AFP before treatment, Child-Pugh
score, ALBI grade, liver enzyme before treatment, history of local
treatment before the study, information of follow-up time,
treatment characteristics of study participants.
- Assessment of treatment efficacy included: response rate
according to RECIST 1.1, disease control rate, response
according to AFP, PFS, OS and assessment of adverse events
(toxicity) of agents according to Common Terminology Criteria
for Adverse Events (CTCAE) 4.0 of National Cancer Institute
(America).
- Evaluate several factors affecting DCR, PFS and OS: gender, age,
hepatitis B, C virus, PS, AFP before treatment, number of
tumours, dimension of tumour, portal vein thrombosis, extra-
7
hepatic metastases, liver enzyme before treatment, Child-Pugh,
ALBI grade, the starting dose of sorafenib and effects of several
toxicities during treatment process.
- Management of common adverse events during treatment
+ Treat toxicities according to guidelines, based on toxicity level
+ HCC was progressive during treatment process: treat with
second-line drug if patients had good liver function and PS,
palliative care only if patients had bad liver function and PS.
2.3.Data analysis
Information was collected based on designed case report forms.
Data collection methods: clinical examination, laboratory test, followup examination, prescription, call or write letter to the patients to
record treatment efficacy. Data were processed and analyzed on SPSS
20.0 software with statistical algorithms. Survival was estimated by
the Kaplan- Meier method. The univariate analysis: use log-rank test
when comparing survival curves among groups. The multivariate
analysis: use Cox proportional hazards models with 95% confidence
interval (p=0.05).
CHAPTER 3. RESULTS
3.1. CHARACTERISTICS OF PATIENTS
Table 3.1. Characteristics of patients
Characteristics
Gender
Male
Female
Mean age
Hepatit
is virus
infectio
n status
HBV
HCV
HCV +HBV
No hepatitis
virus
infection
N
%
10
92,7
2
8
7.3
57.9 11.4
83 75.5
4
3.6
1
0.9
22
20.0
Alcohol intake
10
9,0
Disease
charact
eristics
62
44
56.4
40.0
BCLC C
Recurrence /
Metastasis
Characteristics
Location
of
tumours
Tumour
size
Extent of
disease
spread
N
%
None
6
5.4
Right lobe
Left lobe
Bilobular
Median
>60 mm
41
12
51
37.3
10,9
46.4
51
49.0
≤60 mm
53
51.0
42
38,2
61
20
55.5
18.2
Portal vein
tumour
thrombus
Metastasis
Portal vein
tumour
thrombus and
8
metastasis
ChildPugh
ALBI
PS
Failure after
local
intervention
A
B
Grade 1
Grade 2
Grade 3
0
4
3.6
99
11
39
65
6
93
90.1
9.9
35.4
59.1
5.5
84.5
1
17
15.5
0
Number of
extrahepatic 1
metastases
2
3
Pretreatmen <20
t AFP ng/ml ≥20
>80 UI/L
Pretreatm
ent
≤80 UI/L
AST/ALT
49
44.5
42
12
7
24
86
36
38.2
10.9
6.4
21.8
78.2
32.7
74
67.3
Comments: The majority of patients were male, and 75.5% had HBV
infection. Almost all patients were in BCLC stage C, had CP level A,
ALBI Grade 2, PS=0, bilobular tumor. The median of tumour size was 60
mm. Portal vein tumour thrombus (PVTT) was found in 38.2% patients.
55.5% had extrahepatic metastases, 78.2% had elevated AFP.
Table 3.2. Characteristics of treatment
Characteristics
Number of
%
patient
History of local intervention before study (n=110)
Yes
51
46.4
No
59
53.6
Local interventions
Surgery
29
26.1
TACE
33
29.7
RFA
8
7.2
Percutaneous ethanol
4
3.6
injection
Radiotherapy
4
3.6
Time from initial treatment to take
13 (1-90)
part in research (month)
Number of cycle
6.3 (0.5- 64)
Median duration of treatment (month)
6.4 (0.5-65)
Starting dose (mg)
400
38
34.5
9
600
800
Mean dose
Median dose
Mean daily dose (mg/day)
Median daily dose (mg/day)
Dose increased during treatment
Dose reduced during treatment
Second-line treatment
24
48
21.8
43.6
580 162 mg
600 (Min: 291, Max: 800)
600 157 mg
600 (Min: 400, Max: 800)
13
11.8
29
26.4
6
5.4
Comments: 46.4% of patients had history of local intervention before
study, median number of cycle was 6.3 . Median starting dose was 600
mg. Dose of sorafenib was increased in 11.8% and reduced in 26.4%
patients.
Table 3.3. Characteristics of patient’s status and follow-up duration
Characteristics
Availiable data
Missing data
Survived
Dead
Discharged
Under treatment
Follow-up duration (months)
Median
Mean
Shortest
Longest
Number of
patient
99
11
%
90.0
10.0
26
73
89
21
23.6
66.4
80.9
19.1
5.9
11.0
1.0
73.8
Comments: Median of follow up time was 5,9 months, 90% of patients
had available follow-up information.
10
3.2. OUTCOME OF TREATMENT
3.2.1. Treatment response
Table3.4. Response according to
RECIST 1.1
Response
Number
%
RECIST 1.1
of patient
Complete
0
0
response
Partial response
5
4.5
Stable disease
60
54.5
Progressive
45
41.0
disease
DCR
65
59.0
Total
110
100
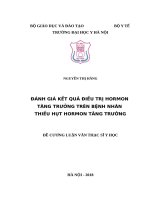
0.3%
0.05%
0.65%
AFP bình thường
AFP không đáp ứng
AFP đáp ứng
Graph 1.1. AFP response
Comments: DCR was achieved in 59% patients and partial respone was
seen in 4,5%, AFP response was 4,9% of patients.
3.2.2. Progression-free survival
Table 3.5. Progression-free survival
Median
months
4.57
95%CI
- months
3.88-5.25
Progression free survival – PFS
Min
Max
1
2
3
-months -months year years years
(%)
(%)
(%)
0,4
67
23
14
10
4
years
(%)
5
5
years
(%)
2
Comments: Median PFS was 4,57 months. The 1 years and 5 years PFS
were 23% and 2% repsectively.
Table 3.6. The overall survival
Median
months
7.13
95%CI
months
4.5-9.8
The overall survival- OS
Min
Max
1
2
-month -month year years
s
s
(%)
(%)
1
73.8
36
20
3
years
(%)
13
4
years
(%)
5
5
years
(%)
5
11
Graph 1.2. Progression free survival and the overall survival
Comments: Median time of OS was 7,13 months. The 1 year and 5 years
OS were 36% and 0% respectively.
Table 3.7. Characteristics of natural history
Characteristics of natural hisotry
(N=91)
Local
Tumour growth
New lesion
Extrahepatic metastasis
Tumour growth
Metastasis
Lung
Lymph node
Peritoneum
Bone
Thrombosis
Child-Pugh C
Number of
patient
%
55
8
60.4
8.8
20
20
6
8
3
2
6
23
22.0
20.9
35.0
40.0
15.0
10.0
5.5
25.3
Comments: Localized liver cancer was seen in 60.4%, the proportion of
poor liver function (Child-Pugh C) was 25.3%
3.3.2. Adverse events (AEs) of Sorafenib
Table 3.8. Characteristics of AEs
12
Characteristics
(N=110)
Occurrence of AEs
Treatment delayed due to AEs
Permanent discontinuation due to
AEs
Number of
patient
86
25
78.2
22.7
0
0
%
Comments: AEs rate was high at 78.2%. 22.7% patients had treatment
delayed due to Aes.
Table 3.9. Grades of AEs
Symptoms
(N=110)
Fatigue
Weight loss
Hypertension
Xerosis
HFSR
Dysesthesia/
pruritus
Red rash
Stomatitis
Anorexia
Diarrhea
Elevated liver
enzymes
Abdominal pain
Thrombocytopeni
a
Leukopenia
Anemia
All
grades
n
%
Grade 1
Grade 2
%
Grade
3
n %
Grad
e4
n %
n
%
n
2
8
1
7
25.
5
0.9
6.4
1
1
1
5
10,
0
0.9
4.5
9
8.2
8
0
0
0
1
0
0.9
0
1
0
0
0
0
0.9
19.
1
1.8
0
1
2
0
0
10.
9
0
0
7
0
0
0
0
0
7.
3
0
0.
9
0
6.
4
0
1
4
0
2
0.9
36.
4
1.8
1
2
1
2
0
0
3
7
2
1
1
3
6
3
1
3
1
4
2.7
6.4
1.8
10.
0
32.
7
2.7
11.
8
0.9
3.6
3
7
2
1
0
1
9
3
1
2
1
2
2.7
6.4
1.8
9.1
0
0
1
1
0
0
0.9
0.9
0
0
0
0
0
0
0
0
0
0
0
0
0
0
0
0
17.
3
2.7
10.
9
0.9
1.8
1
4
0
0
12.
7
0
0
3
0
0
0
0
0
0
0
2
0
1.8
0
0
2.
7
0
0.
9
0
0
0
0
0
0
0
1
13
AEs: idiopathic fever (1 patient), cholangitis (1 patient), pneumonia (1
patient), hemoptysis, (1 patient), hematemesis due to portal vein
hypertesion (1 patient).
Comments: The majority was Grade 1/ 2 AEs; the most frequent of AEs
were fatigue, HFSR, Elevated liver enzymes, diarrhea, grade 3 AEs
<10%, there were no grade 4 AEs.
Table 3.9. Timing of occurrence and toxicity duration
AEs
Timing of occurrence
Duration
(N=110)
(days)
(cycles)
Median
Range
Median
Range
Fatigue
15
15- 60
1
1-14
Hypertension
15
15- 30
1
1-4
HFSR
30
5- 240
3
0.5-34.5
Stomatitis
15
15- 60
1
1-3
Diarrhea
22.5
15- 90
1
1-12
Elevated liver
30
15- 90
2.5
1-7
enzymes
Thrombocytopeni
30
15- 60
2
1-14
a
Comments: The median onset of AEs was 15-30 days, lasted for 1-2
cycles of treatment
Table 3.10. Correlation between starting dose and toxicity
Number Starting dose of Sorafenib
AEs
of
p
400
600 mg 800 mg
patient
mg
HFSR
40
6 (15)
8 (20)
26 (65)
0.001
Elevated liver
14
14
36
8 (22.2)
0.751
enzymes
(38.9)
(38.9)
6
16
Fatigue
28
6 (21.4)
0.179
(21.4)
(57.2)
1
Stomatitis
7
2 (28.6) 4 (57.1)
0.507
(14.3)
Hypertension
7
0
1 (14.3) 6 (85.7)
0.022
4
Diarrhea
11
1 (9.1)
6 (54.5)
0.719
(36.4)
Thrombocytopeni
6
13
3 (23.1) 4 (30.8)
0.288
a
(46.2)
14
19
0.001
(65.5)
8
1**
Dose increase
13
4 (30.8)
0.006
(61.5)
(7.7)
Comments: There was a positive correlation between starting dose and
HFSR and hypertension. The proportion of these events increased as the
starting dose increased.
3.3. Factors that affected treatment outcome
3.3.1. Univariate analysis factors that affected outcomes
Table 3.11. Univariate analysis factors associated with DCR, PFS, OS
Dose reduce
Gender
Hepatitis virus
PS
AFP
Number of
tumour
Tumour size
Portal vein
tumour
thrombus
Extrahepatic
metastasis
Liver enzymes
2 (6.9)
8 (27.6)
DCR
PFS
Number
of
patient
%
p
<40
40
Male
Female
No
HBV
HCV
HBV+C
0
1
>20
20
Single
Multiple
60
> 60
Yes
No
9
101
102
8
22
83
4
1
93
17
86
24
28
76
53
51
42
68
66.7
58.4
58.8
62.6
72.7
55.4
50.0
1000
65.5
23.5
53.5
79.2
64.3
55.3
64.2
51.0
50.0
64.7
0.457
Yes
61
54.1
0.249
No
49
65.3
80
74
66.2
Factors
Age
29
0.574
0.129
0.001
0.024
0.504
0.174
0.127
Median
(months)
OS
p
4.5
4.7
4.6
3.7
6.7
4.4
2.1
5.1
5.1
2.4
4.0
6.7
4.5
4.5
5.7
3.4
3.2
5.2
0.109
4.3
0.123
0.310
0.503
0.01
0.024
0.683
0.004
0.215
5.1
0.029
5.0
Median
(month p
s)
13.5 0.184
6.8
6.8 0.149
23.8
13.1 0.207
5.9
2.5
17.1
7.7 0.184
2.9
5.9 0.023
15.6
7.1 0.823
6.8
6.8 0.002
5.1
4.9 0.045
10.4
6.7
0.306
10.0
0.067
10.4
0.036
15
Child-Pugh
ALBI
Starting dose
HFSR
Elevated liver
enzymes
Stomatitis
Hypertension
Fatigue
Diarrhea
80
A
B
Grade 1
Grade 2
Grade 3
800 mg
<800 mg
Yes
No
Yes
No
Yes
No
Yes
No
Yes
No
Yes
No
36
99
11
39
65
6
49
61
40
70
36
74
7
103
7
103
28
82
11
99
44.4
60.6
45.5
64.1
58.5
33.3
63.3
55.7
77.5
48.6
52.8
66.2
71.4
58.3
85.7
57.3
81.8
56.6
81.8
56.6
0.352
0.232
0.425
0.003
0.348
0.493
0.237
0.517
0.106
2.9
4.7
2.9
5.8
4.5
1.8
5.6
4.4
6.7
3.1
3.5
5.1
10.8
4.6
4.7
4.5
4.5
4.6
5.8
4.5
0.097
0.035
0.190
0.001
0.108
0.628
0.07
0.941
0.340
4.9
8.7 <0.001
2.7
10.4 0.008
6.7
1.8
10.4 0.125
6.2
14.6 0.002
5.8
5.9 0.028
10.4
23.8 0.045
6.7
45.2 0.011
6.7
6.8 0.744
7.1
15.6 0.099
6.7
Comments:
- Factors that affected DCR were PS=1, AFP>20ng/ml, pretreatment liver
enzymes >80UI/l, and without HFSR .
- Factors that were associated with poor PFS were : PS=1, pretreatment
AFP > 20 ng/ml, tumour size > 60mm, ALBI Grade 3, and without
HFSR.
- Factors that were associated with poor OS were : AFP>20 ng/ml, tumour
size >60mm, portal vein tumour thrombus, pretreatment liver enzymes
>80 U/l, Child-Pugh B, ALBI Grade 3, AEs of treatment: HFSR, elevated
liver enzymes, stomatitis, and hypertension.
3.3.2. Factor in multivariate analysis
Table 3.12. Factors affected PFS, OS in multivariate analysis
Factors
HBV
(Yes, No)
PS
(0, 1)
AFP-ng/ml
PFS- Multivariate
analysis
HR
95%CI
p
0.8281.501
0.181
2.721
1.2142.565
0.014
5.421
0.583
0.2990.111
OS- Multivariate analysis
HR
2.542
1.274
0.025
95%CI
1.3274.870
0.6032.693
0.330-
p
0.005
0.526
0.278
16
(>20, 20)
Tumour size –mm
(>60, 60)
Number of tumour
( Single, Multiple)
Portal vein tumour
thrombus (Yes, no)
Extrahepatic
metastasis (Yes, no)
Liver enzymes
pretreatment-UI/L
(>80 , 80)
Child-Pugh
(A, B)
Dose of Sorafenib
(800mg, < 800 mg)
HFSR
(Yes, no)
Elevated liver
enzymes
(Yes, no)
Stomatitis
(Yes, no)
Hypertension
(Yes, no)
2.096
0.740
1.106
2.183
0.892
0.890
1.414
1.223
1.642
0.990
0.469
1.133
1.2263.584
0.4341.263
0.6711.822
1.3003.666
0.5161.542
0.4071.945
0.7392.704
0.7062.120
0.9772.761
0.3103.162
0.1451.515
0.007
2.125
0.270
0.616
0.694
0.759
0.003
2.683
0.682
0.940
0.770
2.805
0.295
0.959
0.472
1.087
0.061
2.009
0.986
0.222
0.206
0.154
1.375
1.2213.696
0.3531.075
0.4371.319
1.4874.843
0.5221.692
1.2506.290
0.501
1.835
0.6311.872
1.1703.449
0.0491.010
0.0310.755
0.008
0.088
0.328
0.001
0.836
0.012
0.898
0.763
0.011
0.052
0.021
Comments: Factors that independently affected PFS were: PS, tumour
size, and extrahepatic metastasis. Factors that were independently
associated with OS were HBV, extraheptatic metastasis, Child-Pugh, AEs
of treatment: elevated liver enzymes and hypertension.
CHAPTER 4: DISCUSSION
4.1. The characteristics of patients in the study:
The study was conducted on 110 patients, with age, epidemiological
characteristics of HBV similar to those of domestic studies. About the
treatment: 46.4% failed with local intervention, the median number of
treatments: 6.3 sessions, the majority of patients using sorafenib starting dose
of 800 mg / day (43.6%), dose on average 570 mg / day, 13 patients (11.8%)
increased dose during the treatment due to good tolerance, 29 patients
(26.4%) reduced dose due to side effects. 90% of patients had the follow-up
17
information, 10% had lost information mainly in the retrospective group, for
these patients we took the last day having information as the discharged date
to calculate extra time. Median follow-up time was 5.9 months (1-73.8
months)
4.2. The treatment result:
4.2.1. The responsible result:
The partial response rate is low 4.5%, 54.5% of cases remain the same
while the rate of controlled diseases is 59%. This result is similar to studies
conducted in Asia such as the AP study and lower than the SHARP study in
Europe (71%). Most studies in the world also recorded low response rates,
even full response rates is extremely rare (almost 0%); Since 2008, only 15
cases have met the full response in the reported clinical cases. This is a big
challenge in finding new drugs that have better results than sorafenib in the
treatment of advanced stage UTGNP.
4.2.2. The response rate following the AFP
At the moment, the use of AFP in screening gradually becomes less
important but still plays a role in diagnosis and prognosis especially in
patients with surgery and liver transplant. 81 patients assessed AFP at the
time after 2 treatment periods represented a low response rate of 4.9%, 65.4%
AFP did not respond, and 29.6% normal AFP. From the above results, it is
recommended that AFP should not be used as a single criterion to determine
the direction of treatment, it should be used only in cases where there is no or
difficult to assess target damage, and it cannot replace the image diagnostic
criteria.
4.2.3. Progression – free survival (PFS)
PFS is not the most important factor to evaluate treatment
effectiveness, but it is an important criterion. The median PFS time is 4.57
months, the shortest is 0.4 months, the longest is 67 months. PFS ratios at 1
year, 2 years, 3 years, 4 years, and 5 years are 23%, 14%, 10%, 5%, and 2%
respectively. PFS results were not the same in the global studies, the majority
were lower for the Asian population, and higher for the studies conducted in
Europe, however, it was noticeable that most patients progressed before 6
months. The difference in results may be due to differences in the study
subjects, this is also a controversial issue during sorafenib treatment that the
research team will get into the discussion in the following section. Among
patients with advanced progression, the majority was at the target lesion,
however, there were 25.3% of patients with impaired hepatic function ChildPugh C, this is an important factor contributing to sorafenib treatment results.
.4.2.4. Overall survival:
18
The median overall survival time of patients in the study was 7.13
months, ranged from 1 month to 73.8 months, 95% CI was 4.5-9.8 months.
Most patients die in the first year. OS ratios at 1 year, 2 years, 3 years, 5
years, and 6 years are 36%, 20%, 13%, 5%, 5%, and 0% respectively (Table
3.7 and chart 3.3 ). Our results were higher than the AP study (7.13 months
versus 6.5 months), lower than the SHARP study (7.13 months versus 10.7
months), and there was no similarity with other studies globally. The results
of our study and the two domestic studies, though different, are not much
different from AP in Asia, but much lower than SHARP in Europe.
Differences in the effectiveness of the medication across studies have raised
many questions. The key unanswered question is whether there is a difference
in response in different populations, related to the etiologic cause, of which
one important factor is hepatitis infection B or C virus, we will deeply
analyze and discuss the influence of these factors on the outcome of
treatment in the following section.
4.2.5. Adverse Drug Reactions (toxicities) of sorafenib:
The proportion of occurrence of adverse drug reaction is high at
78.2%. The most common toxicity during sorafenib treatment is a skin-limb
reaction (36.4%), followed by elevated liver enzymes (32.7%), fatigue
(25.5%). Other less common toxicity includes: thrombocytopenia (11.8%),
diarrhea (10%), hypertension (6.4%), canker sores (6.4%). Besides, the other
less common toxicity accounts for less than 1%, including weight loss, dry
skin, skin irritation, erythema, anorexia, nonspecific abdominal pain,
leukopenia, anemia. The majority of side effects were at 1st level, 2nd
level,while particularly third-degree limbs skin reactions were observed in 7
patients (6.4%), third degree fatigue in 8 patients (7.3%), men increased
Grade 3 liver in 3 patients (2.7%), thrombocytopenia degree 3 in 1 patient
(0.9%). Thus, the toxicity of sorafenib is mostly on the skin, body,
gastrointestinal tract, very rare on the hematopoietic system. This is true for
all target drugs applied in the field of cancer in general. High rates of toxicity
have also been reported in the global studies: in GIDEON is 83%, SHARP
80%, AP ...%, but the majority was of level 1 and 2, the level of 3,4 was
below 10%. The domestic studies on a small number of patients should not
publish the proportion of toxicity, but the common toxicity is fatigue,
diarrhea, skin and limb skin reactions, mostly in grades 1 and 2.
Although the incidence of adverse drug reactions is high (78.2%), the
majority was mild and encountered in the first months of treatment. Some
patients expressing level 3 have to delay treatment or reduce the dose during
treatment. The proportion of delay in treatment in the study was 22.7%, but
the duration of treatment delay was short (the difference between the median
duration of treatment and the number of treatment periods was small: 6.3
19
months compared to 6.4 month). The proportion of patients who had to
reduce the dose during treatment due to side effects accounted for 26.4%,
mainly due to HFSR and fatigue. After reducing the dose of undesirable
effects is reduced, patients well tolerated with treatment.
We further analyzed the effect of the starting dose on the common
toxicity, the results showed that only HFSR and hypertension were
significantly related to the starting dose. Specifically, the incidence of HFSR
gradually increases from 15% to 20% to 65% according to the dose levels of
400 mg, 600 mg, and 800 mg; Grade 3 toxicity was only seen in patients
using 800 mg / day, the difference was statistically significant with p = 0.001;
the rate of hypertension increased from 0% to 14.3% to 85.7% according to
the starting dose levels of 400 mg / day, 600 mg / day and 800 mg / day, the
difference was statistically significant with p = 0.022.
4.3. Comment on some factors that affect the outcome of treatment
4.3.1. The effects of age and gender:
About the disease control rate and PFS time, the results showed no
difference, however, in terms of overall survival time, median OS was higher
in patients younger than 40 years (13.5 months compared to 6.8 months, p>
0.05), and female group (23.8 months compared to 6.8 months, p> 0.05).
Although there was no significant difference in OS results, we found that the
95% CI range was very large in women (21.8 to 25.7 months), cases with a
survival time of over 2 years. However, due to the large number of female
patients, it is very difficult to assess the difference in prognosis between two
genders.
4.3.2. The effects of viral hepatitis:
The results of overall survival time reduce from 17.1 months, 13.1
months, 5.9 months to 2.5 months according to the subtypes: HBV + HCV
co-infection, non-hepatitis, HBV, and HCV respectively (p = 0.207). Because
the proportion of hepatitis C patients in the study was too low, we focused on
assessing the impact of HBV as a major risk factor in Vietnam. Results
showed that PFS and OS were lower in the group infected with hepatitis B,
but the significant difference was only achieved in OS (13.2 months
compared to 5.9 months). Results from major studies in the world also show
that the difference in the etiology of the pathogen is an important factor
affecting the outcome of treatment, the prevalence of HBV, HCV in different
studies leads to different treatment result. In the AP study, the HBV rate was
over 70%, while in SHARP was 18%, the OS result in AP was 7.8 months
lower than SHARP was 10.7 months.
4.3.3. The effect of overall condition index before treatment
In the study 84.5% PS = 0, 15.5% PS = 1, there is no case PS = 2. The
survival time results were higher in the PS = 0 group compared to the PS = 1,
20
however the difference was only achieved in PFS (5.1 months compared to
2.4 months, p = 0.01). In multivariate analysis, the overall index is not an
independent prognostic factor to the outcome of treatment. We found that
patients with PS = 1 had a higher incidence than Child-Pugh B. Studies in the
world rarely mentioned the role of PS because the majority of studies were
conducted on patients with PS = 0. Research by Chia-Yang Hsu showed that
PS is an independent prognostic factor, the risk of death increases from 34%
to 130% according to PS from 1-4, Hiroki said that PS is an independent
prognostic factor to the total lifetime result with HR = 1,773.
4.3.4. The effect of AFP concentration before treatment
AFP has a role in screening, diagnosing and monitoring HCC, but the
role of AFP before treatment in prognosis is still controversial. In the study
84.5% of patients with increased AFP, we chose AFP 20 ng / ml as a cut-off
point divided into 2 groups <= 20 ng / ml, and> 20 ng / ml. Results of DCR,
PFS, OS were all higher in the group with AFP <= 20 ng / ml (disease control
rate 79.2% compared to 53.5%, p = 0.024; median PFS 6.7 months compared
to 4,0 months, p = 0.024; 1-year PFS rate of 36% compared to 11%, p =
0.002; median OS 15.6 months compared to 5.9 months, p = 0.023; 1-year
OS rate 39% compared to 18%, p = 0.001). However, in multivariate
analysis, an increase in AFP before treatment is not an independent
prognostic factor for treatment outcome. We found that the increased AFP
group before treatment had a higher rate than patients with thrombosis, HBV,
elevated liver enzymes, which are all bad prognostic factors affecting
treatment results. Some studies in the world evaluate the role of AFP before
treatment as a prognostic factor for patients treated with sorafenib, but the
cut-off points differ. The results of the authors Kristin, Jack P. Silva showed
that the highest result of treatment belonged to the normal AFP group before
treatment. Increased AFP before treatment is associated with an increased
risk of disease recurrence and death.
4.3.5. The effect of the number and size of liver tumor:
In the study, there were 104/110 patients with liver tumors, the
remaining is recurrent distant metastases after liver resection. We did not see
the difference between the number of liver tumors and the outcome of
treatment, however, the size of the tumor was a major factor affecting the
outcome of treatment. We take the 60mm median point as a landmark
dividing into 2 groups: <= 60mm (48.2%),> 60 mm (51.8%). Results showed
that DCR, PFS, OS were significantly higher in the group with the liver
tumor sizes <= 60mm. Specifically, the disease control rate was 64.2%
compared to 51.0%, median PFS 5.7 months compared to 3.4 months (p =
0.004), 1-year PFS rate was 32% compared to 11% (p = 0.017); The median
OS is 10.7 months compared to 5.1 months (p = 0.002), the 1-year OS rate is
21
45% compared to 23% (p = 0.002). Other domestic studies (Nguyen Dai
Binh, Thai Doan Ky) and abroad studies (SHARP, AP) also identified size as
an important predictor of treatment outcomes.
4.3.6. The effect of portal vein thrombosis:
Results of DCR, PFS, OS were lower in patients with portal vein
thrombosis, but the significant difference was only achieved in OS (4.9
months compared to 10.4 months, p = 0.045). The mechanism of formation
of thrombosis is unclear, but most of the thrombosis appears around the
tumor and is thought to be a direct invasive tumor, clinically, portal vein
thrombosis is more related to large-size tumors, poor CP, increased AFP.
Studies all over the world have identified the presence of thrombosis as a
poor prognostic factor, response rate is less than 10% and median survival
time is 3.1 months during sorafenib treatment. Michele and assistants
suggested that the risk of death doubled in patients with thrombosis, which
result was similar to previous reports. In the study, we also found that there
was no difference in the extra survival results between the types of
thrombosis.
4.3.7. The effect of distant metastases beyond the liver
Treatment results were higher in patients who had no metastases
outside the liver for both DCR (65.3% versus 54.1%), PFS (5.1 months
versus 4.3 months), OS (10 months versus 6.7 months), however the
difference is not statistically significant. Uka and assistants suggested that
primary liver tumor played a more important role in prognosis than
metastases, and in the multivariate analysis the author found that among
patients with distant metastases, early- stage liver tumors had a good
prognosis than patients with advanced- stage liver tumors. Other authors
suggest that liver damage should be controlled locally and that extra liver
damage should be corrected with systemic treatment or in combination with
radiation therapy. However, this view is not consistent.
4.3.8. The effects of liver enzymes before treatment
The proportion of patients with elevated liver enzymes (AST / ALT)>
80 UI / L accounts for 36/110 patients. We found no significant difference in
PFS results between the two groups of patients with elevated liver enzymes>
80 UI / L and <=80 UI / L (median PFS 5.0 months compared to 2.9 months,
p = 0.067), however, the difference was significant in terms of disease control
rates, 1-year PFS rate and overall lifetime (66.2% control rate compared to
44.4%, p = 0.029; 1-year PFS 20% compared to 7%, p = 0.040; median OS
10.4 months compared to 4.9 months, p = 0.036; 1-year OS ratio 26%
compared to 16%, p = 0.005 ). AST / ALT levels may reflect hepatocyte
damage related to HCC; in the AP study, the author showed that patients with
liver enzymes had a slight increase of 1.8 times higher than normal with
22
similar OS results between sorafenib groups and placebo, an increase of 1.8-3
times had higher results in sorafenib treatment group, an increase of 3 times
higher for a placebo group. Thus, elevation of liver enzymes> 80 UI / l before
treatment is a predictor of poor treatment results with sorafenib
4.3.9. The effect of liver function:
Effects of Child-Pugh: Treatment results were higher in group CP A
but significant differences were only achieved in OS (8.7 months versus 2.7
months, p <0.001). We assessed in more detailed by CP points 5,6,7,8 and 9,
the results showed that the best results belonged to CP 5,6,7 points, but CP 6
was lower compared with CP 7 points. This may be a weakness when
applying CP scores in prognosis of patients with HCC, because in the CP
scale there are 2 subjective factors: ascites and hepatic encephalopathy, 2
dependent factors are albumin and ascites Because of the obstruction, it is
sometimes difficult to accurately assess liver function in patients with HCC.
In addition, the CP scale lacks of confirmation while establishing on HCC.
ALBI level: ALBI level was born based on two objective factors:
albumin and billirubin, when comparing the correlation between ALBI and
CP, we found that ALBI level was more detailed, especially in patients with
good liver function. Treatment results gradually decreased according to ALBI
at levels 1, 2 and 3 (PFS: 5.8 months, 4.5 months, 1.8 months, p = 0.035. OS:
10.4 months, 6.7 months and 1, 8 months, p = 0.008). Many studies in the
world have confirmed that ALBI is an independent prognostic factor, the best
treatment result belongs to ALBI level 1. ALBI should be widely used in
prognosis of patients with HCC for sorafenib treatment.
4.3.10. The effect of the starting dose of sorafenib:
The results showed that the rate of DCR, PFS, OS was higher in the
standard treatment group of 800 mg / day (median PFS 5.6 months compared
to 4.4 months, median OS 10.4 months compared to 6.2 month), however the
difference is not statistically significant (p> 0.05). In clinical practice, the
starting dose varies widely from 400 mg to 800 mg depending on the
experience of the physician, in the study, the majority of patients used a low
starting dose due to liver enzymes> 80UI / l. Results from large global
studies such as GIDEON showed that using a starting dose 50% lower than
the standard dose reduces toxicity and treatment discontinuation rates while
there is no significant difference in treatment results. However, gradually
increasing the dose to ensure the maximum dose is necessary to guarantee
treatment results.
4.3.11. The effect of some toxicity on the outcome of treatment
We assessed the effects of some common toxicity: HFSR, elevated
liver enzymes, stomatitis, hypertension, fatigue and diarrhea to the outcome
of treatment. Results showed that the factors affecting the treatment outcome
23
were HFSR (median OS 14.6 months compared to 5.8 months, p = 0.002),
stomatitis (median OS 23.8 months compared to 6.7 months, p = 0.045),
hypertension (median OS 45.2 months compared to 6.7 months, p = 0.011).
Factors adversely affecting the outcome of treatment were hepatotoxicity
(median OS 5.9 months compared to 10.4 months, p <0.05). Studies around
the world also identify the above toxicity as a prognosis role, but the
independent influence factors vary in the studies. Reig's research, Fernanda
Branco, Masanori suggested that HFRS was an independent prognostic factor
for treatment outcomes, but Bettinger and Koschny found that there was no
relation between HFSR and results. Estfan, Akutsu pointed out that
hypertension within 2 weeks of starting treatment was associated with better
treatment outcomes. In summary, there is no consensus on the effect of
toxicity on results, but in the study we found that in Vietnamese patients, two
independent factors affecting treatment results are elevated liver enzymes and
hypertension.
4.3.12. Independent prognostic factors for multivariate analysis:
From the research results, we realize that there are many factors
affecting treatment results in univariate analysis, but in multivariate analysis,
independent factors affecting PFS are PS, tumor size, distant hepatic
metastases, independent factors affecting OS are HBV, tumor size, distant
hepatic metastases, Child-Pugh, elevated liver enzyme toxicity and
hypertension. Factors adversely affecting PFS are PS = 1, liver tumors> 60mm,
metastases spreading outside the liver (doubling the risk of disease
progression). Factors that adversely affect the OS are HBV (2.5 times the risk
of death), liver tumors> 60mm (2.1 times the risk of death), metastases
spreading outside the liver (2.7 times the risk death), Child-Pugh B (2.8 times
the risk of death), elevated liver enzymes’ toxicity (2 times the risk of death).
Hypertension reduces 84.6% risk of death.
CONCLUSION
After conducting research on 110 HCC patients treated with sorafenib
from January-2010 to November-2018 in NHC and Department of Oncology,
Hanoi Medical University Hospital, we have come to the conclusion:
1. Outcomes of treatment
- Treatment with Sorafenib: median OS was 7,13 months, the 1 year and 5
year-OS were 36% and 5% respectively; meadian PFS was 4,57 months, the
1 years and 5 year-PFS were 23% and 2% repsectively.
- Partial response rate was 4,5%, DCR rate was 59%.
- The proportion of AFP response was 4,9%
24
- Sorafenib is safe in patients: although AEs were common (78,2%), the
majority was Grade 1, 2; Grade 3 was found in less than 10% patients and
there were no Grade 4 AEs:
+ The most frequent AEs: HFSR (36,4%), fatigue (25,5%), elevated liver
enzymes (32,7%).
+ The effect of AEs: treatment delayed 22,7%, dose reduce 26,4%. There
were no permanent discontinuation due to AEs
+ The median onset of AEs was 15-30 days, lasted for 1-2 cycles of
treatment.
+ There was a positive correlation between starting dose and HFSR or
hypertension.
2. Factors were associated with outcome
2.1. Univariate analysis of factors:
- Factors that were associated with poor DCR were : PS=1, pretreatment
AFP >20ng/ml, pretreatment liver enzymes >80UI/l, and without HFSR.
- Factors that were associated with poor PFS were: PS=1, pretreatment
AFP > 20 ng/ml, tumour size > 60mm, ALBI Grade 3, and without HFSR.
- Factors that were associated with poor OS were : AFP>20 ng/ml, tumour
size >60mm, portal vein tumour thrombus, pretreatment liver enzymes >80
U/l, Child-Pugh B, ALBI Grade 3, AEs: HFSR, elevated liver enzymes,
stomatitis, hypertension.
2.2. Multivariate analysis of independent factors:
- Factors that were associated with poor PFS were: PS=1, tumour size
>60mm, extrahepatic metastasis (2-fold higher risk of disease progression).
- Factors that were associated with poor OS were: HBV (2,5-fold higher
mortality risk), tumour size >60mm (2,1-fold higher mortality risk),
extrahepatic metastasis (2,7-fold higher mortality risk), Child-Pugh B (2,8fold higher mortality risk), AEs elevated liver enzymes (2-fold higher
mortality risk) and hypertension (reduce 84,6% mortality risk)
RECOMMENDATION
1. ALBI grade should be used widely to prognose HCC patients treated with
sorafenib, in which patient with ALBI Grade 1 had better outcome.
2. The initiation of sorafenib therapy at reduced dose below 800 mg/day was
associated with lower (but not statistically significant) DCR, PFS and OS.
When patients had low starting dose of sorafenib, increment of the dose to
800 mg/day if patients are tolerant is neccessary to achieve optimised
treatment result.