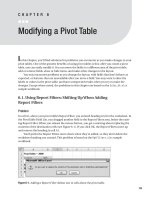
Formatting a Pivot Table
Bạn đang xem bản rút gọn của tài liệu. Xem và tải ngay bản đầy đủ của tài liệu tại đây (464.23 KB, 30 trang )
Formatting a Pivot Table
N
ew formatting features were introduced for pivot tables in Excel 2007, including PivotTable
Styles, Document Themes, Conditional Formatting, and Report Layouts, which add many
exciting options for enhancing the look of your pivot tables. Questions about these new fea-
tures are addressed in this chapter. Common problems with pivot table formatting include
loss of formatting when the pivot table is changed or refreshed, showing or hiding subtotals
and grand totals, and retaining formats applied in the source data.
Unless otherwise noted, the problems in this chapter are based on data in the sample file
named Regions.xlsx.
4.1. Using PivotTable Styles: Applying a Predefined Format
Problem
You create several pivot tables each week. Each pivot table has default formatting applied,
and you spend time changing the colors and borders to match your company’s specifica-
tions. You’d like a quick way to format your pivot table, so it easily coordinates with your
company’s other documents. This example is based on the Regions.xlsx workbook.
Solution
Instead of manually formatting a pivot table, you can apply one of the built-in PivotTable
styles, also called quick styles. Quick styles may affect the color and font formatting, and
they may add borders and row or column shading. Some styles include horizontal borders
or shading, which can make the rows easier to follow in a wide pivot table. Some styles have
dramatic or dark colors that may be best suited for presentations or online viewing, rather
than printing.
Follow these steps to apply a PivotTable style:
1. Select a cell in the pivot table, and on the Ribbon, click the Design tab. In the Pivot-
Table Styles group, you can see one of the styles is selected, and it has a border around
it. This is the style currently applied to your pivot table.
2. Point to one of the PivotTable styles, and the pivot table on the worksheet will show a
preview of that style. Also, the style’s name should appear below the Ribbon, in a
ScreenTip (see Figure 4-1), unless you turned off the Screen Tips feature.
71
CHAPTER 4
Figure 4-1. PivotTable styles
■
Tip
If the preview doesn’t show, you may have this feature turned off in the Excel Options. To turn the
feature on, click the Microsoft Office Button, click Excel Options, and in the Popular features, add a check
mark to Enable Live Preview.
3. To see other rows of PivotTable styles, click the up or down arrow at the right end of the
PivotTable Styles group, or to open the full gallery of PivotTable styles, click the More
button, at the right end of the PivotTable Styles group (shown in Figure 4-1). In the
gallery, you can drag the scroll bar up and down to see the PivotTable styles, which
are grouped as Light, Medium, and Dark.
■
Tip
If you change your mind, and don’t want to apply a style, press Esc on the keyboard, or click outside
the Style gallery, and it will close without applying a style.
4. When you find a PivotTable style you like, click it, to apply that style to your pivot table.
■
Tip
To apply the selected style and remove any formatting manually applied to the pivot table, right-click
the style, and then click Apply and Clear Formatting (this does not remove conditional formatting). If you
don’t use this option, the manual formatting is retained.
How It Works
When you select one of the PivotTable styles, it applies specific cell formatting to different
parts of the pivot table. For example, all the row subtotals may be changed to bold Calibri font,
with blue fill color in the cell. If you change the pivot table layout, the formatting is retained
and adjusts to the new layout.
CHAPTER 4
■
FORMATTING A PIVOT TABLE72
You can quickly modify the appearance of a built-in style by using the PivotTable Style
Options. With these, you turn on or off the special formatting for the headers, rows, and col-
umns. The Row Headers and Column Headers options apply or remove special fonts and fill
colors in the headers. The Banded Rows and Banded Columns apply or remove the shading
from rows and columns.
1. Select a cell in the pivot table, and on the Ribbon, click the Design tab.
2. In the PivotTable Style Options group, add or remove the check marks from the style
options (see Figure 4-2).
Figure 4-2. PivotTable Style Options
4.2. Using PivotTable Styles: Removing a PivotTable Style
Problem
You applied a PivotTable style to a pivot table, and you would like to remove it. You would pre-
fer to have a pivot table with no fill color or header formatting. This example is based on the
Regions.xlsx workbook.
Solution
In the PivotTable Styles gallery, you can apply a special style that removes the existing style,
or you can use a command to clear the existing style. Follow these steps to clear a PivotTable
style:
1. Select a cell in the pivot table, and on the Ribbon, click the Design tab.
2. In the PivotTable Styles gallery, the first style, at the top left of the Light styles, is named
None (see Figure 4-3). Click this style, and the existing style is removed. A thin border
remains around sections of the pivot table, and the gridlines, if displayed, are not visi-
ble within the pivot table.
Figure 4-3. PivotTable style named None
CHAPTER 4
■
FORMATTING A PIVOT TABLE 73
■
Note
When no PivotTable style is applied, the preview function won’t work when you point to a different
style in the PivotTable Styles gallery.
A different way to remove the PivotTable style is to click Clear, at the bottom left of the
PivotTable Styles gallery (see Figure 4-4).
Figure 4-4. Clear a PivotTable style.
4.3. Using PivotTable Styles: Changing the Default Style
Problem
You prefer one of the Dark PivotTable styles, and you apply it to almost every pivot table you
create. You’d like to change the default PivotTable style, to save time when you create new
pivot tables. This example is based on the Regions.xlsx workbook.
Solution
You can change the default PivotTable style to one you prefer. Follow these steps to change the
default:
1. Select a cell in the pivot table, and then on the Ribbon, click the Design tab.
2. In the PivotTable Styles gallery, right-click the style you want to set as the default, and
in the context menu, click Set As Default.
This technique sets the default PivotTable style for the active workbook. If you want to make
this the default style for new workbooks, save the workbook as a template. Then, base new
workbooks on this template, and your default PivotTable style will be available.
4.4. Using PivotTable Styles: Creating a Custom Style
Problem
None of the existing PivotTable styles has the exact formatting you need. You’d like to create
your own PivotTable style, with colors, borders, and fonts that match your company’s docu-
ment specifications. This example is based on the Regions.xlsx workbook.
CHAPTER 4
■
FORMATTING A PIVOT TABLE74
Solution
You can create a custom PivotTable style with the formatting you require. If you find a Pivot-
Table style close to what you need, you can duplicate that style, and modify the duplicate.
Follow these steps to create a custom style, based on an existing style:
1. Select a cell in the pivot table, and then on the Ribbon, click the Design tab.
2. In the PivotTable Styles gallery, right-click the style you want to duplicate.
3. In the context menu, click Duplicate. In this example, Pivot Style Medium 8 was
duplicated.
■
Note
If you don’t want to duplicate any style, click New PivotTable Style, at the bottom of the PivotTable
Styles gallery, and then follow the next steps to name and modify the new style.
4. In the Modify PivotTable Quick Style dialog box, type a name for the new PivotTable
style (see Figure 4-5). In this example, the name is My Gray Style.
Figure 4-5. Modify PivotTable Quick Style dialog box
■
Tip
Click a formatted Table Element, to view a description of its formatting in the Element Formatting
section of the Modify PivotTable Quick Style dialog box.
CHAPTER 4
■
FORMATTING A PIVOT TABLE 75
5. In the Table Element list, elements in bold font have formatting applied. You can mod-
ify these, or clear their formatting. You can also select unformatted elements and
format them to meet your requirements. To modify an element’s formatting, click it
to select it, and then click the Format button.
6. In the Format Cells dialog box, select the Font, Border, and Fill settings you want for
the selected element.
7. Click OK, to return to the Modify PivotTable Quick Style dialog box, where the format-
ted element is listed with a bold font.
8. Repeat Steps 5 to 7, if required, to format other elements.
9. If you want your custom style to be the default PivotTable style, add a check mark to
Set As Default PivotTable Quick Style For This Document.
10. Click OK, to close the Modify PivotTable Quick Style dialog box.
■
Note
The new PivotTable style is not automatically applied to the active pivot table.
The custom PivotTable Style you created is added to a Custom section of the PivotTable
Styles gallery (see Figure 4-6). You can click the custom style there, to apply it to the active
pivot table.
Figure 4-6. The Custom PivotTable styles on the Ribbon
4.5. Using PivotTable Styles: Copying a Custom Style to
a Different Workbook
Problem
You created several custom PivotTable Styles in a workbook, and you would like to copy those
styles to other workbooks. You can’t find any command that will let you copy the styles from one
workbook to another. This example is based on the Custom.xlsx and Regions.xlsx workbooks.
Solution
To copy a custom PivotTable style to another workbook, you can apply that custom style to a
pivot table, and then temporarily copy that pivot table to a different workbook. Follow these
steps to copy from the Custom.xlsx workbook to the Regions.xlsx workbook:
CHAPTER 4
■
FORMATTING A PIVOT TABLE76
1. Select all the cells in a pivot table that has the custom style applied, and then on the
Ribbon’s Home tab, click Copy.
2. Switch to the workbook where you want the copy of the custom style, and then paste
the pivot table.
3. Delete the pasted copy of the pivot table.
The custom PivotTable style now appears in the PivotTable Styles gallery, and it can be
applied to any pivot table in the workbook.
4.6. Using Themes: Impacting PivotTable Styles
Problem
You selected a different Document Theme in your workbook, and it changed the appear-
ance of the worksheets and the styles in the PivotTable Styles gallery. You don’t understand
how Themes work, or why they affect the PivotTable styles. This example is based on the
Themes.xlsx workbook.
Solution
Each Document Theme is a collection of colors, fonts, and visual effects you can share between
Excel and other Office applications. You can use the existing themes, create new themes, or
modify the built-in themes.
To see what theme is currently applied, and what its settings are, you can view the Theme
information on the Ribbon. Activate a worksheet that contains a pivot table, so you can see
the effect of theme changes.
1. On the Ribbon, click the Page Layout tab.
2. In the Themes group, point to the Themes command, and the tooltip then shows the
name of the current theme.
3. To view the color palette for the current theme, in the Themes group, click Colors, to
open the color list. The current theme’s colors are surrounded by a thin border, to show
they are selected. If you point to a different theme’s colors, you can see the preview col-
ors in your pivot table change.
4. A theme has two fonts: one for headings and one for body text. To view the fonts asso-
ciated with the current theme, in the Themes group, click the Fonts command, to open
the list of fonts. The current theme’s fonts are selected, and show the Headings font
and the Body font. If you point to a different theme’s fonts, you can see the preview
fonts in your pivot table change.
5. Finally, a theme also has effects that are used in charts and shapes, so if you create
a PivotChart, its appearance will be affected by the current theme’s effects. To view
the effects associated with the current theme, in the Themes group, click the Effects
command, to open the list of effects. The current theme’s effects are selected, and they
show the line thickness, fill type, and beveling that would be used for charts and
shapes.
CHAPTER 4
■
FORMATTING A PIVOT TABLE 77
If you apply a different theme in your workbook, or modify the current theme, your pivot
table’s appearance and PivotTable styles may be affected. The theme colors and fonts will
override the settings in the PivotTable styles, and they could affect the way the pivot table
appears.
To apply a different theme, follow these steps:
1. On the Ribbon, click the Page Layout tab.
2. In the Themes group, click Themes, and then in the Themes gallery, click the theme
you want to apply.
The colors and fonts in your file will change, and your pivot table and Excel Table may be
wider or narrower, if the fonts are much different. In the Themes group on the Page Layout
tab, the icons have changed, to reflect the colors, fonts, and effects of the current theme. In the
PivotTable Styles gallery, the styles use the colors from the new theme. Even the font in the
row and column buttons changes to the Body font for the current theme.
4.7. Using the Enable Selection Option
Problem
In your pivot table, the Region and City fields are in the Row Labels area. You want to use a
different font size for the Region subtotals, and you’d like to select and format all the subto-
tals at the same time, instead of formatting each one separately. This example is based on the
Regions.xlsx workbook.
Solution
If the subtotals are at the bottom of the group, in either the Row Labels area or the Column
Labels area, you can select them all, and then format them together. To select them, you may
have to activate the Enable Selection option.
1. Select a cell in the pivot table, and on the Ribbon, click the Options tab.
2. In the Actions group, click Select, and then check to see if Enable Selection is activated
(see Figure 4-7).
Figure 4-7. The Enable Selection option turned on
3. If Enable Selection isn’t activated, click it to activate the feature. If it is activated, click
the worksheet, to close the menu without making a selection.
4. To select subtotals for a Row Labels field, point to the left edge of a cell that contains a
subtotal label, and when the pointer changes to a black arrow shape (see Figure 4-8),
click to select all the subtotals for that field.
CHAPTER 4
■
FORMATTING A PIVOT TABLE78
Figure 4-8. The black arrow pointer at the left of the subtotal in Row 8
5. If the subtotals are for a Column Labels field, point to the top edge of a cell that con-
tains a subtotal label, and when the pointer changes to a black arrow shape, click to
select all the subtotals for that field.
6. Format the selected subtotals, using the commands on the Ribbon’s Home tab.
4.8. Losing Formatting When Refreshing the Pivot Table
Problem
You manually adjusted the column widths and applied formatting to the cells in your pivot
table. However, your pivot table formatting is lost when you refresh the pivot table or change
the pivot table layout. Even changing the report filter causes the formatting to be lost. This
example is based on the LoseFormat.xlsx workbook.
Solution
Most formatting can be preserved if you change the Format options in the PivotTable Options
dialog box.
1. Right-click a cell in the pivot table, and then choose PivotTable Options.
2. On the Layout & Format tab, in the Format options, remove the check mark from
Autofit Column Widths on Update. This prevents the column width from changing,
if you have manually adjusted it.
3. Add a check mark to Preserve Cell Formatting on Update, and then click OK.
Then, when you apply formatting, do the following:
1. Ensure that Enable Selection is turned on (as shown in Figure 4-7).
2. Unless you want to format a single cell, use the pivot table selection technique to select
the elements you want to format (point to the top or left edge of the element, and then
click when the black arrow appears).
4.9. Hiding Error Values on Worksheet
Problem
Errors, such as #N/A, are in the Excel Table on which the pivot table is based, and you’d like to
hide them in the pivot table. This example is based on the Errors.xlsx workbook.
CHAPTER 4
■
FORMATTING A PIVOT TABLE 79
Solution
By default, error values are displayed in a pivot table. You can hide the errors by changing the
PivotTable Options, so blank cells appear instead of the errors:
1. Right-click a cell in the pivot table, and in the context menu, click PivotTable Options.
2. In the PivotTable Options dialog box, click the Layout & Format tab.
3. In the Format section, add a check mark to For Error Values Show (see Figure 4-9).
Figure 4-9. Format option for error values
4. Leave the text box blank, and the errors will be replaced with blank cells, and then click
OK to close the dialog box. If you prefer, you could type other characters, such as a
hyphen, in the text box, and the error values will be replaced by that character.
■
Note
This setting only affects cells in the Values area of the pivot table. If error values appear in the Row
Labels, Column Labels, or Report Filter areas, they won’t be replaced.
4.10. Showing Zero in Empty Values Cells
Problem
Some cells in the Values area are empty, and you’d prefer they contain a zero or a couple of
dashes. This example is based on the Regions.xlsx workbook.
Solution
You can change the PivotTable Options and display any number or character, in a Values cell
where there is no data:
1. Right-click a cell in the pivot table, and in the context menu, click PivotTable Options.
2. On the Layout & Format tab, add a check mark to For Empty Cells, Show and, in the
text box, type a zero (see Figure 4-10). Click OK to close the dialog box.
Figure 4-10. Format option for empty cells
CHAPTER 4
■
FORMATTING A PIVOT TABLE80
4.11. Hiding Buttons and Labels
Problem
You’re sending your pivot table to a colleague, and you want to hide some of the buttons and
filter drop-downs in the pivot table before you send it. Your colleague isn’t too familiar with
pivot tables, and you want to make it look as simple and uncluttered as possible. This example
is based on the Regions.xlsx workbook.
Solution
You can change the Pivot Table Options to hide some of the buttons and captions in the pivot
table. Follow these steps to hide some of the features:
1. Right-click a cell in the pivot table and, in the context menu, click PivotTable Options.
2. On the Display tab, remove the check mark from Show Expand/Collapse Buttons. This
hides the buttons to the left of the outer Row Labels and Column Labels.
3. Also remove the check mark from Display Field Captions and Filter Drop Downs. This
hides the filter buttons, as well as the Row Labels and Column Labels captions.
4. Click OK to close the PivotTable Options dialog box.
4.12. Applying Conditional Formatting: Using a Color Scale
Problem
You’ve created a pivot table report to send to the store managers. Your pivot table is a dense
block of numbers, with the Product field in the Row Labels area, the Store field in the Column
Labels area, and the TotalPrice field in the Values area. You’d like to color the Values cells, to
highlight the highest and lowest values.
Instead of reading all the numbers, the store managers could quickly identify the prod-
ucts and stores with the strongest sales because cells that contain those values would be
colored green. The products and stores with the weakest sales would have values in red cells—
a signal for trouble! The reasons for those low sales could be investigated. This example is
based on the Stores.xlsx workbook.
Solution
You can use conditional formatting to add visual impact to the data in a pivot table, just as
with other cells in the workbook. To quickly format the cells in a pivot table, you can use one
of the built-in color scales.
Follow these instructions to add a conditional formatting color scale to a pivot table with
a single block of cells to format.
CHAPTER 4
■
FORMATTING A PIVOT TABLE 81
1. In the pivot table Values area, select the cells you want to color. In the sample file,
select cells B5:E15.
■
Caution
Do not include the Grand Total rows or columns, or they will be colored as the highest values.
2. On the Ribbon, click the Home tab, and in the Styles group, click Conditional
Formatting.
3. In the list of conditional formatting options, click Color Scales, and then click the first
option—Green-Yellow-Red Color Scale.
■
Tip
In the Color Scales menu, point to any of the color scale options to see a preview of the formatting on
the selected cells.
How It Works
In a three-color scale, the cells with the lowest, median, and highest values are a solid color,
and cells with values in between have a graduated color. In the Green-Yellow-Red color scale,
the cell with the highest value is solid green, the cell with the median value is solid yellow, and
the cell with the lowest value is solid red.
Two-color scales, which use one color for the cell with the highest number, and a second
color for the cell with the lowest number, are also available. Cells with values between the
highest and lowest are shaded in a graduated color scale.
■
Note
Cells with no data will not be formatted.
4.13. Applying Conditional Formatting: Using an Icon Set
Problem
Your pivot table has a list of sales totals for each product, and instead of numbers, you’d like to
show traffic lights, to indicate the high, low, and middle results. This can create a simple report
you can share with employees, without disclosing all the numbers. This example is based on
the Products.xlsx workbook.
CHAPTER 4
■
FORMATTING A PIVOT TABLE82