Printing and Extracting Pivot Table Data
Bạn đang xem bản rút gọn của tài liệu. Xem và tải ngay bản đầy đủ của tài liệu tại đây (307.09 KB, 22 trang )
Printing and Extracting
Pivot Table Data
O
ne of the strengths of pivot tables is the capability to change the layout and analyze data
from different perspectives. Sometimes, though, you want a static picture from the pivot table
and need to print the data. For the most part, pivot tables print the same as other data on a
worksheet, but you can apply a few special settings to a pivot table. Some printing issues, such
as printing a copy of the pivot table for each item in the Report Filter field, can be solved by
programming, and examples are given in Chapter 11.
After you create a pivot table, you may want to extract some of the summarized data for
use in other parts of the workbook. The GetPivotData worksheet function can be used for
retrieving specific data from the pivot table. Another way to extract data is to use the Show
Details feature, which returns records from the source data for the selected pivot table cell.
Finally, the Show Report Filter Pages feature can be used to create copies of the pivot table on
newly inserted worksheets.
Except where noted, the RegionSales_09.xlsx workbook is used as the sample file for the
problems in this chapter.
9.1. Repeating Pivot Table Headings
Problem
Your pivot table spans several printed pages and the report filter, row labels, and column
labels only print on the first page. You want the heading rows and labels on every page, so
readers can understand the report. In your pivot table, the Product and OrderDate fields are in
the Row Labels area, Region is in the Column Labels area, Category is in the Report Filter area,
and Sum of TotalPrice is in the Values area. This problem is based on the RegionSales_09.xlsx
workbook.
Solution
You can set options for the pivot table to make the heading rows and labels appear on every
page when you print the pivot table. There are two settings to change:
167
CHAPTER 9
• The print titles option determines if the heading rows and columns appear at the top
and left on each printed page.
• The row labels option determines if row labels are repeated if their items continue on
another page.
Setting Print Titles
Before you turn on this option, clear any entries for row and column print titles on the work-
sheet, as described in the following steps. If either of these boxes contains an entry, the Set
Print Titles option won’t be applied for the pivot table.
1. On the Ribbon, click the Page Layout tab, and in the Page Setup group, click Print
Titles. The Page Setup dialog box opens with the Sheet tab activated.
2. Under Print titles, clear the Rows to Repeat at Top and Columns to Repeat at Left
boxes, and then click OK.
3. Right-click a cell in the pivot table, and then click PivotTable Options.
4. On the Printing tab, add a check mark to Set Print Titles, and then click OK.
Repeating Row Labels
You can change a pivot table option so the labels appear on each page. This option has no
effect if the pivot table is in the Compact Form layout, so if one of the other report layouts isn’t
already applied, the first step is to select one of them.
■
Note
This setting will have no effect if the pivot table is in the Tabular Form layout and the option for
Merge Labels is turned on.
1. Select a cell in the pivot table, and on the Ribbon’s Design tab, in the Layout group,
click Report Layout.
2. Click Show in Outline Form, or click Show in Tabular Form. The pivot table layout
changes to show each field in the Row Labels area in a separate column, instead of all
fields in a single column.
3. Right-click a cell in the pivot table, and then choose PivotTable Options.
4. On the Printing tab, add a check mark to Repeat Row Labels on Each Printed Page, and
then click OK.
5. Click the Microsoft Office Button, and then point to Print, and click Print Preview, to
see the changes to the report setup. Headings repeat on all pages, and the row labels
repeat if their items continue on another page. In Figure 9-1, the Banana label is
repeated at the top of Page 2.
CHAPTER 9
■
PRINTING AND EXTRACTING PIVOT TABLE DATA168
■
Note
If you zoom in or out in Print Preview, the repeated row labels may disappear temporarily.
Figure 9-1. Headings and row labels repeat in print preview.
How It Works
When you turn on the Set Print Titles option, it adds settings to the Print Titles boxes in the
Page Setup dialog box, on the Sheet tab. To see the settings, on the Ribbon’s Page Layout tab,
in the Page Setup group, click Print Titles.
■
Caution
If you clear the Print Titles settings in the Page Setup dialog box after turning on the Set Print
Titles option, you have to turn the Set Print Titles option off, and then turn it back on, for it to take effect.
Only one pivot table per worksheet can have the Set Print Titles option selected. If the set-
ting is turned on in one pivot table, the option is unavailable in the PivotTable Options dialog
box for other pivot tables (see Figure 9-2).
Figure 9-2. The Set Print Titles option is unavailable.
When the Set Print Titles option is selected, the report filter, row labels, and column labels
print on every page. If multiple pivot tables are on the worksheet, or other data, the pivot table
headings also print with those.
CHAPTER 9
■
PRINTING AND EXTRACTING PIVOT TABLE DATA 169
9.2. Setting the Print Area to Fit the Pivot Table
Problem
Your pivot table frequently changes size, and you have to reset the print area every time you
want to print it. You would like the print area to adjust automatically, so you don’t waste paper,
or print only part of the pivot table. This problem is based on the PrintArea.xlsx workbook.
Solution
Don’t set a print area on the sheet with the pivot table, and the entire pivot table will print, no
matter what its size, although it may span several printed pages. To remove an existing print
area, on the Ribbon’s Page Layout tab, in the Page Setup group, click Print Area, and then click
Clear Print Area.
If you’re setting a print area because other items are on the sheet that you don’t want to
print, move those items to another sheet, if possible, so you can print the pivot table separately.
If the items must remain on the same sheet as the pivot table, use the following technique
to quickly set a print area that encompasses the entire pivot table:
1. Select a cell in the pivot table, and on the Ribbon’s Options tab, in the Actions group,
click Select, and then click Entire PivotTable.
2. On the Ribbon’s Page Layout tab, in the Page Setup group, click Print Area, and then
click Set Print Area.
■
Tip
You can add Select Entire PivotTable and Set Print Area buttons to the Quick Access Toolbar.
9.3. Printing the Pivot Table for Each Report Filter Item
Problem
Several stores carry your products, and you were asked to send each store manager a printed
copy of the pivot table, customized to show their sales results. You added the Store field to
the Report Filter area, and you can select a store in the report filter, to show its totals in the
pivot table, and then print the worksheet. However, you’d like to find a more efficient way to
print the reports, because you’ll have to do this each week. This problem is based on the
RegionSales_09.xlsx workbook.
Solution
You can use the Show Report Filter Pages feature to create a worksheet for each item in the
Store report filter field. Then, you can group the worksheets and print them:
CHAPTER 9
■
PRINTING AND EXTRACTING PIVOT TABLE DATA170
■
Tip
Before using the Show Report Filter Pages command, select (All) from the Store report filter. If a store
is selected, a worksheet will not be created for that store.
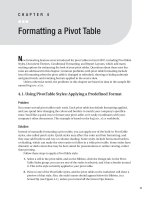
1. Select a cell in the pivot table, and on the Ribbon’s Options tab, in the PivotTable group,
click the arrow for Options, and then click Show Report Filter Pages (see Figure 9-3).
Figure 9-3. Show Report Filter Pages command
2. In the Show Report Filter Pages dialog box, select the Store field, and then click OK. A
worksheet with a copy of the pivot table is then created for each store, with the store’s
name on the sheet tab, and that store is selected in the report filter.
3. To select all the worksheets created, click the sheet tab for the first store sheet at the
left, and then scroll to see the last store’s sheet tab. Hold the Shift key, and click the last
store’s sheet tab.
■
Caution
While the sheets are grouped, any changes you make to the active sheet are also made to the
other sheets in the group.
4. While the sheets are grouped, you can set the Page Setup options, if desired. On the
Ribbon’s Page Layout tab, in the Page Setup group, click the commands to set the mar-
gins, orientation, or other options. To open the Page Setup dialog box, click the dialog
launcher at the bottom right of the Page Setup group (see Figure 9-4).
Figure 9-4. Page Setup dialog launcher
CHAPTER 9
■
PRINTING AND EXTRACTING PIVOT TABLE DATA 171
5. To print the grouped sheets, click the Microsoft Office Button, and then click Print.
6. After printing, you can delete the Store sheets that were created, or close the workbook
without saving the changes.
9.4. Printing Field Items: Starting Each Item on a New Page
Problem
Your pivot table has Store and Product in the Row Labels area, and when you print your pivot
table, you want each store’s data to start on a new page. This enables you to print the entire
report, and send each store its own section. This problem is based on the RegionSales_09.xlsx
workbook.
Solution
You can change a setting in the Store field, so each item starts on a new page in the printed
report:
1. Right-click one of the Store labels in the pivot table, and then click Field Settings.
2. In the Field Settings dialog box, on the Layout & Print tab, add a check mark to Insert
Page Break After Each Item.
3. Click OK, to close the dialog box.
■
Tip
When starting each item on a new page, your pivot table may be easier to understand if you set the
pivot table print titles, as described in Section 9.1. This repeats the pivot table headings on each page, so
they’re visible with each store’s data.
Notes
Using the Insert Page Break After Each Item setting won’t ensure all items for a field fit on one
page. It only ensures the next item will start on a new page. For fields with many items, two or
more pages may be required.
If several of the fields have a short list of items, your printed report could end up using an
excessive amount of paper with this setting. You may prefer to turn the setting off and manu-
ally adjust the page breaks in Page Break Preview. On the Ribbon’s View tab, in the Workbook
Views group, click Page Break Preview. Dashed lines indicate an automatic page break and
solid lines are manual page breaks. To move a page break, point to it, and drag up or down on
the page.
■
Note
You can’t move or delete the page breaks created by the Insert Page Break After Each Item setting.
CHAPTER 9
■
PRINTING AND EXTRACTING PIVOT TABLE DATA172
9.5. Printing in Black and White
Problem
You applied the PivotTable Style Medium 16, which has a blue fill color in the cells, and it has
black headings with white text. This style is attractive on the worksheet, but it’s difficult to read
when you print it on your black and white printer. You’d like to print the worksheet without all
the shading, so it’s easy to read and uses less toner or printer ink. This problem is based on the
RegionSales_09.xlsx workbook.
Solution
You can change a page setup option, so the shading is removed when printing:
1. On the Ribbon’s Page Layout tab, click the dialog launcher at the bottom right of the
Page Setup group.
2. In the Page Setup dialog box, on the Sheet tab, add a check mark to Black and White.
3. Click OK, to close the dialog box, or click Print Preview, to see the revised coloring. All
the text is in black font, and all the fill color is removed from the cells.
9.6. Extracting Underlying Data for a Value Cell
Problem
Your pivot table summarizes discount amounts per store, for each category. The Category field
is in the Column Labels area, Store is in the Row Labels area, and Discount is in the Values area,
as Sum of Discount. One store shows a very high discount total for the Cookies category, and
you’d like to see more detail on those orders. None of the other stores is close to this amount,
and you wonder if an error occurred in the data, or if there’s another cause for the high amount.
This problem is based on the RegionSales_09.xlsx workbook.
Solution
For pivot tables based on non-OLAP source data, you can use the pivot table’s Show Details
feature to extract the source data. For this example, in the pivot table, simply double-click the
cell that contains the high discount total.
The Show Details feature extracts the records that contribute to the summarized data, and
sends the records to a new sheet in the active workbook. On that sheet, you can examine the
records to see if a problem exists.
■
Tip
Instead of double-clicking a cell, you can right-click a cell in the Values area of the pivot table, and
then, in the context menu, click Show Details.
CHAPTER 9
■
PRINTING AND EXTRACTING PIVOT TABLE DATA 173
If you double-click a cell in the pivot table, you may see an error message that says,
“Cannot change this part of a PivotTable report.” The Show Details feature may be turned off
in the PivotTable Options dialog box. To turn it on, follow these steps:
1. Right-click a cell in the pivot table, and then choose PivotTable Options.
2. On the Data tab, add a check mark to Enable Show Details, and then click OK to close
the PivotTable Options dialog box.
How It Works
The Show Details feature uses the information stored in the pivot table’s pivot cache to create
a new sheet that shows the related records from the original source data. It’s a good way to
investigate anomalies in the summarized data.
The extracted records are copies of the original records in the source data for the pivot
table. They are not connected to the original records or to the pivot table.
■
Note
If you make changes in the exported records, this will have no effect on the pivot table, and the
changes will not be reflected in the original records.
If Show Details is used in a pivot table, all columns from the source data are shown, not
just the fields currently in the pivot table layout.
A new worksheet is automatically created for the extracted records; you can’t change a
setting to control where the extracted records are placed.
9.7. Re-creating the Source Data Table
Problem
Someone accidentally deleted the worksheet that contained the source data for your pivot
table, and you would like to re-create it. (Yes, you know you should have kept a backup copy!)
This problem is based on the SourceData.xlsx workbook.
Solution
You may be able to use the pivot table’s Show Details feature to re-create the source data:
1. Ensure that none of the items in the visible fields are hidden. Each report filter field
should have (All) selected, and the (Select All) item should be checked in each of the
row and column fields. To clear all the filters, on the Ribbon’s Options tab, in the
Actions group, click Clear, and then click Clear Filters.
■
Tip
You don’t need to include all fields in the pivot table to see them in the Show Details output. A pivot
table with just one field in the Values area, and nothing in the Row Labels, Column Labels, or Report Filter
areas, can output all the source data when the grand total cell is double-clicked.
CHAPTER 9
■
PRINTING AND EXTRACTING PIVOT TABLE DATA174