tiểu luận kinh tế lượng HOW EXPORT AND FDI AFFECTS IMPORT IN VIET NAM (1986 2018)
Bạn đang xem bản rút gọn của tài liệu. Xem và tải ngay bản đầy đủ của tài liệu tại đây (401.47 KB, 17 trang )
FOREIGN TRADE UNIVERSITY
FACULTY OF INTERNATIONAL ECONOMICS
---------***--------
ECONOMETRICS REPORT
HOW EXPORT AND FDI AFFECTS IMPORT IN
VIET NAM (1986-2018)
Group 7:
Nguyễn Trọng Khoa
Trần Thị Ngọc Diệu
Trương Công Toàn
Lecturer: PhD. Từ Thuý Anh
Hanoi, 10/2019
TABLE OF CONTENTS
I. Introduction
2
II. Literature Review
2
III. Theoretical background
3
IV. Econometric model
4
V. Data collection
5
1. Data overview
5
2. Data description
5
VI. Estimation of econometric model
5
1. Checking the correlation among variables
5
2. Regression run
6
3. Testing
7
4. Solution
13
VII. Conclusion
14
VIII. References
16
2
2
I. INTRODUCTION
As much as Economy is a meaningful science that determines the social
development in general and national growth in particular, Econometrics is the use of
statistical techniques to understand those issues and test theories. Without evidence,
economic theories are abstract and might have no bearing on reality (even if they are
completely rigorous). Econometrics is a set of tools we can use to confront theory
with real-world data.
Since its inception, econometrics has provided economists with a sharp
instrument for measuring economic relations. As economics students, we recognize
the need to study and learn about Econometrics in logical and problem analysis. To
better understand how to put the Econometrics into reality and to apply the
Econometrics effectively and correctly, our team would like to develop the
econometrics report under the guidance of PhD. Tu Thuy Anh. In this report, we used
the econometric analysis tool Gretl to analyze the topic "How Export and FDI affect
Import in Vietnam in the period of 1986-2018".
To the extent of purpose and resources, there are still deficiencies in this report,
but we look forward to providing readers with a decent view of the overall of the data
set given and the knowledge that we have gained through PhD. Tu Thuy Anh’s
Econometrics course.
II. LITERATURE REVIEW
Globalization and international economic integration are indispensable trends
of all countries in the world today. With the accession to world economic
organizations and especially becoming an official membership of the World Trade
Organization (WTO), Vietnam has been actively participating in this trend. The World
Trade Organization is the biggest trade organization in the world, accounting for
nearly 90% of world trade. Joining the WTO is participating in the common playing
field of the world market, promoting trade and investment promotion.
Firmly integrated into international economic relations, Vietnam has an
opportunity to expand exports of goods in which the country has strengths. Thanks to
the high export of mourning, it helped to increase the amount of foreign currency for
3
3
import, boosting the increase of imports. Along with the increase of international
trade, FDI has also increased, creating new industries and products to diversify the
domestic market, reducing imported goods from foreign, contributing to improving
the balance of international payments.
Thus, it is essential to understand and evaluate the actual import, export and
foreign direct investment of FDI in Vietnam in the current context of the economy.
III. THEORETICAL BACKGROUND
From 1986 up to now, Vietnam has adapted various innovative economic
strategies and the Sixth Party Congress (December,1986) was considered as the basic
turning-point of the Socialism in Vietnam with the introduction of guidelines for the
comprehensive renovation of our country in terms of thoughts, organizational and
personnel structure, administrative system, economic system, political system and
other fields in the society. The initiative launched in 1986 should be considered as a
milestone for the transition from centrally-planned economy to socialist-oriented
market economy together with a range of social, political and economical changes in
Vietnam. The private production and business innovative idea was the general breakthrough since 1986 up to now. With the application of “Khoan 100”, “khoan 10” in
agricultural sector; “market price structure” economic sector or Vietnam would like to
be friend of all nations and territories in the world in foreign policy, Vietnam has
gradually established and expanded import-export markets and trade partners in the
direction of multilateral relationships. The successes of Vietnam’s foreign trade are
showed by statiscal figures in the five year periods of development during 1986-2018.
The average of total merchandise trade from 1986-2018 is 103.626 billion USD. In
each period, the growth rate is quite high. For example, the growth rate in the period
of 1996-2000 tripled compared to that of the previous period, reaching approximate
100 billion USD (the average growth rate is 17,2 percent). regards to the period of
2001-2005, the growth rate almost doubled compared to that of the previous period, at
241 billion USD (The average growth rate is 18.2 percent). Of which, domestic
economic sector in the 1986-1990 period played the most important role, making up
96.6 percent f total trade. From 1986 to 2018, export value increases from 789 million
4
4
USD to 243,483 million USD and import value increases from 2.155 Billion USD in
1986 up to 236.687 billion USD in 2018, which is approximately 115th-fold increase
only.the average growth rate of import value in 1991-1995 is the highest, at 127.3
percent.
Foreign direct investment (FDI) is an important source of capital to supplement
the total investment capital for economic growth of each country, including Vietnam.
Since the Law on Foreign Investment was adopted in 1987, Vietnam has attracted a
large amount of foreign capital, and this capital inflow has made important
contributions to economic development. Since 1986, Vietnam has undertaken a
comprehensive renovation of the country. Compared to reform and transition from a
planned economy to a market economy in other countries, innovation in Vietnam has
its own characteristics. Innovation in Vietnam takes place in two dimensions: "from
the bottom up" in cooperatives, enterprises and "top down" means the decisions of
the Party and the State. Relationship bidirectional for the renovation in Vietnam took
place without conflict between "top" and "bottom", nor the "shock" is too strong to
be created by the tough policies and measures and the willpower of the "top"
leadership. This is a remarkable feature of the process of innovation in Vietnam, both
the top-down leadership and the creativity of the people from below. Therefore,
innovation has led to success. This study aims to find relationships between exports,
import, and FDI in the period 1986 - 2018. The results show that there is a long and
significant relationship between investment and exports with total domestic output
at a 95% confidence level.
IV. ECONOMETRIC MODEL
To demonstrate the relationship between Import and other factors, the
regression function can be constructed as follows:
The Population regression function is set up:
The Sample regression function is set up:
5
5
where:
β0 is the intercept of the regression model
βi is the slope coefficient of the independent variable xi
u is the disturbance of the regression model
is the estimator of β0
is the estimator of βi
From this model, this report is interested in explaining Import in terms of
Export and FDI.
V. DATA COLLECTION
1. Data overview
This set of data is a secondary one, as they are collected from a given source.
Data source: The World Bank, General Statistics Office of Viet Nam.
The structure of Economic data: Time series data.
2. Data description
Function we have in this report will include these following variables:
- Dependent variable: Import – The import of Vietnam from 1986 to 2018
(USD Million).
- Independent variables:
Export – The export of Vietnam from 1986 to 2018 (USD Million).
FDI – Foreign Direct Investment net inflows from 1986 to 2018 (USD
Million).
Exhibit 1: Statistic indicators of variables in the model
where:
S.D. is the standard deviation of the variable
Min is the minimum value of the variable
Max is the maximum value of the variable
6
6
VI. ESTIMATION OF ECONOMETRIC MODEL
1. Checking the correlation among variables
First of all, the correlation of l_Import, Export and FDI is checked by
calculating the correlation coefficient among these variables. The correlation
coefficient measures the strength and direction of a linear relationship between two
variables.
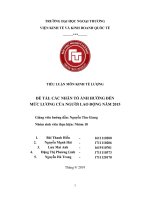
Exhibit 2: Correlation Matrix for Log – linear Model:
As we can see:
+ Import is directly proportional to Export. The set standard between these two
variables is quite high.
+ Import is directly proportional to FDI. The set standard between these two
variables is quite high
2. Regression run
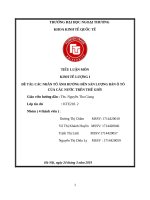
Exhibit 3: Regression model
7
7
Equation of regression:
Data explanation:
: When all the independent variables are zero, the expected value of Import is
8.74558 (USD Million).
: When Export increases by 1 (USD Million), keeping the value of FDI
constant, the Expected value of Import increases by %.
: When FDI increases by 1 (USD Million), keeping the value of Export
constant, the Expected value of Import increases by 0.00372087%.
The coefficient of determination R2:
- In our results, we can see R2 which indicates that the model explains all the
variability of the response data around its mean.
- That R2 = 0.723195 is quite high, which suggests that the model is good fit,
which means 70.5324 % of the sample variation in the percentage vote for dependent
variable (Import) is explained by the changes in the independent variables (Export,
FDI).
3. Testing
3.1. Testing hypothesis
3.1.1. Testing an individual regression coefficient
Purpose: Test for the statistical significance or the effect of independent
variables on dependent one. We have: α = 0.05
Testing the Export:
Given that the hypothesis is:
We see:
P-value of Export is 0.000000226 < 0.05 → Reject H 0 → The coefficient β2 is
statistically significant at the 5% significance level.
Testing the FDI:
Given that the hypothesis is:
We see:
8
8
P-value of FDI is 0.0048 < 0.05 → Reject H 0 → The coefficient β3 is
statistically significant at the 5% significance level.
3.1.2. Testing the overall significance
Purpose: Test the null hypothesis stating that none of the explanatory variables
has an effect on the dependent variable. We have: α = 0.05
Given that the hypothesis is:
We have:
P-value(F) = 4.29153e-09 < α= 0.05 → Reject H 0→ All parameters are not
simultaneously equal to zero → At least one variable has an effect on dependent one.
→ At the 5% significance level, the model is statistically fitted.
3.2. Testing the model’s problem.
3.2.1. Testing Omit variable.
Given that the hypothesis is:
Ramsey’s RESET:
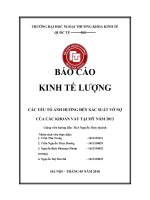
Exhibit 4: Ramsey’s RESET
We see:
p-value = P(F(2,28) > 13.4917) = 7.89e-05 < α = 0,05 → Reject H 0 → The
model omits variable.
3.2.2. Testing multicollinearity.
9
9
Multicollinearity is the high degree of correlation amongst the explanatory
variables, which may make it difficult to separate out the effects of the individual
regressors, standard errors may be overestimated and t-value depressed. The problem
of Multicollinearity can be detected by examining the correlation matrix of regressors
and carry out auxiliary regressions amongst them.
Using the following command vif regression to examine multicollinearity. VIF
commands specific to the variance inflation factor, if VIF is greater than 10, you have
high multicollinearity and the variation will seem larger and the factor will appear to
be more influential than it is. If VIF is closer to 1, then the model is much stronger, as
the factors are not impacted by correlation with other factors.
Exhibit 5: Multicollinearity test
We see:
VIF (Export) = 1.149 < 10
VIF (FDI) = 1.149 < 10
→At the 5% significance level, the model does not contain perfect
multicollinearity.
10
10
3.2.3. Testing Heteroskedasticity.
Heteroskedasticity indicates that the variance of the error term is not constant,
which makes the least squares results no longer efficient and t tests and F tests results
may be misleading. The problem of Heteroskedasticity can be detected by plotting the
residuals against each of the regressors, most popularly the White’s test. It can be
remedied by prespecifying the model look for other missing variables.
Given that the hypothesis is:
White’s test:
Exhibit 6: Heteroskedasticity test
We see:
p-value = P(Chi-square(5) > 14.792439) = 0.011287 < α = 0.05
→At the 5% significance level, there is enough evidence to reject H 0 and
conclude that this set of data meets the problem of Heteroskedasticity.
3.2.4. Testing normality of residual
11
11
In statistics, normality tests are used to determine if a data set is well-modeled
by a normal distribution and to compute how likely it is for a random variable
underlying the data set to be normally distributed.
Given that the hypothesis is:
Using normality of residual in Gretl:
Graph 1: Normality of residual test
We see:
Chi-square(2) = 4.110 with p-value 0.1281 > α = 0.05
12
12
→ At the 5% significance level, the model has normality. Even the u does not
come from a normal distribution parameters estimates will be asymptotically normal
according to Central Limit Theorem.
3.2.5. Testing autocorrelation
Autocorrelation can be defined as correlation between the variables of some
observations at different points of time.
Given that the hypothesis is:
Using autocorrelation (Breasch-Godfrey test) in Gretl:
Exhibit 7: Breasch-Godfrey test
We see: p-value = 0.0003 < α = 0.05
→ At the 5% significance level, the model do not have autocorrelation.
4. Solution
Correcting Omit variable
13
13
After reviewing a number of papers of other authors, we found that the model
may lack some of the following variables: Population growth rate, Government
spending, Money supply…
However, due to the limited time and capacity to collect information, the data
of the missing variables could not be collected. This is a weakness of the model, so it
will need to be overcome in the future to bring better efficiency.
Correcting Heteroskedasticity
In a well-fitted model, there should be no pattern to the residuals plotted
against the fitted values - something not true of our model. Ignoring the outliers at the
top center of the graph, we see curvature in the pattern of the residuals, suggesting a
violation of the assumption that price is linear in our independent variables. We might
also have seen increasing or decreasing variation in the residuals— heteroskedasticity.
To fix the problem, robust standard errors are used to relax the assumption that
errors are both independent and identically distributed.
Exhibit 8: Regression model using robust standard errors
Note that comparing the results with the earlier regression, none of the
coefficient estimates changed, but the standard errors and hence the t values are
different, which gives reasonably more accurate p values.
14
14
Exhibit 8: Correcting heteroskedasticity
Still, At the 5% significance level, the model after using Robust standard errors
meets the problem of heteroskedasticity.
VII. Conclusion
Our research is analyzed and has focused on the factors that possibly affect
Import of Vietnam from 1986 to 2018. After giving hypotheses, comparing with some
related research results as well as analyzing the data collected, we came to conclusion
with some key findings below:
Assuming other factors holding constant, we have: Export and FDI
contributing to the Import of Vietnam. But there are many other factors that affect
Import such as GDP.
Lastly, there are a large number of ways to conduct this research even deeper
and arrive at even more important, perhaps not-yet-uncovered conclusions. In terms of
the conclusions for this project, a deeper analysis might also be able to uncover any
spillover effects that could go on to affect Import of Vietnam more.
Again, due to the limitation of understanding and resources, our report may
contain misinterpretations. We hope that Ms. Tu Thuy Anh and readers can give us
constructive comments on the report so that we would improve ourselves and do
better in the future.
15
15
16
16
VIII. References
1. The relationships between, GDP, FDI, Import and Export in Vietnam after 30 years
Reforms - Do Thi Thao
( />fbclid=IwAR048679I19SgIGNhpvmpdHCHqpc5EIBp1GUMzanKHx3T4KhJHIcwE1DRs)
17
17