tiểu luận kinh tế lượng EFFECT OF EDUCATION ON WAGE EARNING IN THE USA IN 1980
Bạn đang xem bản rút gọn của tài liệu. Xem và tải ngay bản đầy đủ của tài liệu tại đây (194.42 KB, 22 trang )
FOREIGN TRADE UNIVERSITY
FACULTY OF INTERNATIONAL ECONOMICS
---------***--------
ECONOMETRICS REPORT
EFFECT OF EDUCATION ON WAGE-EARNING IN
THE USA IN 1980
Name
Đồng Huyền Anh
Ngô Bảo Huy
Student ID
1815520148
1815520178
Trịnh Thị Yến Linh
1815520197
Lecturer: Dr. Từ Thuý Anh
Ha Noi, 2019
ABSTRACT
A.Introduction
1. About the topic…………………………………………………………………………….4
2. Literature review…………………………………………………………………………..4
3. Theoretical background…………………………………………………………………….7
B.Content
I. Describe the variables…………………………………………………………………………8
II. Describe the data
1. Data overview………………………………………………………………………………8
2. Data collection……………………………………………………………………………...9
III. Describe the correlation between variables………………………………………………10
IV. Econometrics model………………………………………………………………………..11
V. Estimation of econometric model…………………………………………………………..11
VI. Hypothesis testing
1. Testing the overall significance…………………………………………………………..13
2. Testing model’s problem.
2.1. Testing Omit variable……………………………………………………………….13
2.2. Testing multicollinearity…………………………………………………………….14
2.3. Testing Heteroskedasticity…………………………………………………………..16
C. Summary…………………………………………………………….……….....................18
D. References…………………………………………………………………………………19
1
Abstract
Nowadays, education is one of the most important issues in the individual development
of people in society. Therefore, the attention on the development of education is
increasing. During the past years, several economic theorists have studied education and
training concepts. Econometrics has been identified as the most common technique in
previous studies. In this research, the income values in different levels of education are
examined. Moreover, in this study, the meaningfulness of coefficient and regression
equations is examined. Finally, the reformed equations of income are developed at
different levels of education.
Our research includes 3 parts:
Part 1: INTRODUCTION
Firstly, to make sure that everyone has an overview of this topic, we prepare an
introduction to the Effect of Education on Wage Earning and literature review. Besides, a
theoretical background, which illustrates the theories used in this research will be
discussed.
Part 2: CONTENT
This is the most important part of this research that points to capture and process data
based on analytical methods of econometrics before creating the regression model of
factors affecting the Wage Earning of America in… . Also, the robustness check will be
added to clarify the accuracy of this model in the following chapter.
Part 3: SUMMARY
In the end, we will summarize and evaluate the research. According to this evaluation, we
will suggest some solutions to discuss.
2
Finally, we hope that we can receive more feedback and distributions to complete this
research.
1. RESEARCH OBJECTIVES
1.1. GENERAL OBJECTIVES
- The factors of education that affects wage-earning
- Find out how these factors affect the wage-earning
1.2. DETAIL OBJECTIVES
- Determine what these factors are
- Analyze whether they are good or bad factors.
- Suggest some solutions to improve the situation if necessary and how to
use the result of the research effectively.
2. RESEARCH TARGET
- Range research: Based on data of education on wages in the United States that
collected by many sources
- Time research: 1980
- Research subjects: 935 Employees
3. RESEARCH METHODS
- Find information on the internet
- Use econometric models and analyze data in Gretel and Excel.
4. SAMPLE SIZE AND SAMPLE-CHOOSING METHOD
-
Sample size: 935 observations
Sample-choosing method: Collect data from researches that were carried out by many
sources.
3
A. Introduction
1. About the topic
This paper examines the effect of education and experience on the wages
of workers in America, especially the differences in urban and rural labor
markets. This paper proposes that both education and experience significantly
impacts wages. The study estimates are based on the Mincerian wage equation
with a large cross-section data of American individuals. The results suggest that
education and experience are positively correlated with the wages of labor in
both urban and rural labor markets. This relationship is significant and evident
across all the estimation.
In the past, we witnessed an increased interest in the level of wage
and level of education for workers across the world. According to David Autor,
during the 1950’s and 1970’s in the U.S., a rising level of educational attainment
kept up with rising demand for skilled labor. However, in the late 1970’s and
1980’s, the rising level of educational attainment has not kept up with the rising
demand for skilled labor, resulting in a sharp rise in the inequality of wages.
Within the last few years, it is clear that the gap in wage between
more highly skilled and less-skilled workers in America has been increasing.
Thailand, as an developed country, has been in a period of highly rapid growth,
mostly in urban areas. As there has been a dramatic difference between the
rural area and the urban areas, the wage distribution is not uniform across
regions of the country; poverty is more concentrated in the rural areas.
Therefore, wage inequality was also not uniform across the country; the wider
income differentials between households in different locations accounted for
the increase in overall inequality. Regional differences in wages also reflect
different degree of urbanization and participation in international trade. When
a modern industrial sector is introduced into an agricultural economy during
the rapid economic growth of America, the wage gap between these two sectors
will rise. However, when the modern sector absorbs labor from rural areas,
the wage gap will narrow again (Ikemoto and Uehara 2000). This means
that educational attainment also plays an important role for labor to make a
transition from the old sector to the new sector.
4
2. Literature review
Here, this paper is talking about the effect of education and work
experience on wages, which has been an important topic to our society. By
looking at and studying the literatures and data, the goal of this paper is to
learn and understand more profoundly about the effects of education and work
experience in particular on the difference between the rural and urban areas of
America. By studying this, we can have a better understanding of the relationships and be
able to implement and support the investment in education
and policy in the right direction. However, looking at previous studies, the
relationship between education and work experience in terms of wage is not
yet fully explored and well established, as there is no previous study that
makes this direct correlation to US.
Many economic theorists such as Mincer (1984) explain that economic
growth and wage are contributed from the role of human capital in the form
of education. In 1974, Mincer agreed with Becker (1964) that the upward
sloping wage profile occurs as human capital, or skills, increase with education
and experience. Therefore, as a worker acquires more training, the individual’s
productivity and earning should increase. Mincer (1991) found that since labor
market skills are acquired by learning at school and by learning on the job,
changes in demand for skill should affect both wage differentials by education
as well as those by labor market experience, according to human capital theory.
He also stated that the slope of the cross-sectional profile is steeper in one
period than another because more training takes place, or because the acquired
learning has become more profitable. He suggested, with limited evidence,
that there might be a substitution between (college) school education and
work experience or training of high school graduates. Using wage regression,
Constantine and Neumark (1996) showed that shifts in the incidence of various
types of training over the 1980s favored more-educated, more-experienced
workers. Giving that training is associated with higher wages, and that training
is more prevalent among more-educated, more-experienced workers, changes
in the distribution of and returns to both education and the effects strengthened
by the interaction between education and job training may have contributed to
the growth of wage inequality in this period.
Pereira and Martins (2004) used the Mincer wage equation to find the
returns to education in Portugal. They support that using the Mincer equation
in its simpler form seems to give an approximate value for the total return
to education. Newell and Socha (2007) also found the relationship between
experience and education toward wage determination in Poland, using Ordinary
least squares of Mincerian hourly earnings equations. They illustrated that
there were sharp increases in the returns to professional and managerial work,
as well as an increase in the wage penalty imposed on primary-educated
workers, after controlling for other characteristics. Lynch (1992) showed that
5
the private sector training plays a significant role in the determination of wages.
As a consequence, the experience-wage differentials should move relatively
in the same direction as the effect of education. Evidently, Brown (1983)
showed that wages grew slowly before the training period, rapidly during the
training period, and leveled off after it. An additional year of training raised
wage growth in the firm by 4-5% over the year, in both cross sections and over time.
However, Alexander (1974) seems to disagree with this idea, as he
found that the relationship between income and experience does not vary across
structure within income classes. Oosterbeek and Webink (2007) evaluated
the effect of an extension of three years basic vocational programs with one
year of general education on later wage of graduate. However, they fail to find
any significant effect of this extension. They suggest that individuals attending
basic vocational programs do not benefit from additional general education
(in term of later wages). Fengliang, Xiaohao, and Morgan (2009) show that in
China, class rank and status of job matching have no significant effect on the
starting wages of graduates in most educational specializations. The labor
market for graduates with higher education in China is characterized by the
signaling effect, although some graduates also benefit from the human capital
accumulated in higher education.
Many literatures also focus on wage gap by examining the relationship
between wage, work experience, and education. For example, Katz noted
huge growth during the 1980’s in the wage gap between those with college
education and those without, between those with non-manual jobs and those
with manual jobs, between those with experience and those without. In United
Kingdom, the wage gap expanded dramatically in 1980’s, however with a
different cause. In Japan, the wage gap occurred more moderately, on account
of strength of the Japanese manufacturing sector. In France, the causes are from
a high and pervasive minimum wage, and also the union contract extensions
prevented wages of unskilled workers from falling significantly. However, the
overall reason is the increase in demand for well-educated workers. Hotchkiss
and Shiferaw (2010) agree with Katz by demonstrating that changes in
endowments of workers with college degrees were largely responsible for the
increasing wage gap in the 1980’s and 1990’s. Michelaci and Pijoan-Mas
(2007) provide a model in which they specify the channel whereby wage
inequality affects the return to working longer hours. A rise in the dispersion
of job offers, which translates into higher within-skill wage inequality, raises
the gains from obtaining better jobs and gives workers greater incentives to
work longer hours; the effect is stronger as the labor market becomes tighter.
Wheeler (2005) suggests that the vast majority of the rise in U.S. wage
inequality over the past two decades is the product of increasing gaps between
workers within the same industry rather than between workers across different
industries. His finding suggests that the variance of wages among workers with
the same level of education has also grown. However, Mishel and Bernstein
6
(2003) believed that the returns to education and experience, frequently account
for less than half of the growth of wage inequality.
Pereira and Martins (2000) used the standard OLS from quantile
regression of the Mincer wage equation from fifteen European countries
across a fifteen-year period (1980-1995), which points out that education is a
risky and unpredictable investment. They believed that the marginal reward
some individuals reap from their schooling is very low or even negative.
Bedard (2001) stated that as constraints decline or higher education becomes
more accessible, wage would more closely reflect productivity. However,
increased university access is often touted as part of the prescription to improve
the lives of the“less” fortunate, and his results suggest that increased university
access might result in lower earning power for the less able. By looking on the
supply side, Psacharopoulos (1977) suggests that a policy of more equal access
to education might have the desired impact of making income distribution more equal.
3. Theoretical background
Effects of education on wage-earning
Education is the wealth of knowledge acquired by an individual after studying particular
subject matters or experiencing life lessons that provide an understanding of something.
Wage-earning is the total of money you can get after working or doing any tasks. The
amount of money you would gain depends on how successfully you finish the job, which
requires lots of knowledge and experience about that tasks linking closely to your
educational background.
Hence, education and wage-earning have intimate correlation and education is one of the
main effects on how much money you can earn through the jobs.
7
B. Content
I. Describe the variables
Function we have in this report will include these following variables:
Dependent variable:
lwage (natural log of wage – monthly earning)
Independent variables:
educ: years of education
exper: years of work experience
married: =1 if married
black: =1 if black
south: =1 if live in south
urban: =1 if live in SMSA
II. Describe the data
1. Data overview
This set of data is a secondary one, as they are collected from a given source.
Data source: Wooldridge Source: M. Blackburn and D. Neumark (1992),
<e2><80><9c>Unobserved Ability, Efficiency Wages, and Interindustry Wage
Differentials,<e2><80><9d> Quarterly Journal of Economics 107, 1421-1436.
The structure of Economic data: cross-sectional data.
8
2. Data collection
Exhibit 1: Statistic indicators of variables in the Housing Price model
Summary Statistics, using the observations 1 - 935
Variable
Mean
Median
S.D.
Min
lwage
6.78
6.81
0.421
4.74
educ
13.5
12.0
2.20
9.00
exper
11.6
11.0
4.37
1.00
hours
43.9
40.0
7.22
20.0
married
0.893
1.00
0.309
0.00
south
0.341
0.00
0.474
0.00
urban
0.718
1.00
0.450
0.00
where:
S.D is the standard deviation of the variable
Min is minimum value of the variable
Max is maximum value of the variable
9
Max
8.03
18.0
23.0
80.0
1.00
1.00
1.00
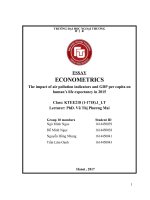
III. Describe the correlation between variables
Exhibit 2: Correlation matrix
Correlation Coefficients, using the observations 1 - 935
5% critical value (two-tailed) = 0.0641 for n = 935
lwage
1.0000
0.3121
0.0206
-0.0472
0.1500
-0.1948
0.2038
lwage
educ
exper
hours
married
south
urban
educ
exper
hours
married
south
Urban
1.0000
-0.4556
0.0910
-0.0586
0.0970
0.0722
1.0000
-0.0621
0.1063
0.0213
-0.0474
1.0000
0.0326
-0.0295
0.0166
1.0000
0.0228
-0.0402
1.0000
-0.1099
1.0000
From the matrix, it can be inferred that the correlation between lwage and each of the
independent variable is decent enough to run the regression model. Specifically:
-
lwage and educ has a moderate uphill relationship.
-
lwage and exper have a weak uphill relationship.
-
lwage and hours have a weak downhill relationship.
-
lwage and married have a weak uphill relationship.
-
lwage and south have a weak downhill relationship.
-
lwage and urban have aweak uphill relationship.
10
IV. Econometrics model
To demonstrate the relationship between wage and other factors, the regression function
can be constructed as follows:
(SRF): lwage = 0 + 1 educ + 2 exper + 3 hours + 4 married + 5 south + 6 urban + i
Where:
0 is the intercept of the regression model
i is the slope coefficient of the independent variable xi
is the disturbance of the regression model
From this model, this report is interested in explaining lwage in terms of each of the six
independent variables (educ, exper, hours, married, south, urban).
V. Estimation of econometric model
Having checked the required condition of correlation among variables, the regression
model is ready to run. The result is shown in Exhibit 4
Exhibit 3: Regression model
Model 1: OLS, using observations 1-935
Dependent variable: lwage
const
educ
exper
hours
married
south
Coefficient
5.51207
0.0741690
0.0178577
−0.0048739
4
0.226223
−0.131459
Std. Error
0.133331
0.00630296
0.00315432
0.00170139
t-ratio
41.34
11.77
5.661
−2.865
p-value
<0.0001
<0.0001
<0.0001
0.0043
***
***
***
***
0.0398213
0.0260501
5.681
−5.046
<0.0001
<0.0001
***
***
11
urban
0.165016
Mean dependent var
Sum squared resid
R-squared
F(6, 928)
Log-likelihood
Schwarz criterion
0.0273793
6.779004
129.5041
0.218236
43.17653
−402.5377
852.9592
6.027
S.D. dependent var
S.E. of regression
Adjusted R-squared
P-value(F)
Akaike criterion
Hannan-Quinn
<0.0001
***
0.421144
0.373566
0.213182
1.28e-46
819.0753
831.9955
From the result, it can be inferred that:
educ, exper, hours, married, south, urban all have statistically significant effects
on lwage at the 5% significant level (as all p-values are smaller than 0.05). In
particular, those effects can be specified by the regression coefficients as follows:
-
0 = 5.51207: When all the independent variables are zero, the expected
value of wage is e5.51207 .
-
1 = 0.0741690: When the number of years of education increase by one,
the expected value of wage is increase by 7.4196%.
-
2 = 0.0178577: When the number of years of experience increase by one,
the expected value of wage is increase by 1,78577%.
-
3 = -0.00487394: When the number of average weekly hours increaseby
one, the expected value of wage is decrease by 0.487394%.
-
4 = 0.226223: When the employee is married, his/her wage is 2.26233%
higher.
-
5 = -0.131459: When the employee lives in the south, his/her wage is
1.31459% lower.
-
6 = 0.165016: When the employee lives in the urban, his/her wage is
1.65016% higher.
The coefficient of determination R squared 0.218236: all independent
variables (educ, exper, hours, married, south, urban) jointly explain 21.8236% of
12
the variation in the dependent variable (lwage); other factors that are not
mentioned explain the remaining 78.1764% of the variation in the lwage.
Based on the data collected from the table, the sample regression function is
established:
(SRF): lwage = 5.51207 + 0.0741690educ + 0.0178577 exper - 0.00487394 hours +
0.226223 married - 0.131459 south + 0.165016 urban +
VI. Hypothesis testing
1. Testing the overall significance.
Purpose: Test the null hypothesis stating that none of the explanatory variables
has an effect on the dependent variable.We have: α=0.05 Given that the hypothesis
is:
��: �� = �
��: ∃�� ≠ � (i = 1, 2,.. 6)
We have: P – Value(F) = 1.28e-46 < α = 0.05 => Reject H0 => All parameters are
not simultaneously equal to zero→ At least one variable has an effect on
dependent one.
=> The model is statistically fitted.
2. Testing model’s problem.
2.1. Testing Omit variable.
Given that the hypothesis is
��: ��� ����� ���� ��� ���� �������e
��: ��� ����� ����s �������e
13
RAMSEY’s RESET
Exhibit 4: Omit variable test
Auxiliary regression for RESET specification test
OLS, using observations 1-935
Dependent variable: lwage
coefficient std. error t-ratio p-value
------------------------------------------------------const
146.171
educ
3.23854
exper
0.779862
hours
−0.212893
married
423.768
9.64410
2.32189
0.3449 0.7302
0.3358 0.7371
0.3359 0.7370
0.633795 −0.3359 0.7370
9.88157
29.4143
0.3359 0.7370
south
−5.74210
17.0938
−0.3359 0.7370
urban
7.20819
21.4568
0.3359 0.7370
yhat^2
−6.41210
19.2233
yhat^3
0.320832
0.946783
−0.3336 0.7388
0.3389 0.7348
Test statistic: F = 0.134292,
with p-value = P(F(2,926) > 0.134292) = 0.874
14
We have p-value = P(F(2,926) > 0.134292) = 0.874 > α = 0,05=> We don’t have
enough evidence to reject H0 => The model does not omit variables.
2.2. Testing multicollinearity
Using the following command vif regression to examine multicollinearity. “VIF”
commands specific to the variance inflation factor, if a variable value vif > 10, the
model has the possibility of multicollinearity.
Using “VIF” command in Gretl, we have following result in Exhibit
Exhibit 5: Multicollinearity test
Variance Inflation Factors
Minimum possible value = 1.0
Values > 10.0 may indicate a collinearity problem
educ
1.283
exper
1.274
hours
1.011
married 1.015
south 1.022
urban 1.018
VIF(j) = 1/(1 - R(j)^2), where R(j) is the multiple correlation coefficient
15
between variable j and the other independent variables
Belsley-Kuh-Welsch collinearity diagnostics:
variance proportions
lambda
cond const
educ exper hours married south urban
5.880 1.000 0.000 0.001 0.003 0.001 0.003 0.008 0.006
0.641 3.029 0.000 0.000 0.001 0.000 0.001 0.912 0.026
0.249 4.860 0.001 0.001 0.034 0.002 0.030 0.059 0.868
0.117 7.076 0.001 0.025 0.607 0.009 0.055 0.000 0.037
0.084 8.352 0.005 0.030 0.002 0.030 0.880 0.001 0.053
0.022 16.326 0.004 0.328 0.046 0.730 0.000 0.000 0.002
0.006 30.720 0.989 0.615 0.309 0.228 0.030 0.020 0.008
lambda = eigenvalues of inverse covariance matrix (smallest is 0.00623083)
cond = condition index
note: variance proportions columns sum to 1.0
We see:
VIF (educ) = 1.283 < 10
VIF (exper) = 1.274 < 10
16
VIF (hours) = 1.011 < 10
VIF (married) = 1.015 < 10
VIF (south) = 1.022 < 10
VIF (urban) = 1.018 < 10
=> Multicollinearity is not too worrisome a problem for this set of data
2.3. Testing Heteroskedasticity.
Given that the hypothesis is:
��: ��� ����� ���� ��� ���� ������������������ ���blem
��: ��� ����� has ������������������
WHITE’S TEST
Exhibit 6 shows the result
Exhibit 6: Heteroskedasticity test
White's test for heteroskedasticity
OLS, using observations 1-935
Dependent variable: uhat^2
coefficient std. error
t-ratio p-value
--------------------------------------------------------const
−0.0877885
0.769505
−0.1141 0.9092
educ
0.0320147
0.0699414
0.4577 0.6473
17
exper
0.0146575
hours
−0.00794067
married −0.0426806
0.0279941
0.5236 0.6007
0.0143561
−0.5531 0.5803
0.278322
−0.1533 0.8782
south
−0.336264
0.194019
−1.733 0.0834 *
urban
0.345694
0.215808
1.602 0.1095
sq_educ
−0.000713493 0.00205823 −0.3467 0.7289
X2_X3
0.000303844 0.00129642
0.2344 0.8148
X2_X4
0.000182309 0.000605227
0.3012 0.7633
X2_X5
−0.0117139
X2_X6
0.00188109 0.00949100
X2_X7
−0.0179262
0.0134886
−0.8684 0.3854
0.1982 0.8429
0.00982812 −1.824 0.0685 *
sq_exper −0.000115076 0.000427208 −0.2694 0.7877
X3_X4
−0.000277079 0.000309777 −0.8944 0.3713
X3_X5
−0.00251847 0.00815887
−0.3087 0.7576
X3_X6
0.00756464 0.00459377
1.647 0.1000 *
X3_X7
−0.00882870 0.00482169 −1.831 0.0674 *
sq_hours
6.48590e-05 8.53655e-05 0.7598 0.4476
X4_X5
0.00455469 0.00392745
1.160 0.2465
X4_X6
0.00474647 0.00242633
1.956 0.0507 *
X4_X7
−0.000399422 0.00267717
−0.1492 0.8814
X5_X6
0.0468276
0.0599674
0.7809 0.4351
X5_X7
0.00828918 0.0635983
0.1303 0.8963
18
X6_X7
0.0252714
0.0386367
0.6541 0.5132
Unadjusted R-squared = 0.038769
Test statistic: TR^2 = 36.248964,
with p-value = P(Chi-square(24) > 36.248964) = 0.051908
We see p-value = P(Chi-square(24) > 36.248964) = 0.051908 > α = 0.05 => We
don’t have enough evidence to reject H0 => The model does not have
heteroskedasticity problem.
C. Summary
1. Conclusion
In debating whether or not a person’s years of schooling would have an effect on their
yearly income, we found the results to clearly dictate the significance that education has
on income. We can see how only one extra year of education can potentially increase a
person’s income by over 7.4196% showing the importance of earning a good education.
However, it is not as clear cut as it may seem, and as one would expect a person's
education and hours worked per week also play a role in income earnings. These help
confirm many common and well known assumptions that are seen in today’s society.
Another common assumption that is a major talking point in many circles is the
accusation of female wage earnings being lower than men’s. With the inclusion of our
dummy variables we can see that in both the cases of married and unmarried employees
19
in the urban area, they tend to have a higher income. Although, even with all others
factors (such as urban, south,..) a person’s education still seems to have the most
significant effect on income.
This relationship does lead to one major issue, the problem of opportunity cost. Even
though one could earn 7.4196% more of their current wage by going to school for another
year, that is potentially one year without wages, or working only part time. There then
arises the cost of schooling where people will spend well 7.4196% exceed their wage to
go to school for one more year. This dilemma can cause many issues both on the personal
level, and the federal level when debating what the best choice to make is, choose one
more year of work, or one more year of school.
D. References
Jamison, E. A., Jamison, D. T., & Hanushek, E. A. (2006). The Ef fects of Education
Quality on Income Growth and Mortality Decline. Retrieved from
http.//www.nber.org/papers/w12652. Yang, J., Qiu, M. (2015).
The impact of education on income inequality and intergenerational mobility. China
Economic Review, 37, 110-125 Nuno, A. (2012).
The impact of education on household income and expenditure inequality. Applied
Economics Letters, 19(10), 915-919. doi: 10. 1080/13504851.2011.607125 Turčínková,
J., Stávková, J. (2012).
Does the Attained Level of Education Affect the Income Situation of Households?
Procedia-Social and Behavioral Sciences, 55, 1036-1042
20
21