Mối quan hệ giữa đặc điểm hội đồng quản trị và thông tin bất cân xứng của các công ty niêm yết trên sở giao dịch chứng khoán TP HCM tt tiếng anh
Bạn đang xem bản rút gọn của tài liệu. Xem và tải ngay bản đầy đủ của tài liệu tại đây (868.63 KB, 44 trang )
MINISTRY OF EDUCATION AND TRAINING
STATE BANK OF VIETNAM
BANKING UNIVERSITY HO CHI MINH CITY
PHAN BUI GIA THUY
RELATIONSHIP BETWEEN BOARD'S CHARACTERISTICS AND
ASYMMETRIC INFORMATION OF LISTED FIRMS ON
HO CHI MINH STOCK EXCHANGE
SUMMARY OF PHD DISSERTATION
Major: Finance and Banking
CODE: 9 34 02 01
Academic advisor:
DR. NGO VI TRONG
DR. NGUYEN TRAN PHUC
HO CHI MINH CITY, 2020
CONTENTS
CHAPTER 1
INTRODUCTION.................................................................................................................. 1
1.1 Research problem ............................................................................................................ 1
1.2 Research objectives ......................................................................................................... 3
1.3 Research questions .......................................................................................................... 4
1.4 Object and scope of this study ........................................................................................ 4
1.5 Research methodology .................................................................................................... 4
1.6 The significance of study................................................................................................. 5
1.7 The structure of study ..................................................................................................... 5
CHAPTER 2
LITERATURE REVIEW ..................................................................................................... 6
2.1 Asymmetric information................................................................................................. 6
2.2 Asymmetric information in the stock market .............................................................. 6
2.2.1 Definition ................................................................................................................. 6
2.2.2 Basis for measurement ............................................................................................. 6
2.2.3 Measurement method ............................................................................................... 6
2.3 Review of studies ............................................................................................................. 7
2.3.1 Research on asymmetric information measurement models ................................... 7
2.3.2 Research on relationship between board's characteristics and asymmetric
information ........................................................................................................................ 8
2.3.3 Discussion of research gap ..................................................................................... 11
CHAPTER 3
RESEARCH METHODOLOGY ....................................................................................... 13
3.1 Asymmetric information measurement models ......................................................... 13
3.1.1 Glosten and Harris (1988) model ........................................................................... 13
3.1.2 George, Kaul and Nimalendran (1991) trade-indicator model .............................. 13
3.1.3 George, Kaul and Nimalendran (1991) serial covariance model ........................... 14
3.1.4 Kim and Ogden (1996) model ............................................................................... 14
3.2 Adoption of asymmetric information measurement model ...................................... 16
3.3 Research framework ..................................................................................................... 16
3.4 Research hypothesis ...................................................................................................... 17
3.5 Research method ........................................................................................................... 18
3.5.1 Data collection ....................................................................................................... 18
3.5.2 Definition and measure of variables ...................................................................... 19
3.5.3 Regression analysis ................................................................................................ 19
CHAPTER 4
EMPIRICAL RESULTS AND DISCUSSION ................................................................. 22
4.1 Measuring asymmetric information ............................................................................ 22
4.1.1 Degree of asymmetric information ........................................................................ 22
4.1.2 Degree of asymmetric information for individual stock ........................................ 25
4.2 Board's characteristics and asymmetric information ............................................... 29
CHAPTER 5
CONCLUSIONS AND POLICY IMPLICATIONS ........................................................ 35
5.1 Highlights of study ........................................................................................................ 35
5.1.1 Asymmetric information measurement ................................................................. 35
5.1.2 Board's characteristics and asymmetric information ............................................. 35
5.2 Policy implications ........................................................................................................ 36
5.2.1 Policymakers .......................................................................................................... 36
5.2.2 Listed firms ............................................................................................................ 36
5.2.3 Investors ................................................................................................................. 36
5.3 Limitations and further research ................................................................................ 36
5.3.1 Limitations ............................................................................................................. 36
5.3.2 Further research ..................................................................................................... 37
5.4 Conclusion...................................................................................................................... 38
LIST OF AUTHOR'S PUBLICATIONS .......................................................................... 39
1
CHAPTER 1
INTRODUCTION
1.1 Research problem
1.1.1 Academic context
Asymmetric information and measuring it on the stock market is the field that attracts a lot
of attention from researchers because of the importance and topicality of this research field.
Firstly, the measure of asymmetric information provides the basis for assessing the
information environment of the stock market in a specific nation (Affleck-Graves et al.,
1994; Chakravarty et al., 2005; Huang, 2004; Lai et al., 2014).
Secondly, the measure of asymmetric information is useful in assessing the effectiveness
of policies issued by market regulators (Berkman and Lee, 2002; Chiyachantana et al.,
2004; Frijns et al., 2008).
Thirdly, this depends on the method of choice used, which is strongly influenced by the
characteristics of the trading market or the context of a specific country (Van Ness et al.,
2001; De Winne and Majois, 2003).
Finally, the measure of asymmetric information has still updated and added to this day.
For example, Johnson and So (2018) have introduced a new approach, and this approach is
thought to be superior to the traditional one.
On the other hand, asymmetric information is the main cause of the agency problem
(Jensen and Meckling, 1976) and the solution to this problem requires a corporate
governance mechanism under international practice, namely that board. An effective board
can reduce the agency cost, increase shareholder value, disclose information transparency,
and limit risk of information (Kanagaretnam et al., 2007; Chen et al., 2007; Rutherford and
Buchholtz, 2007). According to Zahra and Pearce (1989), Nicholson and Kiel (2004), Hilb
(2012), one of the important factors contributing to the effective function of a board is the
board's characteristics.
Many studies focused on the relationship between the characteristics of board and
asymmetric information in many different aspects; such as board size, non-executive
directors, diversity of women, educational qualification of board, duality, and ownership.
However, the results of the impact of the board's characteristics on asymmetric information
2
are still controversial and inconsistent due to differences in a specific country, research
period, and research method.
In addition to the inconsistent research results, the studies that mention the diversity of
the board, including women on board and the educational qualifications of directors that are
likely to impact asymmetric information is still limited.
Besides, not many studies have examined the effects of independent performance and the
knowledge level of board members on asymmetric information under a different type of
firm. Specifically, the number of studies that compare the effectiveness of independent
directors and the educational qualifications of board members in restricting asymmetric
information in state-owned firms compared with those in non-state-owned firms is limited.
Moreover, many researchers are less interested in the nonlinear relationship between
directorial ownership and asymmetric information.
1.1.2 Practical context
The world has witnessed many scandals involving information asymmetry. Typically, the
fraudulent actions of Enron's company (US) in 2001 through financial reporting fraud led to
the company filing bankruptcy, pushing more than seven thousand employees into
unemployment. Shareholders who invested in Enron's share investment deal suffered losses
of $74 billion, resulting in a total loss. Recently, the accounting scandal at Toshiba
Company (Japan) in 2015 caused a series of losses. First, the scandal caused trust among
investors and customers, overshadowing a brand with 140 years of corporate history.
Secondly, Toshiba's share value declined by 17% despite the Nikkei 225 index increasing
by 7.6% and a series of senior leaders in the Board of Directors resigning (Hass et al.,
2018).
Vietnam, a country whose stock market is ranked by international organizations as a
frontier market (SSC, 2018; HOSE, 2019), therefore the losses in the stock market due to
rumors, frauds of financial statements, and non-transparency in disclosing information are
very serious.
Although the authorities are always eager to improve the publicity, transparency of
information and compliance with corporate governance of listed firms by issuing Decree
71/2017/ND-CP replaces Circular 121/2012/TT-BTC providing guidance on corporate
governance applicable to public companies, and increase the effectiveness of inspection,
supervision, and enforcement through the issuance of Decree 145/2016/ ND-CP amending
3
and supplementing a number of articles of Decree 108/2013/ND-CP stipulates the
sanctioning of administrative violations in the field of securities, but mistakes in the field of
securities Stock always complicated developments. According to UBCKNN (2016, 2017,
and 2018), the cases of administrative sanctions have increased steadily in recent years. For
example, in 2016, there were 133 administrative violations. In 2017, the number increased
by 162% or 217 cases, and in 2018 the number of violations was 397 cases, up 14%.
From the facts, we can identify the common points of the securities scandals: (i) before
the stock market price hit the floor or plunged into panic, there were sharp increases in
prices, and (ii) the stock market price dropped significantly in the long run before the
authorities issued a warning or had more effective control measures. As long as there are
some limitations in regulatory oversight, delays in warnings and sanctions, and ineffective
implementation of the Board's role and functions, Vietnam's information environment is still
poor transparency, hiding the severe degree of asymmetric information among investors.
Therefore, it is imperative that a preliminary assessment and then a proposal for
mechanisms to minimize the information risk of listed firms on Vietnam's stock market be
urgent.
Based on the disagreements about the results of the research, the research gaps, the
urgency and current events from the practice, and the quantitative limitations of the relevant
studies, measuring asymmetric information and estimating the relationship between the
board's characteristics and asymmetric information of listed firms on the Ho Chi Minh
Stock Exchange (HOSE) need to be researched and implemented.
1.2 Research objectives
The overall objective of the thesis is to focus on studying the impact of the board's
characteristics on asymmetric information of listed firms in Vietnam, based on which the
thesis recommends several policies to limit asymmetric information. The thesis aims to
achieve specific objectives as follows:
- Measuring the level of asymmetric information of listed firms on HOSE.
- Identifying the suitable asymmetric information measurement model in the context of
Vietnam.
- Identifying and measuring the factors related to the board's characteristics likely to
impact on asymmetric information.
- Recommending many policies to decline the degree of asymmetric information.
4
1.3 Research questions
In order to achieve the current research objective, the study seeks to investigate the
following questions:
- How is the trend of the level of asymmetric information of listed firms on HOSE over
the years?
- Which is an appropriate econometric model applied to measure asymmetric
information in the context of Vietnam?
- Are there the factors related to the board's characteristics likely to impact on
asymmetric information?
- Does the impact of non-executive independent directors and the education level of
board members on asymmetric information depend on the type of firm with stateowned firms?
- Is there a nonlinear relationship between the shareholding ratio of board members and
asymmetric information?
1.4 Object and scope of this study
The thesis mainly focuses on the factors related to the board's characteristics likely to affect
asymmetric information of listed firms on HOSE from 2009 to 2015.
1.5 Research methodology
The study uses quantitative methods to achieve the research objectives. Research methods
are as follows:
To answer the first research question, the thesis applies econometric models to measure
asymmetric information. The measurement result of asymmetric information during the
research period will indicate the change in the level of asymmetric information of listed
firms on HOSE over the years.
To answer the second research question, the study checks the similarity of models,
estimates the correlation between variables including the levels of asymmetric information
using different models and the determinants, such as growth opportunity, liquidity trading,
and debt ratio, and tests the change in the level of asymmetric information before and after
the period of adjusting price limit range.
To answer the third research question, the thesis uses the econometric method to perform
the regression equation of determinants of the board's characteristics affecting asymmetric
information.
5
To answer the fourth research question, the study performs the testing of the interaction
effects between the type of firm and independent directors and the education level of board
members.
To answer the final research question, the thesis uses the threshold regression model and
the piecewise linear regression.
The research results will be the basis for the implication of a number of policies to limit
the degree of asymmetric information of listed firms in Vietnam.
1.6 The significance of study
Several main contributions of this thesis are as follows:
Firstly, the study proposes an appropriate asymmetric information estimation model that
can be used to measure asymmetric information in the context of Vietnam.
Secondly, the study provides evidence that expanding the price limit range from 5% to
7% is likely to increase the level of asymmetric information.
Finally, the study also adds some outstanding empirical pieces of evidence on the
relationship between the board's characteristics and asymmetric information. Specifically,
the effects of independent directors and the educational qualifications of board members on
asymmetric information depend on the moderating of the type of firm. Besides, there is a
threshold value of 1.74% of the shareholding ratio of the board members at which this ratio
tends to impact on asymmetric information in different forms.
1.7 The structure of study
The structure of the study is organized in five chapters. Accordingly, the chapters have the
following layout:
Chapter 1: Introduction
Chapter 2: Literature review
Chapter 3: Research methodology
Chapter 4: Empirical results and discussion
Chapter 5: Conclusions and policy implications
6
CHAPTER 2
LITERATURE REVIEW
2.1 Asymmetric information
In general, asymmetric information exists when the amount of information regarding a
potential transaction varies from one group of investors to another (Watts and Zimmerman,
1986).
2.2 Asymmetric information in the stock market
2.2.1 Definition
Asymmetric information of listed firms on the stock market reflects an object or group of
objects that own superior firm-specific information related to future public disclosures not
available to uninformed (Chae, 2005).
2.2.2 Basis for measurement
The basis for measuring asymmetric information is based on trading gains, expected
revenues and losses, and order flow signals.
2.2.3 Measurement method
2.2.3.1 Benchmark price method
Asymmetric information is measure by taking a difference between the transaction price and
the benchmark price of a traded stock (Venkatesh and Chiang, 1986; Lee, 1993; Huang and
Stoll, 1996). Benchmark price is the price at which buyers or sellers easily accept
transactions. At relative levels, the midpoint of the bid-ask spread can represent the
benchmark price. The larger the deviation between the transaction price and the midpoint
equals the higher asymmetric information.
The advantage of this method is convenient and quick estimating of information problem
for individual stock; therefore, Chung et al. (2010), Armstrong et al. (2014) prefer this
method. However, the disadvantage of this is that it does not measure the specific degree of
asymmetric information, takes a long time to estimate information risk of the overall
market, and exaggerates the level of asymmetric information.
2.2.3.2 Econometric method
The econometric method separates the adverse selection component from the bid-ask spread
to measure the level of asymmetric information. Some studies that apply this method to
7
measure asymmetric information include Glosten and Harris (1988) (GH model); Stoll
(1989) (Stoll model); George, Kaul and Nimalendran (1991) (GKN model); Lin, Sanger and
Booth (1995) (LSB model); Kim and Ogden (1996) (KO model); Madhavan, Richardson
and Roomans (1997) (MRR model). This method is more reliable, has fewer errors, and is
easier to estimate asymmetric information for the overall market and individual stock.
However, the significant downside is that these are arguable when using econometric
models together.
2.3 Review of studies
2.3.1 Research on asymmetric information measurement models
Table 2.2 below summarizes empirical studies applying models using econometric method
to measure asymmetric information.
Table 2.1. The studies using econometric method to measure asymmetric information
Ord_Num Studies
1
Affleck-Graves et al.
(1994)
Applied model
Market
Results
Stoll
NYSE and AMEX
(03/1985 - 04/1985)
NASDAQ/NMS
(03/1985 - 04/1985)
NYSE and AMEX
(03/1985 - 04/1985)
NASDAQ/NMS
(03/1985 - 04/1985)
17 closed funds in NYSE and
AMEX (1998)
17 controlled stocks in NYSE and
AMEX (1998)
17 closed funds in NYSE and
AMEX (1998)
17 controlled stocks in NYSE and
AMEX (1998)
London
(01/1995-12/1995)
London
(01/1995-12/1995)
London
(01/1995-12/1995)
NYSE
(04/1999 - 06/1999)
NYSE
(04/1999 - 06/1999)
NYSE
(04/1999 - 06/1999)
NYSE
(04/1999 - 06/1999)
Tokyo
(05/01/2000 - 31/3/2000)
50.0%
GKN serial covariance
2
Neal and Wheatley
(1998)
GH
GKN trade-indicator
3
Menyah and Paudyal
(2000)
Stoll
GKN serial covariance
KO
4
Van Ness et al. (2001)
GH
GKN trade-indicator
LSB
MRR
5
Ahn et al. (2002)
GH
36.0%
29.4%
9.7%
19.0%
33.7%
52.5%
64.8%
53.7%
20.9%
38.1%
38.9%
47.6%
45.4%
73.2%
29.4%37.4%
8
MRR
6
Van Ness et al. (2002)
Stoll
GKN serial covariance
7
Chakravarty et al. (2005)
GKN trade-indicator
LSB
8
Frijns và ctg (2008)
GH
MRR
9
Nguyen Trong Hoai and
Le An Khang (2008)
GH
10
Charoenwong et al. (2011)
LSB
11
Lamoureux and Wang
(2015)
GH
GKN trade-indicator
LSB
12
Nguyen Van Ngai et al.
(2016)
GH
LSB
KO
Tokyo
(05/01/2000 - 31/3/2000)
NYSE/AMEX
(02/1998 - 04/1998)
NASDAQ
(02/1998 - 04/1998)
NYSE/AMEX
(02/1998 - 04/1998)
NASDAQ
(02/1998 - 04/1998)
NYSE
(01/01/2001 - 26/01/2001)
NASDAQ
(01/01/2001 - 26/01/2001)
NYSE
(01/01/2001 - 26/01/2001)
NASDAQ
(01/01/2001 - 26/01/2001)
New Zealand
(06/2001 - 08/2004)
New Zealand
(12/2002 - 08/2004)
New Zealand
(06/2001 - 08/2004)
New Zealand
(12/2002 - 08/2004)
HOSE
(01/2007 - 12/2007)
Singapore
(04/10/2002 - 31/10/2003)
NYSE
(01/11/1990 - 31/01/1991)
NYSE
(01/11/1990 - 31/01/1991)
NYSE
(01/11/1990 - 31/01/1991)
HOSE
(01/12/2012 - 31/05/2013)
HOSE
(01/12/2012 - 31/05/2013)
HOSE
(01/12/2012 - 31/05/2013)
48.8%57.1%
53.0%
46.0%
28.0%
14.0%
45.5%
19.9%
42.9%
18.2%
28.2%
27.8%
58.0%
55.2%
89.7%
31.8%
23.2%
71.4%
38.9%
77.0%
70.3%
69.2%
Source: The studies are mentioned in the table
2.3.2 Research on relationship between board's characteristics and asymmetric
information
Jensen and Meckling (1976) point out, asymmetric information is the main cause of the
agency problem and the solution to this problem requires a corporate governance
mechanism under international practice, namely that board. According to Kanagaretnam et
9
al. (2007), Chen et al. (2007), Rutherford and Buchholtz (2007), an effective board can
reduce the agency cost, increase shareholder value, disclose information transparency, and
limit risk of information. One of the important factors contributing to the effective function
of a board is the board's characteristics (Zahra and Pearce, 1989; Nicholson and Kiel, 2004;
Hilb, 2012). The board's characteristics, often mentioned in corporate finance research and
corporate governance topics and likely to affect asymmetric information, include board size,
independent directors, female directors, education level of board members, duality, and
directorial ownership.
Board size
According to the resource dependence theory, a company with a large board size has many
advantages compared to a company with a small board size. Specifically, with many board
members, executives will receive more information and better advice and direction (Pfeffer
and Salancik, 1978; Dalton et al., 1999; Hillman et al., 2009). Moreover, several studies
have also shown that the company with many directors is capable of limiting asymmetric
information between outside shareholders and managers (Cai et al., 2006; Goh et al., 2016).
On the contrary, according to the agency theory, too many board members will create
many disadvantages for the company, such as consensus disadvantage in making decisions,
exchanging information, and free-rider problems. According to Lipton and Lorsch (1992),
Jensen (1993), and Beasley (1996), a firm with small board size will perform the corporate
governance functions more effectively and are responsible for higher shareholders.
Independent directors
Independent board members represent the interest of shareholders better and can supervise
managers more effectively than inside directors (Fama and Jensen, 1983; Weisbach, 1988).
Moreover, in the firms with many independent members, the level of information disclosure
to the public will be more publicized (Chen and Jaggi, 2000) and thus limit asymmetric
information between informed and uninformed investors (Barakat et al., 2014; Armstrong et
al., 2014; Elbadry et al., 2015).
Female directors
Several views do not support the presence of women in board, because female board
members have an ineffective influence on the transparency and quality of financial
information of businesses and activities of corporate governance. In particular, diversity of
women in board can lead to too many choices, which hinder and discriminate management
10
decisions (Alexander et al., 1995; Blau, 1977); increase conflict between management levels
(Richard et al., 2004); and reduce work coherence (Jackson et al., 2003).
However, agency theory and information economics, and many empirical studies have
acknowledged the presence of women on the board. Performances of female directors
significantly improve the effectiveness of the company's shareholder relations (Joy, 2008),
increase the level of information disclosure in both quality and quantity (Nalikka, 2009;
Gulzar and Wang, 2011; Qi and Tian, 2012), and restrict information risk between managers
and outside shareholders (Abad et al., 2017). In addition, the highlight of women is not
overconfidence (Lundeberg et al., 1994). They apply ethical standards to decision making
(Pan and Sparks, 2012), and take into consideration the level of risk more effectively than
men (Powell and Ansic, 1997; Byrnes et al., 1999).
Education level of board members
Although Haniffa and Cooke (2002), Cai et al. (2006) have not found a relationship between
the education level of the board members and asymmetric information, highly educated,
well-trained, and in-depth directors tend to disclose more information outside (Ahmed and
Nicholls, 1994), contributing to the timeliness and reliability of financial reporting
information (Yunos, 2012); and therefore, limiting the degree of asymmetric information
(Chemmanur et al., 2009).
Moreover, the education level of board members contributes to increasing the
effectiveness of the board's activities (Jalbert et al., 2002). Chemmanur et al. (2009), Lewis
et al. (2014) have shown that board members with a higher level of education are more
responsible for information disclosure. On the other hand, Elbadry et al. (2015) have shown
that directors with a deep understanding of finance have a positive relation to stock
liquidity.
Duality
Duality, the Chairman holding the position of Chief Executive Officer, may affect the
independence of board members. Therefore, separating duality will limit the concentration
of too much power on an individual and abuse of power and arbitrary decision-making,
which contributes to the effective monitoring of governance functions (Jensen and
Meckling, 1976). Besides, separating duality is likely to increase the effectiveness of
corporate governance, improve the quality of the level of information disclosure, and limit
asymmetric information (Forker, 1992; Gul and Leung, 2004).
11
According to the agency theory and good corporate governance practices, the board
structure should separate duality to maintain and increase the ability of independent
monitoring of the board, declining asymmetric information (Li et al., 2008).
Directorial ownership
There are two contradictory views on the relationship between shareholding of board
members and asymmetric information. According to the alignment view, managerial
ownership could limit to asymmetric information (Becker-Blease and Irani, 2008). On the
other hand, according to the entrenchment view, increasing the shareholding of board
members tends to raise the private information (Elbadry et al., 2015). Based on the agency
theory, aligning the interests between shareholders and board members through managerial
ownership will help the board to operate more effectively in solving agency problems
(Jensen and Meckling, 1976). Moreover, shareholding of board members, considered an
incentive mechanism, will align and guide members to pursue the common interests of
shareholders, and reduce the information costs of enterprises more effectively (BeckerBlease and Irani, 2008; Barakat et al., 2014).
Besides the linear relationship between managerial ownership and adverse selection
costs, there is a non-monotonic relationship (Han et al., 2014; Abad et al., 2018). The reason
is that the ownership rate is low, the rights or incentives are not significant enough
compared to the responsibilities that board members have to take, leading to the ineffective
supervision of board (Gedajlovic and Shapiro, 1998). Moreover, Han et al. (2014) showed
that the proportion of shareholding of board members in the range of 5% to 25% has a
significant relation to asymmetric information. However, at a different rate, the relationship
between the shareholding of board members and asymmetric information is not found.
2.3.3 Discussion of research gap
Reviewing the relevant studies, the dissertation finds some research gaps in the measure of
asymmetric information, and the relationship between the board's characteristics and
asymmetric information.
Firstly, the authors have not yet agreed on the method of measuring asymmetric
information, which is the use of a benchmark price method or econometric model.
Secondly, the results of the impact of the board's characteristics on asymmetric
information are still controversial and inconsistent due to differences in a specific country,
research period, and research method.
12
Thirdly, in addition to the inconsistent research results, the studies that mention the
diversity of the board, including women on board and the educational qualifications of
directors that are likely to impact asymmetric information is still limited. More specifically,
the number of studies that compare the effectiveness of independent directors and the
educational qualifications of board members in restricting asymmetric information in stateowned firms compared with those in non-state-owned firms is limited.
Finally, many researchers are less interested in the nonlinear relationship between
directorial ownership and asymmetric information.
13
CHAPTER 3
RESEARCH METHODOLOGY
3.1 Asymmetric information measurement models
Vietnam stock market is a developing market, so there are limitations when accessing data,
such as difficult to collect daily trading data with a period of continuous and large enough,
and stock prices are limited by the price limit range. Therefore, we apply Glosten and Harris
(1988) model (GH model), George, Kaul and Nimalendran (1991) trade-indicator model
(GKN trade-indicator model), George, Kaul and Nimalendran (1991) serial covariance
model (GKN serial covariance model), and Kim and Ogden (1996) model (KO model) to
measure degree of asymmetric information of listed firms on Vietnam stock market.
3.1.1 Glosten and Harris (1988) model
The below regression equation denotes the GH model:
∆Pt = c0∆Qt + c1∆(QtVt) + z0Qt + z1QtVt + εt
(1)
̅ , Z̅
We regress the equation (1) to obtain the c0, c1, z0 and z1 regression coefficient. Let C
̅ are the order processing and inventory holding component, the adverse selection
and V
component, and the number of shares traded respectively. The average adverse selection
component of the stocks according to GH model, ASCGH is estimated according to the
formula below:
ASCGH
2( z0 z1V )
2Z
2C 2Z 2(c0 c1V ) 2( z0 z1V )
(2)
Next, the equation (1) is regressed for each stock i to obtain individual regression
coefficients. Degree of asymmetric information, applied by GH model for the stock i, is
̅i )/[2(c0i + c1i V
̅i ) + 2(z0i + z1i V
̅i )].
estimated according to the formula: ASCi,GH = 2(z0i + z1i V
In the equation (1), ∆Pt is the change in the closing price at the end of the day; Qt is a
trading indicator variable determined by Lee and Ready (1991), Qt = +1 if the closing price
is higher than the midpoint; otherwise, Qt = –1; Vt is the number of shares traded at the end
of the day.
3.1.2 George, Kaul and Nimalendran (1991) trade-indicator model
The below regression equation denotes the GKN trade-indicator model:
2RDTM,it = a0 + a1 (Sqi)[Qit – Qit–1] + εit
(3)
14
Where: RDTM,it = ∆Pit – ∆Mit is the difference between the change in the closing price at
the end of the day (∆Pit) and the change in the mean of the bid price and ask price or change
in the midpoint (∆Mit); Sqi is the difference between ceiling price and floor price; Qit is a
trading indicator variable determined by Lee and Ready (1991), Qit = +1 if the closing price
is higher than the midpoint; otherwise, Qit = –1; a1 = π is the order processing cost
component. Therefore, the average adverse selection component of the stocks is calculated
as 1 – a1.
Let xit = (Sqi)[Qit – Qit–1] and yit = 2RDTM,it correspond to each stock i, the average adverse
selection component of the stock i, ASCi,GKN is estimated according to the formula below:
T
ASCi ,GKN1 1 a1,i 1
(x
t 1
it
x)( yit y )
T
(x
t 1
it
(4)
x)
2
3.1.3 George, Kaul and Nimalendran (1991) serial covariance model
The below regression equation denotes the GKN serial covariance model:
SGKN
= b0 + b1Sqi + εi
i
(5)
Where: SiGKN 2 Cov( RDTM ,it , RDTM ,it 1 ) is the spread in the GKN serial covariance
model; with RDTM,it = ∆Pit – ∆Mit is the difference between the change in a closing price at
the end of a trading day (∆Pit) and the change in the midpoint (∆Mit); Sqi is bid ask spread;
b1 is the proportion of the order processing component in spread; therefore, the average
adverse selection component of the stocks for the sample, ASCGKN2 is calculated as 1 – b1.
Next, Jones et al. (1994), Kim and Ogden (1996) proposed a convenient formula for
estimating asymptotic average adverse selection for each stock i in the GKN serial
covariance model; accordingly, ASCi ,GKN2 is estimated by the following formula:
ASCi ,GKN2 1
2 Cov( RDTM ,it , RDTM ,it 1 )
1 T
Sqit
T t 1
(6)
3.1.4 Kim and Ogden (1996) model
The below regression equation denotes the KO model:
̅ 2 + εi
SKO
= β0 + β1√𝑆𝑞𝑖
i
(7)
15
Where SiKO 2 Cov( RDTM ,it , RDTM ,it 1 ) is the spread in the KO model, with RDTM,it =
∆Pit – ∆Mit is the difference between the change in transaction price (∆Pit) and the change in
2
1 T
the midpoint (∆Mit); S̅ qi = Sqit2 is the mean of the sum of the squared spreads, β1 is the
T
t 1
regression coefficient as a proxy for the order processing cost component. Therefore, the
average adverse selection component of the stocks, ASCKO is calculated as 1 – β1.
Next, Kim and Ogden (1996) proposed a convenient formula for estimating asymptotic
average adverse selection for each stock in the KO model. Accordingly, ASCi,KO is estimated
by the following formula:
ASCi , KO 1
2 Cov( RDTM ,it , RDTM ,it 1 )
(8)
1 T 2
Sqit
T t 1
Table 3.1 below summarizes the used measurement model, regression equation, and ASC
estimation formulas for the sample and individual stock.
Table 3.1. The using asymmetric information measurement models
Measurement
models
1. Glosten and Harris
(1988) model
Regression
equation
ASC
for sample
ASC
for stock i
ΔPt = c0ΔQt + c1Δ(QtVt)
+ z0Qt + z1QtVt + εt
2( z0 z1V )
2(c0 c1V ) 2( z0 z1V )
2( z0i z1iVi )
2(c0i c1iVi ) 2( z0i z1iVi )
2RDt = a0 + a1 (Sq)[Qt – Qt–1]
+ εt
1 – a1
GH model
2. George, Kaul and
Nimalendran (1991)
trade-indicator model
T
1
GKN trade-indicator
model
3. George, Kaul and
Nimalendran (1991)
serial covariance model
KO model
it
t 1
𝑆𝑖∗ = b0 + b1Sqi + εi
1 – b1
1
̅ 2 + εi
𝑆𝑖∗∗ = β0 + β1√𝑆𝑞𝑖
1 – β1
1
x)( yit y )
T
(x
t 1
GKN serial
covariance model
4. Kim and Ogden (1996)
model
(x
it
(a)
x) 2
2 Cov( RDTM ,it , RDTM ,it 1 )
(b)
1 T
Sqit
T t 1
2 Cov( RDTM ,it , RDTM ,it 1 )
(c)
1 T 2
Sqit
T t 1
Note: (a) xit = (Sqi)[Qit – Qit–1], yit = 2RDTM,it ; (b) Jones et al. (1994), Kim and Ogden (1996) proposed; (c) Kim and Ogden
(1996) proposed.
Source: Glosten and Harris (1988); George, Kaul and Nimalendran (1991); Jones et al. (1994); Kim and Ogden (1996)
16
3.2 Adoption of asymmetric information measurement model
Firstly, the measurement model that satisfies conditions that there are few excluded
observations, and the deviation between asymmetric information for individual stock and
the sample is low is the basis for suggesting the appropriate model.
Secondly, the research examines the similarity between models by estimating the
correlation coefficients between the levels of asymmetric information applied the different
models for each stock according to Van Ness et al. (2001), De Winne and Majois (2003),
Lamoureux and Wang (2015). Then, the study estimates the correlation between variables,
including the levels of asymmetric information using different models and the determinants,
such as growth opportunity, liquidity trading, and debt ratio for the purpose of testing which
model will have an estimate of asymmetric information in accordance with economic theory
and related empirical studies. The study expects that asymmetric information will be
negatively correlated with liquidity trading (Acker et al., 2002; Draper and Paudyal, 2008)
and debt ratio (Ross, 1977; Jensen, 1986; Degryse and Jong, 2006), and positively
correlated with growth opportunity (Krishnaswami et al., 1999; Hegde and McDermott,
2004; Fosu et al., 2016).
Finally, the study tests the change in the level of asymmetric information before and after
the period of adjusting price limit range. In Vietnam, the price limit range was widen from
5% to 7% on January 15, 2013 according to Regulation 01/2013/QD-SGDHCM of HOSE;
therefore, according to Anshuman and Subrahmanyam (1999), Berkman and Lee (2002), the
study expects that asymmetric information will increase after the price limit range is
expanded.
3.3 Research framework
The quantitative studies of Cai et al. (2006), Armstrong et al. (2014), Goh et al. (2016),
Abad et al. (2017) illustrate that, the board's characteristics are likely to impact on
asymmetric information. In addition, the impact of non-executive directors and education
level of board members on asymmetric information could depend on type of firms with
state-owned firms, especially in the context of a developing market (Barberis et al., 1996;
Buck et al., 2008; Wang, 2012; Wang et al., 2016).
Based on the theoretical analysis framework and related empirical studies, the empirical
research framework on the relationship between the board's characteristics and asymmetric
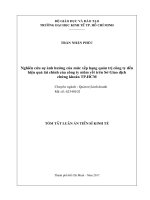
information is built as Figure 3.1 below.
17
- Number of board
members
Asymmetric
Information
- Market characteristics
- Firm characteristics
- Female directors
- Duality
- Type of firm (stateowned and non-state
firms)
- Shareholder of board
members
- Inderpendent and nonexecutive board members
- Educational qualification
of board members
: Dependent variable
: Explanatory variables
: Control variables
Source: Cai et al. (2006), Armstrong et al. (2014), Goh et al. (2016), Abad et al. (2017); Barberis et al. (1996); Buck et
al. (2008); Wang (2012); Wang et al. (2016)
Figure 3.1. Empirical research framework
Figure 3.1 denotes a impact of the board's characteristics, including number of board
members, female directors, educational qualification of directors, duality, personal
ownership of directors, and outside directors on asymmetric information. Besides, the
impact of outside directors and the educational qualification of board members on
asymmetric information is likely to depend on the type of firms, namely state-owned firms.
Control variables, including factors related to characteristics of market, such as liquidity
trading, stock price volatility, growth opportunity, period of adjusting price limit range, and
factors related to characteristics of firm, such as debt ratio, firm size, and effect of industry
sectors are also considered.
3.4 Research hypothesis
Based on quantitative research, related theories, empirical research framework and the
context of Vietnam stock market, the hypotheses on the relationship between the board's
characteristics and asymmetric information are constructed as follows:
H1: There is a positive relationship between the number of board members and
asymmetric information.
H2a: There is a negative relationship between non-executive directors and asymmetric
information.
18
H2b: There is a difference in the impact of the independent members on asymmetric
information between the state-owned and non-state-owned firms.
H3: There is a negative relationship between female directors and asymmetric
information.
H4a: There is a negative relationship between the educational qualification of board
members and asymmetric information.
H4b: There is a difference in the impact of the educational qualification of board
members on asymmetric information between the state-owned and non-state-owned
firms.
H5: There is a positive relationship between duality and asymmetric information.
H6a: There is a negative relationship between the shareholding ratio of board members
and asymmetric information.
H6b: There is non-linear relationship between the shareholding ratio of board members
and asymmetric information.
3.5 Research method
This study uses quantitative method to estimate the relationship between the board's
characteristics and asymmetric information of listed firms on Vietnam stock market. The
following is a description of how to conduct the study, including data collection, measure of
research variables, and method of data analysis.
3.5.1 Data collection
We collect data of listed firms on the Ho Chi Minh Stock Exchange (HOSE) from 2009 to
2015. The data of transaction price and order statistics of listed firms on HOSE is collected
at the time of Quarter 1, from January 1 to March 31 to measure asymmetric information
and market-related factors that include liquidity trading, stock price volatility, and growth
opportunity. Data related to board's characteristics, debt ratio, and size of firm is collected at
the time firms disclose at the end of the year. Finally, listed firms whose financial year does
not coincide at the end of the year will be excluded in the sample.
The research sample does not include listed firms with a fiscal year that do not coincide
at the end of the year; firms subject to special warning, control, compulsory cancellation of
listing or voluntary delisting; financial institutions such as banks, securities companies,
insurance companies, and investment funds; and firms that do not disclose information
19
related to research variables. Industry classification benchmark is based on the North
American Industry Classification System (U.S. Census Bureau, 2017).
3.5.2 Definition and measure of variables
Table 3.2 below summarizes the definition and measure of research variables.
Table 3.2. Definition and measure of variables
Variables
Definition
ASC
Adverse selection component
Using the suitable asymmetric information measurement
proxies asymmetric information model under the context of Vietnam stock market
BoardSize
Board members
Number of board members
Outd
Independent non-executive
directors
The proportion of independent non-executive board
members
Gender
Female directors
The proportion of women on the board
Edu
Educational qualification of
board members
The proportion of board members with postgraduate
education
Dual
Duality
Dual = 1, if Chairman also holds the positon of CEO;
otherwise Dual = 0
Own
Directorial ownership
The personal shareholding ratio of board members
Gov
Type of firm
Gov = 1, state-owned firm
Gov = 0, non-state-owned firm
Depth
Liquidity trading
The average of shares available at both the best bid and
ask prices divided by number of outstanding shares
Volatility
Volatile stock price
Standard deviation of the bid and ask midpoint
Opp
Level of growth opportunity
Opp = 1 if TobinQ > 1, high growth opportunity
Opp = 0 if TobinQ < 1, low growth opportunity
where: TobinQ = [market value of stock + total debt] /
total assets
Debt
Total debt ratio
Ratio of total of debt to total assets
Bank
Bank loan ratio
Ratio of bank loan to total assets
Bank_St
Short-term bank loan ratio
Ratio of short-term bank loan to total assets
Bank_Lt
Long-term bank loan ratio
Ratio of long-term bank loan to total assets
DumYear
The period of adjusting price
limit range from 5% to 7%
DumYear = 1; period 2013-2016 (price limit range is 7%)
DumYear = 0; period 2010-2012 (price limit range is 5%)
FirmSize
Size of firm
Natural logarithm of total assets
Industry
Effect of industry sectors
Dummy variables indicate the effect of industry sectors
3.5.3 Regression analysis
3.5.3.1 Regression equation
Measurement
20
Firstly, to estimate the relationship between the characteristics of board and asymmetric
information, we use the regression equation as follows:
ASCit 0 1 BoardSizeit 2 Outdit 3 Genderit 4 Eduit
J
5 Dualit 6 Ownit j ControlVarj ,it it
(3.9)
j 1
Next, to test whether the impacts of independent directors and the education level of
board members on asymmetric information depend on the type of firms, state-owned and
non-state-owned firms, applying the method of DeMaris (2004), we, in turn, add two
interaction variables Gov*Outd and Gov*Edu into equation (3.9) to get the regression
equation (3.10) and (3.11) below as follows:
ASCit 0 1 BoardSizeit 2 Outdit 3 Genderit 4 Eduit
J
5 Dualit 6 Ownit 7 Govit * Outdit j ControlVarj ,it it
(3.10)
j 1
ASCit 0 1 BoardSizeit 2 Outdit 3 Genderit 4 Eduit
J
5 Dualit 6 Ownit 8 Govit * Eduit j ControlVarj ,it it
(3.11)
j 1
The estimated results of the regression coefficient β7 of the Gov*Outd variable in
equation (3.10) and β8 of Gov*Edu variable in equation (3.11) could be the basis to reject or
accept the research hypothesis. Moreover, to clarify the difference in the impacts of Outd
and Edu on asymmetric information under type of firms, we divide the research sample into
two groups including state-owned and non-state-owned firms. The results of regression
estimation on two groups will illustrate the form and strength of the impact of these two
variables on asymmetric information for different types of firms.
Finally, to test the hypothesis there is a nonlinear relationship between the shareholding
of board members ratio and asymmetric information, we estimate the threshold regression
model according to Bai and Perron (2003). The threshold regression model has the
following form:
K
L
J
k 0
l 1
j 1
ASCi k Owni k (Owni , ) l X l ,i j ControlVarj ,i i
(3.12)
Where: τ is threshold value of Own; assuming k potential thresholds (τ) of Own, then
producing k+1 regimes; k (Owni , ) ( k Owni k 1 ) is an indicator function with a
21
value of 1 if the condition is satisfied, otherwise the value is 0; Xl (l = 1,5 ) are the
explanatory variables whose coefficients do not change across regimes, and represent the
board characteristics including: Outd, Edu, BoardSize, Gender, and Dual; ControlVarj are
control variables.
Regression coefficients α, β, δ and threshold values τ of Own from equation (3.12) are
estimated by minimizing the function S(α, β, δ, τ) which have the following equation form:
K
L
J
S ( , , , ) ASCi k Owni k (Owni , ) l X l ,i j ControlVarj ,i
i 1
k 0
l 1
j 1
n
2
After estimating the threshold values τ, we test the strength of this value by applying the
piecewise regression method according to Morck et al. (1988), Hermalin and Weisbach
(1991). With the assumption of finding two threshold values of Own (τ1 and τ2), the
piecewise linear regression has the following equation form:
ASCit 0 1 BoardSizeit 2 Outdit 3 Genderit 4 Eduit 5 Dualit
3
J
s 1
j 1
s Own _ Thrs ,it j ControlVarj ,it it
(3.13)
Where: Own_Thrs (s = 1,3 ) are threshold regimes of Own and are defined as follows:
Ownit
Own _ Thr1,it
1
Own _ Thr2,it
if Ownit 1
if Ownit 1
if Ownit < 1
0
Ownit 1 if 1 Ownit < 2
if Ownit 2
2 1
if Ownit 2
0
Own _ Thr3,it
Ownit 2 if Ownit 2
The results of estimating the regression coefficients λs of Own_Thrs could be the basis to
accept or reject the nonlinear relationship between the shareholding of board members ratio
and asymmetric information.
3.5.3.2 Regression method
For panel data, we use regression techniques, including Pooled-OLS regression model
(Pool), fixed effect model (FEM), and random effects model (REM). The adoption of these
models will be considered based on Hausman and Breusch-Pagan tests.