dealing with data grade 7 Bộ Sách Toán THCS Của Mỹ
Bạn đang xem bản rút gọn của tài liệu. Xem và tải ngay bản đầy đủ của tài liệu tại đây (6.05 MB, 66 trang )
Dealing
with Data
Data Analysis and
Probability
CuuDuongThanCong.com
/>
Mathematics in Context is a comprehensive curriculum for the middle grades.
It was developed in 1991 through 1997 in collaboration with the Wisconsin Center
for Education Research, School of Education, University of Wisconsin-Madison and
the Freudenthal Institute at the University of Utrecht, The Netherlands, with the
support of the National Science Foundation Grant No. 9054928.
The revision of the curriculum was carried out in 2003 through 2005, with the
support of the National Science Foundation Grant No. ESI 0137414.
National Science Foundation
Opinions expressed are those of the authors
and not necessarily those of the Foundation.
de Jong, J. A., Wijers, M., Bakker, A., Middleton, J. A., Simon, A. N., & Burrill, G.
(2006). Dealing with Data. In Wisconsin Center for Education Research &
Freudenthal Institute (Eds.), Mathematics in Context. Chicago: Encyclopædia
Britannica, Inc.
Copyright © 2006 Encyclopædia Britannica, Inc.
All rights reserved.
Printed in the United States of America.
This work is protected under current U.S. copyright laws, and the performance,
display, and other applicable uses of it are governed by those laws. Any uses not
in conformity with the U.S. copyright statute are prohibited without our express
written permission, including but not limited to duplication, adaptation, and
transmission by television or other devices or processes. For more information
regarding a license, write Encyclopædia Britannica, Inc., 331 North LaSalle Street,
Chicago, Illinois 60610.
ISBN 0-03-038566-0
1 2 3 4 5 6 073 09 08 07 06 05
CuuDuongThanCong.com
/>
The Mathematics in Context Development Team
Development 1991–1997
The initial version of Dealing with Data was developed by Jan Auke de Jong and Monica Wijers.
It was adapted for use in American schools by James A. Middleton, Aaron N. Simon, and Gail Burrill.
Wisconsin Center for Education
Freudenthal Institute Staff
Research Staff
Thomas A. Romberg
Joan Daniels Pedro
Jan de Lange
Director
Assistant to the Director
Director
Gail Burrill
Margaret R. Meyer
Els Feijs
Martin van Reeuwijk
Coordinator
Coordinator
Coordinator
Coordinator
Sherian Foster
James A, Middleton
Jasmina Milinkovic
Margaret A. Pligge
Mary C. Shafer
Julia A. Shew
Aaron N. Simon
Marvin Smith
Stephanie Z. Smith
Mary S. Spence
Mieke Abels
Nina Boswinkel
Frans van Galen
Koeno Gravemeijer
Marja van den
Heuvel-Panhuizen
Jan Auke de Jong
Vincent Jonker
Ronald Keijzer
Martin Kindt
Jansie Niehaus
Nanda Querelle
Anton Roodhardt
Leen Streefland
Adri Treffers
Monica Wijers
Astrid de Wild
Project Staff
Jonathan Brendefur
Laura Brinker
James Browne
Jack Burrill
Rose Byrd
Peter Christiansen
Barbara Clarke
Doug Clarke
Beth R. Cole
Fae Dremock
Mary Ann Fix
Revision 2003–2005
The revised version of Dealing with Data was developed by Arthur Bakker and Monica Wijers.
It was adapted for use in American schools by Gail Burrill.
Wisconsin Center for Education
Freudenthal Institute Staff
Research Staff
Thomas A. Romberg
David C. Webb
Jan de Lange
Truus Dekker
Director
Coordinator
Director
Coordinator
Gail Burrill
Margaret A. Pligge
Mieke Abels
Monica Wijers
Editorial Coordinator
Editorial Coordinator
Content Coordinator
Content Coordinator
Margaret R. Meyer
Anne Park
Bryna Rappaport
Kathleen A. Steele
Ana C. Stephens
Candace Ulmer
Jill Vettrus
Arthur Bakker
Peter Boon
Els Feijs
Dédé de Haan
Martin Kindt
Nathalie Kuijpers
Huub Nilwik
Sonia Palha
Nanda Querelle
Martin van Reeuwijk
Project Staff
Sarah Ailts
Beth R. Cole
Erin Hazlett
Teri Hedges
Karen Hoiberg
Carrie Johnson
Jean Krusi
Elaine McGrath
CuuDuongThanCong.com
/>
(c) 2006 Encyclopædia Britannica, Inc. Mathematics in Context and the
Mathematics in Context Logo are registered trademarks of Encyclopædia
Britannica, Inc.
Cover photo credits: (left) © Creatas; (middle, right) © Getty Images
Illustrations
1, 3, 5, 26, Holly Cooper-Olds; 34–38 © Encyclopædia Britannica, Inc.;
43 Holly Cooper-Olds
Photographs
4 © Corbis; 8 © Kim Steele/Getty Images/PhotoDisc; 9 © Getty Images/Digital
Vision; 12 (all) Library of Congress, Washington D.C.; 13 John Adams, Courtesy
of the National Collection of Fine Arts, Smithsonian Institution, Washington D.C.;
Thomas Jefferson, Courtesy of the White House Collection, Washington, D.C.;
James Monroe, Courtesy of the Independence National Historical Park Collection,
Philadelphia; Martin Van Buren, Courtesy of Chicago Historical Society;
Woodrow Wilson, © Encyclopædia Britannica, Inc.; (all others) Library of Congress,
Washington, D.C.; 14 Calvin Coolidge, Herbert C. Hoover © Encyclopædia
Britannica, Inc.; Franklin D. Roosevelt, UPI; Harry S. Truman, Courtesy of the
U.S. Signal Corps; Dwight D. Eisenhower, Fabian Bachrach; Lyndon B. Johnson,
Courtesy of the National Archives, Washington, D.C.; Gerald R. Ford, AP/Wide
World Photos; James E. Carter, The Carter Center/Billy Howard; Ronald Reagan,
Courtesy Ronald Reagan Library; George Bush, William J. Clinton, White House
photo/Library of Congress, Washington, D.C.; George W. Bush, Eric Draper/
White House photo; (all other presidents) Library of Congress, Washington, D.C.;
(bottom) PhotoDisc/Getty Images; 16 Courtesy of the U.S. Signal Corps;
17 Victoria Smith/HRW; 18 © Corbis; 21 Edward R. Tufte, The Visual Display of
Quantitative Information, 2nd Edition, Graphics Press LLC, 2001; 25 Bassano
and Vandyk, Elliott and Fry; 28 Victoria Smith/HRW; 29 © Larry Brownstein/
Getty Images/PhotoDisc; 30 © PhotoDisc/Getty Images; 31 © Brooks Kraft/
Corbis; 34 Photo by Richard D. Huseth />39 (top) © Comstock, Inc., © Corel, PhotoDisc/Getty Images; (bottom) © Corbis;
40 (top) © Corbis; (bottom) © Comstock, Inc.; 41 (top) © ImageState;
(bottom) © Corbis
CuuDuongThanCong.com
/>
Contents
Letter to the Student
Section A
Are People Getting Taller?
The Turn of the Century: The
Pearson and Lee Investigation
The Pearson and Lee Data
The Pearson and Lee Sample
Sampling
Summary
Check Your Work
Section B
vi
1
2
4
5
6
6
Scatter Plots
Graphs and Tables
Summary
Check Your Work
7
10
10
Presidents’ Ages
at Inauguration
13
12
Stem-and-Leaf Plots and
Histograms
Stem-and-Leaf Plots
Histograms
Your Teacher’s Head
Summary
Check Your Work
11
Number of Presidents
Section C
12
18
18
22
22
10
9
8
7
6
5
4
3
2
Section D
Hand Spans
Fathers and Sons Revisited
Water
Sun and Snow
Summary
Check Your Work
0
30 35 40 45 50 55 60 65 70 75 80
25
26
28
29
32
32
Age at Inauguration
Box Plots and the Median
Appendix
A
The Pearson and Lee Data
Appendices
Appendix A:
Heights of Fathers and Sons
Appendix B:
Fathers Sorted by Height
Appendix C:
Sons Sorted by Height
56
59
50
100
64.5–71.1
66.2–70.3
66.0–70.4
69.3–67.3
67.4–68.0
73.0–71.3
68.5–67.7
65.9–69.6
71.1–71.1
69.5–68.2
68.7–70.0
72.0–69.9
69.7–68.8
69.5–69.8
66.4–65.8
71.5–72.7
65.6–67.0
68.3–68.1
67.0–70.0
69.0–71.4
68.0–67.0
69.2–74.0
69.4–71.8
64.9–70.9
61.8–63.9
67.6–71.4
63.7–65.0
68.3–71.3
65.3–63.9
68.5–68.3
68.9–71.2
68.4–67.8
67.3–68.3
67.6–70.5
68.0–69.7
66.2–67.2
70.9–71.4
66.2–70.3
67.3–69.7
70.0–72.1
68.1–69.8
69.5–70.5
69.5–72.3
61.4–69.2
72.4–68.3
67.6–72.8
64.9–73.6
68.6–68.8
66.5–66.7
63.5–66.3
65.6–73.6
65.8–71.0
73.4–68.9
66.9–66.0
200
66.5–68.1
63.8–71.8
68.2–69.4
65.3–65.1
65.4–59.7
71.6–69.2
66.6–68.5
66.9–70.9
67.4–70.4
66.0–68.5
65.9–72.3
71.6–74.3
68.8–66.6
72.5–70.0
68.5–68.0
67.9–71.0
64.8–65.3
67.3–65.0
66.2–68.7
66.5–69.6
69.5–71.7
69.4–68.5
70.0–71.8
68.5–71.5
71.7–69.7
70.9–68.7
67.4–70.0
67.3–67.1
64.5–65.8
69.5–63.6
69.4–70.0
68.6–70.5
67.2–66.7
69.2–69.6
69.5–68.6
71.0–66.4
69.5–70.8
66.5–64.7
66.2–67.3
68.9–68.5
66.6–71.8
64.6–69.2
70.5–66.5
70.6–71.2
66.3–69.5
64.0–66.5
64.1–65.6
63.2–70.0
64.9–67.3
67.8–67.8
64.9–64.8
67.9–69.5
63.7–70.5
68.4–69.0
69.5–68.0
65.8–64.9
69.7–72.5
68.5–67.5
68.5–66.2
66.8–67.4
65.9–73.6
70.5–73.1
63.5–68.8
61.0–67.8
69.5–68.0
70.0–72.7
69.5–67.6
69.2–65.6
66.7–67.8
69.8–69.1
62.8–66.0
66.0–70.2
70.5–69.9
67.3–70.2
67.0–70.2
66.3–67.6
67.1–66.3
71.0–68.4
68.0–67.1
69.2–69.5
65.5–65.0
65.7–63.9
68.4–73.6
68.0–77.4
67.3–68.6
65.4–67.5
65.8–66.4
64.0–68.6
71.4–68.4
69.3–68.8
65.1–69.4
69.3–65.4
69.1–67.6
70.1–72.6
71.3–70.0
63.6–64.6
68.5–69.8
70.3–70.6
67.3–67.0
70.5–69.7
66.1–66.0
63.5–67.9
65.5–68.0
65.5–67.0
69.3–69.3
68.0–66.5
65.9–66.3
70.4–66.9
300
(in inches)
Sons
Sons
Fathers
250
Fathers
Sons
69.4–69.4
69.2–69.5
65.4–65.2
66.7–68.6
70.3–69.9
64.0–62.7
68.4–64.8
67.2–67.7
72.5–72.5
66.7–64.4
67.4–67.4
65.7–66.3
67.7–71.0
65.0–66.5
66.1–66.3
66.7–66.7
65.0–66.6
63.7–67.6
66.2–67.8
67.9–71.3
67.2–60.9
70.4–74.3
67.3–65.7
66.3–69.7
64.4–69.2
60.1–66.5
66.6–65.5
66.6–67.7
70.7–70.9
64.5–71.4
69.6–71.8
65.3–63.4
67.6–66.9
71.5–69.8
66.6–65.6
65.8–62.9
69.9–69.3
69.1–68.4
68.9–70.5
65.8–71.1
67.3–71.7
67.7–70.6
64.7–67.7
66.5–65.4
68.7–67.7
72.1–70.5
70.0–72.3
73.1–74.3
70.4–68.3
68.5–70.2
69.5–69.2
71.6–71.4
67.2–66.2
69.2–70.5
Sons
Fathers
150
Fathers
Sons
50
66.8–68.4
68.5–69.4
65.6–67.5
70.0–67.8
68.7–71.4
67.5–67.5
61.2–64.5
68.5–76.4
66.5–68.0
65.9–67.8
65.0–66.9
68.1–69.9
68.0–70.8
66.5–67.0
68.4–73.0
68.3–72.8
62.9–66.1
64.0–71.0
61.7–62.8
69.1–67.3
70.0–71.5
71.0–70.9
68.0–67.8
66.0–64.3
70.6–72.4
64.7–66.8
67.9–71.1
67.3–71.1
70.3–68.5
65.6–63.5
65.3–67.5
64.6–69.5
70.7–70.3
67.3–67.7
67.9–67.2
68.4–68.7
69.5–68.2
72.2–70.0
66.4–69.2
72.5–71.0
66.7–68.3
68.3–73.3
68.6–71.3
65.7–66.6
70.4–73.3
68.8–70.4
65.9–69.3
70.6–71.1
67.8–73.5
71.2–71.0
72.7–77.5
66.7–64.4
65.6–64.3
67.7–68.9
Sons
Answers to Check Your Work
Fathers
Heights of Fathers and Sons
66.5–73.4
68.9–70.9
69.8–67.2
68.0–71.1
69.9–70.4
69.5–69.3
70.3–74.2
63.4–67.9
59.6–64.9
68.5–72.7
65.4–65.3
66.5–65.5
70.7–70.0
67.2–73.4
65.7–68.4
66.7–68.8
69.0–69.0
65.8–67.7
69.3–73.3
76.6–72.3
65.6–67.1
68.8–72.3
65.5–67.3
67.5–68.0
67.1–68.0
69.2–70.3
72.2–67.8
65.7–64.9
64.8–65.4
64.5–66.7
68.2–67.0
62.5–67.1
69.5–66.9
67.1–68.8
75.1–71.4
66.4–67.3
63.4–68.4
65.2–66.8
66.9–66.8
64.7–70.5
65.0–65.5
67.9–66.5
65.8–68.5
62.7–64.5
71.6–72.8
71.5–73.6
71.5–70.0
69.6–70.8
70.6–66.9
69.5–67.8
61.8–66.6
65.7–67.9
71.9–72.0
74.5–74.2
350
68.3–69.1
67.4–68.0
65.0–69.2
70.3–66.9
66.9–63.8
63.5–67.2
70.8–68.8
65.6–70.3
67.8–73.9
61.1–66.8
70.0–71.3
64.5–64.6
67.5–67.7
70.6–69.2
72.0–73.5
70.5–70.9
64.6–63.9
70.3–71.8
67.0–72.0
64.1–64.9
65.8–63.4
70.0–70.8
63.9–64.9
65.0–67.5
65.3–65.3
69.5–68.5
66.5–67.0
68.4–67.6
66.9–68.3
65.0–66.7
68.3–67.9
65.5–71.0
67.2–70.0
70.1–68.6
68.0–66.6
66.9–68.0
67.7–68.9
65.6–65.0
66.6–65.9
66.4–66.4
71.3–72.5
68.1–65.6
68.5–69.5
63.5–66.9
67.6–70.6
65.9–70.4
68.5–68.0
69.1–75.2
72.9–71.0
71.6–71.2
69.0–69.1
72.0–72.2
63.7–68.5
71.1–68.0
400
Sons
46
Fathers
Additional Practice
Sons
34
39
42
44
45
Fathers
The United States
Land Animals
Back to Pearson and Lee
Summary
Check Your Work
Fathers
Section E
1
Histograms and the Mean
74.4–69.6
70.1–67.7
66.9–68.0
65.6–67.4
70.0–68.3
68.8–70.4
72.3–66.1
70.0–67.3
67.9–65.0
66.8–67.6
65.5–62.9
70.6–70.3
66.8–66.3
64.4–64.7
68.0–69.8
68.6–69.3
67.0–68.2
69.8–73.9
62.4–65.7
71.3–70.4
63.7–65.6
62.7–64.7
63.2–67.4
67.7–68.2
66.0–69.3
70.9–63.6
68.7–70.4
65.3–63.7
69.7–69.2
67.6–67.4
70.2–70.7
69.8–70.3
63.4–67.7
65.4–71.7
63.5–66.5
60.1–67.3
70.8–74.0
67.4–69.2
65.3–65.7
63.9–65.8
68.0–68.8
68.5–65.7
60.9–64.1
70.9–73.3
67.4–66.8
70.7–69.1
68.1–67.2
67.5–68.2
65.6–66.4
67.9–74.9
67.2–70.9
70.7–70.4
71.4–75.1
73.3–73.4
Appendices 53
60
Contents v
CuuDuongThanCong.com
/>
Dear Student,
How big is your hand? Do you think
it is bigger than, smaller than, or the
same size as most people’s hands?
How can you find out?
22 cm
24 cm
17 cm
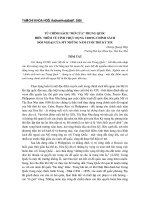
How fast does a cheetah run? Do you think it runs much faster than,
a little faster than, or at about the same speed as other animals?
How can you find out?
Do tall people have tall children?
How can you find out?
In the Mathematics in Context unit Dealing with Data, you will
examine questions like these and learn how to answer them. By
collecting and examining data, you can answer questions that are
interesting and often important.
While you are working through this unit, think of your own questions
that you can answer by collecting and examining data. One of the
best uses of mathematics is to help you answer questions you find
interesting.
Sincerely,
The Mathematics in Context Development Team
vi Dealing with Data
CuuDuongThanCong.com
/>
A
Are People Getting Taller?
The Turn of the Century:
The Pearson and Lee Investigation
“Have you ever slept in a really old bed and noticed it was a lot
smaller than your bed?”
Other people have noticed this too. Around 1900, statisticians Karl
Pearson and Alice Lee decided to collect data that would help them
determine whether or not children grow to be taller than their parents.
They asked people to measure the height of each member of their
family over the age of 18.
1. a. Why did everyone have to be over 18 years old for the survey?
b. Reflect Why do you think it might be important to see if
children grow taller than their parents?
Section A: Are People Getting Taller? 1
CuuDuongThanCong.com
/>
A Are People Getting Taller?
The Pearson and Lee Data
The heights, in inches, of 1,064 pairs of fathers and sons from the
Pearson and Lee data are listed in Appendix A at the end of this book.
These data were reconstructed from Pearson and Lee’s study.
Appendix
53
550
600
650
700
750
800
850
Fathers
69.8–65.1
63.5–64.5
70.3–68.1
68.6–72.1
66.7–71.1
66.8–64.8
68.2–65.8
68.5–69.8
67.3–65.4
73.5–71.3
66.1–68.9
69.1–73.6
67.5–67.1
68.2–67.0
64.1–66.7
65.6–62.5
69.2–63.8
70.0–68.3
70.9–70.2
69.7–69.5
72.0–71.9
70.5–74.5
68.8–67.7
69.4–70.2
67.1–69.3
66.3–66.1
70.4–66.9
64.3–66.9
68.4–68.0
67.7–71.4
68.5–69.0
67.5–71.8
65.0–69.0
66.8–62.3
68.0–71.4
70.7–70.7
68.1–73.1
65.1–70.0
70.7–72.4
65.8–69.4
66.8–66.7
69.6–69.3
69.8–70.0
66.5–65.3
69.4–67.7
67.0–66.0
73.0–69.5
71.1–73.2
64.5–67.2
72.8–75.5
70.2–72.4
68.5–73.3
66.0–71.3
72.5–70.7
Sons
Sons
Fathers
Sons
71.0–72.2
69.6–69.2
68.1–70.7
66.3–71.4
69.9–70.5
70.5–70.0
68.2–69.7
69.9–78.0
67.4–66.0
67.6–69.3
67.0–67.5
66.7–68.9
66.4–68.3
65.1–67.6
66.5–70.1
65.8–69.7
69.1–66.5
72.8–77.4
63.3–67.2
66.7–66.3
71.8–69.5
70.8–73.0
67.1–62.5
69.3–68.7
63.9–62.4
69.9–69.3
66.7–72.5
69.8–68.1
68.6–69.4
65.0–71.0
70.8–63.1
68.0–65.8
70.0–67.1
69.4–71.3
68.3–74.4
70.5–68.4
69.7–71.3
68.5–66.6
64.7–68.4
69.3–69.9
65.9–65.7
72.0–68.6
66.6–62.8
66.8–69.5
70.0–67.5
75.3–68.9
68.8–74.8
69.8–69.9
68.7–70.5
64.5–69.0
68.5–67.7
69.2–69.2
72.0–68.1
64.5–65.7
Fathers
67.4–66.6
69.4–74.0
70.5–66.7
71.8–72.2
70.4–66.4
69.5–67.3
64.5–67.0
66.3–66.0
68.6–68.1
70.2–67.0
63.9–63.9
66.0–67.4
69.6–68.6
70.3–68.7
72.9–68.0
59.5–64.6
62.3–64.6
68.5–65.6
70.8–71.6
73.4–71.8
67.0–65.5
68.1–68.3
63.9–67.5
69.6–70.3
66.8–67.0
72.3–68.0
66.7–68.6
69.6–69.3
69.0–66.7
68.1–68.5
66.5–70.7
64.8–69.4
68.3–68.5
71.2–70.1
66.8–68.7
68.4–65.3
67.7–66.7
67.9–64.9
71.2–65.6
65.7–69.2
63.4–66.3
68.9–67.9
70.9–71.8
67.1–68.1
72.7–68.2
70.1–70.8
66.0–67.0
67.0–67.9
70.4–69.3
61.2–67.4
70.3–69.7
68.9–70.5
71.0–69.0
66.8–71.7
54 Dealing with Data
Fathers
Sons
Sons
65.6–68.6
66.3–68.0
69.0–70.3
70.8–71.8
66.4–68.2
61.4–72.0
68.1–72.6
70.9–69.8
65.0–63.8
68.7–70.1
68.0–69.2
60.8–67.7
69.6–70.9
67.4–66.6
64.0–67.8
69.0–71.2
69.1–67.1
65.3–68.7
73.3–78.6
69.7–69.9
62.6–68.8
72.5–68.0
65.6–67.7
64.3–65.0
68.4–69.6
65.0–66.8
60.5–62.0
71.4–69.8
67.7–69.3
66.3–69.8
65.3–71.2
65.2–64.5
64.7–65.9
68.0–69.1
68.4–67.5
65.4–63.5
69.3–69.7
70.2–69.4
69.2–68.2
71.7–68.0
68.8–68.1
63.8–64.4
67.3–71.5
66.9–68.1
65.3–72.2
69.6–69.4
72.2–71.6
66.2–64.4
67.8–68.6
66.5–68.9
69.8–70.4
72.5–71.0
68.5–69.0
69.1–65.5
The Pearson
Sons
72.4–72.6
67.6–69.5
70.6–71.7
65.1–74.5
68.5–71.4
70.2–67.2
74.5–69.7
65.1–64.9
64.8–63.5
61.0–65.8
67.1–66.8
64.0–66.6
71.5–74.7
67.2–67.4
70.4–71.4
67.2–66.3
70.6–67.1
63.1–68.1
65.1–67.6
68.5–69.7
68.6–66.9
68.3–66.5
66.4–64.8
69.4–69.2
67.1–67.7
69.5–72.7
71.5–69.2
68.6–68.0
61.5–64.4
68.4–69.8
68.5–68.9
70.4–66.6
67.4–65.0
70.1–72.4
67.5–67.7
72.3–72.2
65.2–65.2
66.1–66.3
69.9–70.2
66.4–64.2
66.8–70.9
66.5–65.0
64.0–64.5
67.6–65.0
70.1–72.1
72.3–68.0
69.2–70.2
68.3–68.1
66.6–68.3
68.6–70.4
67.1–67.5
72.7–73.8
69.3–69.0
67.8–63.5
Fathers
Sons
Fathers
Sons
66.7–67.6
64.8–65.4
66.1–64.3
68.0–68.6
64.8–67.4
63.6–68.0
70.5–69.3
72.9–73.5
65.5–67.4
69.4–68.4
66.4–69.8
67.9–66.6
65.8–69.0
63.5–66.9
68.7–72.3
64.5–66.8
68.0–68.6
70.4–72.7
68.0–66.4
72.0–76.5
63.3–61.4
67.7–66.3
61.6–64.6
67.0–68.5
66.3–71.3
65.3–72.7
71.6–74.2
66.1–65.6
61.8–68.1
64.7–67.7
67.4–64.9
65.4–67.0
69.9–70.2
67.7–69.7
66.4–66.6
67.9–67.1
67.3–67.2
67.0–70.3
67.7–71.6
68.7–67.7
68.2–71.3
63.8–67.0
71.7–71.5
72.5–71.6
68.7–73.4
67.3–68.3
62.4–64.4
70.8–72.1
68.7–68.4
68.9–66.7
66.8–71.5
63.8–67.5
67.8–70.0
72.0–67.6
and Lee Data
Heights
of Fathers
and Son
s
Fathers
67.1–70.8
67.5–71.9
69.5–70.9
66.0–67.4
71.0–69.4
65.3–66.6
69.1–71.7
68.6–70.6
66.2–70.4
69.1–71.8
64.6–65.0
63.7–69.4
64.3–67.5
68.6–69.2
65.7–67.8
69.6–68.3
68.8–67.5
64.9–63.1
68.0–71.2
65.9–68.5
69.2–69.1
75.2–73.6
65.3–68.2
74.6–73.0
64.7–65.5
62.4–66.5
69.6–68.2
70.0–70.1
63.0–67.8
64.8–70.4
66.1–65.3
66.7–67.3
71.8–70.8
64.8–68.6
72.0–75.4
70.0–70.7
67.6–66.5
65.7–67.3
68.0–72.0
71.4–74.0
69.1–67.7
68.2–73.2
59.0–65.1
69.7–69.0
63.5–64.9
72.2–69.3
66.7–67.0
66.2–66.0
61.6–64.0
64.8–68.5
64.7–66.1
65.0–70.5
64.7–65.3
64.4–66.6
Fathers
Fathers
Sons
500
Sons
Fathers
450
69.8–70.6
69.6–70.2
69.0–70.4
66.4–64.4
69.0–71.7
65.6–63.4
63.0–64.2
63.0–69.0
73.5–71.1
68.0–68.3
72.0–72.0
65.5–65.8
68.0–70.9
69.6–69.4
66.9–68.9
70.9–70.0
64.7–69.0
75.3–70.5
67.5–65.8
73.0–75.7
66.0–69.2
62.6–67.9
68.7–68.3
71.4–67.7
72.7–73.4
67.2–67.5
69.4–69.3
67.7–69.6
69.0–69.5
64.2–69.5
64.5–64.3
66.7–67.0
66.1–69.9
65.1–66.0
69.3–68.5
67.7–67.1
62.6–59.9
63.3–62.5
68.7–72.4
63.8–68.8
65.8–69.3
70.5–67.6
67.8–68.8
65.5–64.7
64.5–67.3
63.5–66.4
69.3–71.3
70.8–72.9
69.7–70.8
72.0–71.5
66.6–69.0
68.3–70.6
70.0–76.6
71.0–74.0
A
(in inches)
Fathers
74.4–69.6
68.3–69.1
70.1–67.7
66.5–73.4
67.4–68.0
66.9–68.0
69.5–68.0
68.9–70.9
65.0–69.2
66.5–68.1
65.6–67.4
65.8–64.9
69.8–67.2
69.4–69.4
70.3–66.9
63.8–71.8
70.0–68.3
69.7–72.5
64.5–71.1
68.0–71.1
69.2–69.5
66.9–63.8
68.2–69.4
66.8–68.4
68.8–70.4
68.5–67.5
66.2–70.3
69.9–70.4
65.4–65.2
63.5–67.2
65.3–65.1
68.5–69.4
72.3–66.1
68.5–66.2
66.0–70.4
69.5–69.3
66.7–68.6
70.8–68.8
65.4–59.7
65.6–67.5
70.0–67.3
66.8–67.4
69.3–67.3
70.3–74.2
70.3–69.9
65.6–70.3
71.6–69.2
70.0–67.8
67.9–65.0
65.9–73.6
67.4–68.0
63.4–67.9
64.0–62.7
67.8–73.9
66.6–68.5
68.7–71.4
66.8–67.6
70.5–73.1
73.0–71.3
59.6–64.9
68.4–64.8
61.1–66.8
66.9–70.9
67.5–67.5
65.5–62.9
63.5–68.8
68.5–67.7
68.5–72.7
67.2–67.7
70.0–71.3
67.4–70.4
61.2–64.5
70.6–70.3
61.0–67.8
65.9–69.6
65.4–65.3
72.5–72.5
64.5–64.6
66.0–68.5
68.5–76.4
66.8–66.3
69.5–68.0
71.1–71.1
66.5–65.5
66.7–64.4
67.5–67.7
65.9–72.3
66.5–68.0
64.4–64.7
70.0–72.7
69.5–68.2
70.7–70.0
67.4–67.4
70.6–69.2
71.6–74.3
65.9–67.8
68.0–69.8
69.5–67.6
68.7–70.0
67.2–73.4
65.7–66.3
72.0–73.5
68.8–66.6
65.0–66.9
68.6–69.3
69.2–65.6
72.0–69.9
65.7–68.4
67.7–71.0
70.5–70.9
72.5–70.0
68.1–69.9
67.0–68.2
66.7–67.8
69.7–68.8
66.7–68.8
65.0–66.5
64.6–63.9
68.5–68.0
68.0–70.8
69.8–73.9
69.8–69.1
69.5–69.8
69.0–69.0
66.1–66.3
70.3–71.8
67.9–71.0
66.5–67.0
62.4–65.7
62.8–66.0
66.4–65.8
65.8–67.7
66.7–66.7
67.0–72.0
64.8–65.3
68.4–73.0
71.3–70.4
66.0–70.2
71.5–72.7
69.3–73.3
65.0–66.6
64.1–64.9
67.3–65.0
68.3–72.8
63.7–65.6
70.5–69.9
65.6–67.0
76.6–72.3
63.7–67.6
65.8–63.4
66.2–68.7
62.9–66.1
62.7–64.7
67.3–70.2
68.3–68.1
65.6–67.1
66.2–67.8
70.0–70.8 400 63.2–67.4
66.5–69.6
64.0–71.0
67.0–70.2
67.0–70.0
68.8–72.3
67.9–71.3
63.9–64.9
69.5–71.7
61.7–62.8
67.7–68.2
66.3–67.6
69.0–71.4
65.5–67.3
67.2–60.9
65.0–67.5
69.4–68.5
69.1–67.3
66.0–69.3
67.1–66.3
68.0–67.0
67.5–68.0
70.4–74.3
65.3–65.3
70.0–71.8
70.0–71.5
70.9–63.6
71.0–68.4
69.2–74.0
67.1–68.0
67.3–65.7
69.5–68.5
68.5–71.5
71.0–70.9
68.7–70.4
68.0–67.1
350
69.4–71.8
69.2–70.3
66.3–69.7
66.5–67.0
71.7–69.7
68.0–67.8
65.3–63.7
69.2–69.5
64.9–70.9
72.2–67.8
64.4–69.2
68.4–67.6
70.9–68.7
66.0–64.3
69.7–69.2
65.5–65.0
61.8–63.9
65.7–64.9
60.1–66.5
66.9–68.3
67.4–70.0
70.6–72.4
67.6–67.4
65.7–63.9
67.6–71.4
64.8–65.4
66.6–65.5
65.0–66.7
67.3–67.1
64.7–66.8
70.2–70.7
68.4–73.6
63.7–65.0
64.5–66.7
66.6–67.7
68.3–67.9
64.5–65.8
67.9–71.1
69.8–70.3
68.0–77.4 300 68.2–67.0
68.3–71.3
70.7–70.9
65.5–71.0
69.5–63.6
67.3–71.1
63.4–67.7
67.3–68.6
65.3–63.9
62.5–67.1
64.5–71.4
67.2–70.0
69.4–70.0
70.3–68.5
65.4–71.7
65.4–67.5
68.5–68.3
69.5–66.9
69.6–71.8
70.1–68.6
68.6–70.5
65.6–63.5
63.5–66.5
65.8–66.4
68.9–71.2
67.1–68.8
65.3–63.4
68.0–66.6
67.2–66.7
65.3–67.5
60.1–67.3
64.0–68.6
68.4–67.8
75.1–71.4
67.6–66.9
250
66.9–68.0
69.2–69.6
64.6–69.5
70.8–74.0
71.4–68.4
67.3–68.3
66.4–67.3
71.5–69.8
67.7–68.9
69.5–68.6
70.7–70.3
67.4–69.2
69.3–68.8
67.6–70.5
63.4–68.4
66.6–65.6
65.6–65.0
71.0–66.4
67.3–67.7
65.3–65.7
65.1–69.4
68.0–69.7
65.2–66.8
65.8–62.9
66.6–65.9
69.5–70.8
67.9–67.2
63.9–65.8
69.3–65.4
66.2–67.2
66.9–66.8
69.9–69.3
66.4–66.4
66.5–64.7
68.4–68.7
68.0–68.8
69.1–67.6
70.9–71.4
64.7–70.5
69.1–68.4 200 66.2–67.3
71.3–72.5
69.5–68.2
68.5–65.7
70.1–72.6
66.2–70.3
65.0–65.5
68.9–70.5
68.1–65.6
68.9–68.5
72.2–70.0
60.9–64.1
71.3–70.0
67.3–69.7
67.9–66.5
65.8–71.1
68.5–69.5
66.6–71.8
66.4–69.2
70.9–73.3
63.6–64.6
70.0–72.1
65.8–68.5
67.3–71.7
63.5–66.9
64.6–69.2
72.5–71.0
67.4–66.8
68.5–69.8
68.1–69.8
62.7–64.5
67.7–70.6
67.6–70.6
70.5–66.5
66.7–68.3
70.7–69.1
70.3–70.6
69.5–70.5 150 64.7–67.7
71.6–72.8
65.9–70.4
70.6–71.2
68.3–73.3
68.1–67.2
67.3–67.0
69.5–72.3
71.5–73.6
66.5–65.4
68.5–68.0
66.3–69.5
68.6–71.3
67.5–68.2
70.5–69.7
61.4–69.2
71.5–70.0
68.7–67.7
69.1–75.2
64.0–66.5
65.7–66.6
65.6–66.4
66.1–66.0
72.4–68.3
69.6–70.8
72.1–70.5
72.9–71.0
64.1–65.6
70.4–73.3
67.9–74.9
63.5–67.9
67.6–72.8
70.6–66.9
70.0–72.3
71.6–71.2
63.2–70.0
68.8–70.4 100 64.9–73.6
67.2–70.9
65.5–68.0
69.5–67.8
73.1–74.3
69.0–69.1
64.9–67.3
65.9–69.3
70.7–70.4
65.5–67.0
68.6–68.8
61.8–66.6
70.4–68.3
72.0–72.2
67.8–67.8
70.6–71.1
71.4–75.1
69.3–69.3
66.5–66.7
65.7–67.9
68.5–70.2
63.7–68.5
64.9–64.8
67.8–73.5
73.3–73.4
68.0–66.5
63.5–66.3
71.9–72.0
69.5–69.2
71.1–68.0
67.9–69.5
71.2–71.0
65.9–66.3
65.6–73.6
50
74.5–74.2
71.6–71.4
63.7–70.5
72.7–77.5
70.4–66.9
65.8–71.0
67.2–66.2
Appendices
68.4–69.0
66.7–64.4
73.4–68.9
69.2–70.5
65.6–64.3
66.9–66.0
67.7–68.9
Fathers
Sons
Fathers
Sons
Fathers
s)
(in inche
(in inche
s)
Sons
The Pearson and Lee Data
Heights of Fathers and Sons
Fathers
Sons
Fathers
Sons
Fathers
Sons
Fathers
Sons
Fathers
Sons
Fathers
A
and Lee Data
Sons
The Pearson
A
s
and Son
of Fathers
Heights
Sons
Appendix
Appendix
65.4–67.0
66.1–67.7
73.6–70.8
72.7–75.2
71.2–71.6
68.0–69.8
64.9–66.5
64.5–65.9
68.7–71.7
71.0–70.1
62.7–64.4
69.3–67.2
66.0–66.9
62.9–69.0
66.0–64.2
72.2–70.9
69.1–67.1
72.7–74.2
72.6–67.1
67.2–64.8
72.7–69.7
64.4–67.7
66.6–69.3
67.2–64.0
70.0–69.3
68.3–68.3
67.2–67.3
65.8–69.8
67.6–69.9
68.2–72.0
64.3–66.4
63.8–66.6
65.4–69.4
67.4–68.1
67.4–71.3
66.5–69.1
68.4–68.4
67.7–70.5
67.4–68.1
61.6–67.5
66.5–70.5
63.7–66.7
72.3–68.4
68.8–66.9
64.6–65.9
67.7–64.7
67.0–68.6
64.5–67.7
65.8–67.0
67.7–70.6
68.5–65.5
67.5–68.4
68.7–67.7
67.5–70.1
70.3–71.5
72.7–71.9
65.5–69.6
65.8–66.2
63.2–65.7
68.4–71.2
62.9–74.0
70.9–71.5
68.9–67.7
67.5–69.2
65.6–67.4
64.5–72.0
67.8–66.3
69.8–69.4
62.9–64.9
68.5–72.0
67.4–65.5
65.7–64.0
66.5–73.1
62.7–63.4
66.7–66.5
70.4–70.9
68.0–72.2
67.0–71.0
68.0–68.5
64.9–66.9
71.3–70.4
69.5–68.7
59.3–64.3
66.9–66.3
63.7–69.4
64.3–68.0
65.0–68.3
69.9–71.3
67.6–70.3
64.5–65.1
70.3–68.2
66.0–67.1
71.5–71.0
67.5–63.1
71.5–69.3
68.6–68.2
69.8–70.6
70.1–65.2
61.6–65.8 1,050 68.4–67.5
62.6–64.8
64.8–69.2
65.5–63.0
76.6–72.0
70.8–67.9
67.3–68.4
66.4–65.7
69.2–78.1
69.2–67.5
69.4–70.6
70.6–74.3
69.9–73.4 1,000 72.8–72.3
70.8–68.2
66.1–67.0
70.1–70.0
70.3–69.5
64.5–69.9
67.2–66.7
67.7–69.0
64.3–65.1
74.0–75.5
69.3–72.2
63.6–66.8
71.0–68.7 950 66.7–70.1
63.6–66.7
67.0–69.8
66.3–67.9
66.0–65.4
66.3–67.7
68.0–73.5
64.9–69.9
71.4–68.5
65.7–70.0
65.0–67.7
67.3–68.2
900 66.4–66.6
67.6–67.5
65.6–64.6
69.3–69.0
62.8–68.2
68.8–66.5
68.5–65.9
70.9–70.8
63.7–63.5
67.3–68.8
70.5–73.2
62.8–68.2
68.9–69.9
71.7–68.7
68.0–74.0
69.3–68.2
67.5–70.0
67.1–68.0
67.9–68.0
69.4–73.5
69.5–69.4
71.1–72.8
69.6–67.3
65.7–71.3
65.5–69.4
65.7–68.0
65.6–70.8
64.8–66.5
63.1–63.9
64.0–70.8
61.6–63.4
61.8–67.0
68.2–63.2
65.7–68.5
68.9–70.8
70.4–71.5
71.6–74.3
65.1–68.4
63.5–69.7
68.7–67.7
67.0–68.5
66.9–67.3
71.2–76.5
64.4–68.0
67.4–68.2
70.5–69.5
70.1–72.8
70.4–70.4
70.5–73.6
70.2–66.1
67.7–70.0
73.2–69.6
66.0–70.1
61.5–68.0
69.0–71.7
69.8–70.4
68.0–65.9
68.5–69.4
66.1–68.7
69.3–71.0
69.4–69.3
69.3–69.1
68.3–67.5
1,064 TOTA
L fathers
and sons
listed
Appendices
55
If you need to work with a long list of numbers, it helps to explore the
data first.
2. From the data set in Appendix A, find the following:
a. an example of a son who was at least 6 inches taller than
his father
b. an example of a father and son with the same height
c. an example of a son who was shorter than his father
d. an example of a son who was at least 6 inches shorter than
his father
3. a. Which one of the examples in problem 2 was easy to find?
Why?
b. Which was the most difficult?
By studying the data, Pearson and Lee concluded that sons grow to
be taller than their fathers.
4. Reflect Describe what you think Pearson and Lee did with the
data in order to reach their conclusion.
2 Dealing with Data
CuuDuongThanCong.com
/>
Are People Getting Taller? A
A
Four students studied the data from Appendix A. They all came to the
conclusion that the sons were generally taller than their fathers. Here
are their reasons (and everything they say is true).
Dustin says, “I know that the sons were
generally taller than their fathers, because
the tallest son in the data set was taller than
the tallest father.”
Son
Father
Anita says, “Overall, I say that the sons were
taller, because more than half of them were.”
Tiwanda says, “I can say that the sons were
generally taller than their fathers, because
the total height of all of the fathers is 72,033
inches. The total height of all of the sons is
73,126 inches.”
664
Huong says, “The sons were taller than their
fathers, in general, because in the data, sons
were taller than their fathers 664 times out of
1,064 times. There were 19 ties.”
5. a. Compare Dustin’s and Anita’s statements. Whose reasoning
do you think better supports the statement “The sons grew
to be taller than their fathers”? Why?
1,064
b. Now compare Anita’s and Tiwanda’s statements. Which is
more convincing?
c. Which of the four statements would you use as an argument?
Why?
Section A: Are People Getting Taller? 3
CuuDuongThanCong.com
/>
A Are People Getting Taller?
The Pearson and Lee Sample
Pearson and Lee were convinced that they had enough data.
We have data from over 1,000
families. I think that is enough.
Appendix
53
54 Dealing with Data
550
700
750
67.4–66.6
69.4–74.0
70.5–66.7
71.8–72.2
70.4–66.4
69.5–67.3
64.5–67.0
66.3–66.0
68.6–68.1
70.2–67.0
63.9–63.9
66.0–67.4
69.6–68.6
70.3–68.7
72.9–68.0
59.5–64.6
62.3–64.6
68.5–65.6
70.8–71.6
73.4–71.8
67.0–65.5
68.1–68.3
63.9–67.5
69.6–70.3
66.8–67.0
72.3–68.0
66.7–68.6
69.6–69.3
69.0–66.7
68.1–68.5
66.5–70.7
64.8–69.4
68.3–68.5
71.2–70.1
66.8–68.7
68.4–65.3
67.7–66.7
67.9–64.9
71.2–65.6
65.7–69.2
63.4–66.3
68.9–67.9
70.9–71.8
67.1–68.1
72.7–68.2
70.1–70.8
66.0–67.0
67.0–67.9
70.4–69.3
61.2–67.4
70.3–69.7
68.9–70.5
71.0–69.0
66.8–71.7
850
69.8–65.1
63.5–64.5
70.3–68.1
68.6–72.1
66.7–71.1
66.8–64.8
68.2–65.8
68.5–69.8
67.3–65.4
73.5–71.3
66.1–68.9
69.1–73.6
67.5–67.1
68.2–67.0
64.1–66.7
65.6–62.5
69.2–63.8
70.0–68.3
70.9–70.2
69.7–69.5
72.0–71.9
70.5–74.5
68.8–67.7
69.4–70.2
67.1–69.3
66.3–66.1
70.4–66.9
64.3–66.9
68.4–68.0
67.7–71.4
68.5–69.0
67.5–71.8
65.0–69.0
66.8–62.3
68.0–71.4
70.7–70.7
68.1–73.1
65.1–70.0
70.7–72.4
65.8–69.4
66.8–66.7
69.6–69.3
69.8–70.0
66.5–65.3
69.4–67.7
67.0–66.0
73.0–69.5
71.1–73.2
64.5–67.2
72.8–75.5
70.2–72.4
68.5–73.3
66.0–71.3
72.5–70.7
Fathers
Sons
Sons
Fathers
Sons
Fathers
800
71.0–72.2
69.6–69.2
68.1–70.7
66.3–71.4
69.9–70.5
70.5–70.0
68.2–69.7
69.9–78.0
67.4–66.0
67.6–69.3
67.0–67.5
66.7–68.9
66.4–68.3
65.1–67.6
66.5–70.1
65.8–69.7
69.1–66.5
72.8–77.4
63.3–67.2
66.7–66.3
71.8–69.5
70.8–73.0
67.1–62.5
69.3–68.7
63.9–62.4
69.9–69.3
66.7–72.5
69.8–68.1
68.6–69.4
65.0–71.0
70.8–63.1
68.0–65.8
70.0–67.1
69.4–71.3
68.3–74.4
70.5–68.4
69.7–71.3
68.5–66.6
64.7–68.4
69.3–69.9
65.9–65.7
72.0–68.6
66.6–62.8
66.8–69.5
70.0–67.5
75.3–68.9
68.8–74.8
69.8–69.9
68.7–70.5
64.5–69.0
68.5–67.7
69.2–69.2
72.0–68.1
64.5–65.7
A
The Pearson
and Lee Data
Heights
of Fathers
and Son
s
Fathers
65.6–68.6
66.3–68.0
69.0–70.3
70.8–71.8
66.4–68.2
61.4–72.0
68.1–72.6
70.9–69.8
65.0–63.8
68.7–70.1
68.0–69.2
60.8–67.7
69.6–70.9
67.4–66.6
64.0–67.8
69.0–71.2
69.1–67.1
65.3–68.7
73.3–78.6
69.7–69.9
62.6–68.8
72.5–68.0
65.6–67.7
64.3–65.0
68.4–69.6
65.0–66.8
60.5–62.0
71.4–69.8
67.7–69.3
66.3–69.8
65.3–71.2
65.2–64.5
64.7–65.9
68.0–69.1
68.4–67.5
65.4–63.5
69.3–69.7
70.2–69.4
69.2–68.2
71.7–68.0
68.8–68.1
63.8–64.4
67.3–71.5
66.9–68.1
65.3–72.2
69.6–69.4
72.2–71.6
66.2–64.4
67.8–68.6
66.5–68.9
69.8–70.4
72.5–71.0
68.5–69.0
69.1–65.5
Sons
Fathers
Sons
650
Sons
Fathers
Fathers
600
72.4–72.6
67.6–69.5
70.6–71.7
65.1–74.5
68.5–71.4
70.2–67.2
74.5–69.7
65.1–64.9
64.8–63.5
61.0–65.8
67.1–66.8
64.0–66.6
71.5–74.7
67.2–67.4
70.4–71.4
67.2–66.3
70.6–67.1
63.1–68.1
65.1–67.6
68.5–69.7
68.6–66.9
68.3–66.5
66.4–64.8
69.4–69.2
67.1–67.7
69.5–72.7
71.5–69.2
68.6–68.0
61.5–64.4
68.4–69.8
68.5–68.9
70.4–66.6
67.4–65.0
70.1–72.4
67.5–67.7
72.3–72.2
65.2–65.2
66.1–66.3
69.9–70.2
66.4–64.2
66.8–70.9
66.5–65.0
64.0–64.5
67.6–65.0
70.1–72.1
72.3–68.0
69.2–70.2
68.3–68.1
66.6–68.3
68.6–70.4
67.1–67.5
72.7–73.8
69.3–69.0
67.8–63.5
Sons
66.7–67.6
64.8–65.4
66.1–64.3
68.0–68.6
64.8–67.4
63.6–68.0
70.5–69.3
72.9–73.5
65.5–67.4
69.4–68.4
66.4–69.8
67.9–66.6
65.8–69.0
63.5–66.9
68.7–72.3
64.5–66.8
68.0–68.6
70.4–72.7
68.0–66.4
72.0–76.5
63.3–61.4
67.7–66.3
61.6–64.6
67.0–68.5
66.3–71.3
65.3–72.7
71.6–74.2
66.1–65.6
61.8–68.1
64.7–67.7
67.4–64.9
65.4–67.0
69.9–70.2
67.7–69.7
66.4–66.6
67.9–67.1
67.3–67.2
67.0–70.3
67.7–71.6
68.7–67.7
68.2–71.3
63.8–67.0
71.7–71.5
72.5–71.6
68.7–73.4
67.3–68.3
62.4–64.4
70.8–72.1
68.7–68.4
68.9–66.7
66.8–71.5
63.8–67.5
67.8–70.0
72.0–67.6
Fathers
67.1–70.8
67.5–71.9
69.5–70.9
66.0–67.4
71.0–69.4
65.3–66.6
69.1–71.7
68.6–70.6
66.2–70.4
69.1–71.8
64.6–65.0
63.7–69.4
64.3–67.5
68.6–69.2
65.7–67.8
69.6–68.3
68.8–67.5
64.9–63.1
68.0–71.2
65.9–68.5
69.2–69.1
75.2–73.6
65.3–68.2
74.6–73.0
64.7–65.5
62.4–66.5
69.6–68.2
70.0–70.1
63.0–67.8
64.8–70.4
66.1–65.3
66.7–67.3
71.8–70.8
64.8–68.6
72.0–75.4
70.0–70.7
67.6–66.5
65.7–67.3
68.0–72.0
71.4–74.0
69.1–67.7
68.2–73.2
59.0–65.1
69.7–69.0
63.5–64.9
72.2–69.3
66.7–67.0
66.2–66.0
61.6–64.0
64.8–68.5
64.7–66.1
65.0–70.5
64.7–65.3
64.4–66.6
Sons
Fathers
Sons
500
Sons
Fathers
450
69.8–70.6
69.6–70.2
69.0–70.4
66.4–64.4
69.0–71.7
65.6–63.4
63.0–64.2
63.0–69.0
73.5–71.1
68.0–68.3
72.0–72.0
65.5–65.8
68.0–70.9
69.6–69.4
66.9–68.9
70.9–70.0
64.7–69.0
75.3–70.5
67.5–65.8
73.0–75.7
66.0–69.2
62.6–67.9
68.7–68.3
71.4–67.7
72.7–73.4
67.2–67.5
69.4–69.3
67.7–69.6
69.0–69.5
64.2–69.5
64.5–64.3
66.7–67.0
66.1–69.9
65.1–66.0
69.3–68.5
67.7–67.1
62.6–59.9
63.3–62.5
68.7–72.4
63.8–68.8
65.8–69.3
70.5–67.6
67.8–68.8
65.5–64.7
64.5–67.3
63.5–66.4
69.3–71.3
70.8–72.9
69.7–70.8
72.0–71.5
66.6–69.0
68.3–70.6
70.0–76.6
71.0–74.0
(in inches)
Fathers
74.4–69.6
68.3–69.1
70.1–67.7
66.5–73.4
67.4–68.0
66.9–68.0
69.5–68.0
68.9–70.9
65.0–69.2
66.5–68.1
65.6–67.4
65.8–64.9
69.8–67.2
69.4–69.4
70.3–66.9
63.8–71.8
70.0–68.3
69.7–72.5
64.5–71.1
68.0–71.1
69.2–69.5
66.9–63.8
68.2–69.4
66.8–68.4
68.8–70.4
68.5–67.5
66.2–70.3
69.9–70.4
65.4–65.2
63.5–67.2
65.3–65.1
68.5–69.4
72.3–66.1
68.5–66.2
66.0–70.4
69.5–69.3
66.7–68.6
70.8–68.8
65.4–59.7
65.6–67.5
70.0–67.3
66.8–67.4
69.3–67.3
70.3–74.2
70.3–69.9
65.6–70.3
71.6–69.2
70.0–67.8
67.9–65.0
65.9–73.6
67.4–68.0
63.4–67.9
64.0–62.7
67.8–73.9
66.6–68.5
68.7–71.4
66.8–67.6
70.5–73.1
73.0–71.3
59.6–64.9
68.4–64.8
61.1–66.8
66.9–70.9
67.5–67.5
65.5–62.9
63.5–68.8
68.5–67.7
68.5–72.7
67.2–67.7
70.0–71.3
67.4–70.4
61.2–64.5
70.6–70.3
61.0–67.8
65.9–69.6
65.4–65.3
72.5–72.5
64.5–64.6
66.0–68.5
68.5–76.4
66.8–66.3
69.5–68.0
71.1–71.1
66.5–65.5
66.7–64.4
67.5–67.7
65.9–72.3
66.5–68.0
64.4–64.7
70.0–72.7
69.5–68.2
70.7–70.0
67.4–67.4
70.6–69.2
71.6–74.3
65.9–67.8
68.0–69.8
69.5–67.6
68.7–70.0
67.2–73.4
65.7–66.3
72.0–73.5
68.8–66.6
65.0–66.9
68.6–69.3
69.2–65.6
72.0–69.9
65.7–68.4
67.7–71.0
70.5–70.9
72.5–70.0
68.1–69.9
67.0–68.2
66.7–67.8
69.7–68.8
66.7–68.8
65.0–66.5
64.6–63.9
68.5–68.0
68.0–70.8
69.8–73.9
69.8–69.1
69.5–69.8
69.0–69.0
66.1–66.3
70.3–71.8
67.9–71.0
66.5–67.0
62.4–65.7
62.8–66.0
66.4–65.8
65.8–67.7
66.7–66.7
67.0–72.0
64.8–65.3
68.4–73.0
71.3–70.4
66.0–70.2
71.5–72.7
69.3–73.3
65.0–66.6
64.1–64.9
67.3–65.0
68.3–72.8
63.7–65.6
70.5–69.9
65.6–67.0
76.6–72.3
63.7–67.6
65.8–63.4
66.2–68.7
62.9–66.1
62.7–64.7
67.3–70.2
68.3–68.1
65.6–67.1
66.2–67.8
70.0–70.8 400 63.2–67.4
66.5–69.6
64.0–71.0
67.0–70.2
67.0–70.0
68.8–72.3
67.9–71.3
63.9–64.9
69.5–71.7
61.7–62.8
67.7–68.2
66.3–67.6
69.0–71.4
65.5–67.3
67.2–60.9
65.0–67.5
69.4–68.5
69.1–67.3
66.0–69.3
67.1–66.3
68.0–67.0
67.5–68.0
70.4–74.3
65.3–65.3
70.0–71.8
70.0–71.5
70.9–63.6
71.0–68.4
69.2–74.0
67.1–68.0
67.3–65.7
69.5–68.5
68.5–71.5
71.0–70.9
68.7–70.4
68.0–67.1
69.4–71.8
69.2–70.3 350 66.5–67.0
66.3–69.7
71.7–69.7
68.0–67.8
65.3–63.7
69.2–69.5
64.9–70.9
72.2–67.8
64.4–69.2
68.4–67.6
70.9–68.7
66.0–64.3
69.7–69.2
65.5–65.0
61.8–63.9
65.7–64.9
60.1–66.5
66.9–68.3
67.4–70.0
70.6–72.4
67.6–67.4
65.7–63.9
67.6–71.4
64.8–65.4
66.6–65.5
65.0–66.7
67.3–67.1
64.7–66.8
70.2–70.7
68.4–73.6
63.7–65.0
64.5–66.7
66.6–67.7
68.3–67.9
64.5–65.8
67.9–71.1
69.8–70.3
68.0–77.4 300 68.2–67.0
68.3–71.3
70.7–70.9
65.5–71.0
69.5–63.6
67.3–71.1
63.4–67.7
67.3–68.6
65.3–63.9
62.5–67.1
64.5–71.4
67.2–70.0
69.4–70.0
70.3–68.5
65.4–71.7
65.4–67.5
68.5–68.3
69.5–66.9
69.6–71.8
70.1–68.6
68.6–70.5
65.6–63.5
63.5–66.5
65.8–66.4
68.9–71.2
67.1–68.8
65.3–63.4
68.0–66.6
67.2–66.7
65.3–67.5
60.1–67.3
64.0–68.6
68.4–67.8
75.1–71.4
67.6–66.9
66.9–68.0
69.2–69.6 250 71.4–68.4
64.6–69.5
70.8–74.0
67.3–68.3
66.4–67.3
71.5–69.8
67.7–68.9
69.5–68.6
70.7–70.3
67.4–69.2
69.3–68.8
67.6–70.5
63.4–68.4
66.6–65.6
65.6–65.0
71.0–66.4
67.3–67.7
65.3–65.7
65.1–69.4
68.0–69.7
65.2–66.8
65.8–62.9
66.6–65.9
69.5–70.8
67.9–67.2
63.9–65.8
69.3–65.4
66.2–67.2
66.9–66.8
69.9–69.3
66.4–66.4
66.5–64.7
68.4–68.7
68.0–68.8
69.1–67.6
70.9–71.4
64.7–70.5
69.1–68.4 200 66.2–67.3
71.3–72.5
69.5–68.2
68.5–65.7
70.1–72.6
66.2–70.3
65.0–65.5
68.9–70.5
68.1–65.6
68.9–68.5
72.2–70.0
60.9–64.1
71.3–70.0
67.3–69.7
67.9–66.5
65.8–71.1
68.5–69.5
66.6–71.8
66.4–69.2
70.9–73.3
63.6–64.6
70.0–72.1
65.8–68.5
67.3–71.7
63.5–66.9
64.6–69.2
72.5–71.0
67.4–66.8
68.5–69.8
68.1–69.8
62.7–64.5
67.7–70.6
67.6–70.6
70.5–66.5
66.7–68.3
150
70.7–69.1
70.3–70.6
69.5–70.5
71.6–72.8
64.7–67.7
65.9–70.4
70.6–71.2
68.3–73.3
68.1–67.2
67.3–67.0
69.5–72.3
71.5–73.6
66.5–65.4
68.5–68.0
66.3–69.5
68.6–71.3
67.5–68.2
70.5–69.7
61.4–69.2
71.5–70.0
68.7–67.7
69.1–75.2
64.0–66.5
65.7–66.6
65.6–66.4
66.1–66.0
72.4–68.3
69.6–70.8
72.1–70.5
72.9–71.0
64.1–65.6
70.4–73.3
67.9–74.9
63.5–67.9
67.6–72.8
70.6–66.9
70.0–72.3
71.6–71.2
63.2–70.0
68.8–70.4 100 64.9–73.6
67.2–70.9
65.5–68.0
69.5–67.8
73.1–74.3
69.0–69.1
64.9–67.3
65.9–69.3
70.7–70.4
65.5–67.0
68.6–68.8
61.8–66.6
70.4–68.3
72.0–72.2
67.8–67.8
70.6–71.1
71.4–75.1
69.3–69.3
66.5–66.7
65.7–67.9
68.5–70.2
63.7–68.5
64.9–64.8
67.8–73.5
73.3–73.4
68.0–66.5
63.5–66.3
71.9–72.0
69.5–69.2
71.1–68.0
67.9–69.5
71.2–71.0
65.9–66.3
65.6–73.6
50
74.5–74.2
71.6–71.4
63.7–70.5
72.7–77.5
70.4–66.9
65.8–71.0
67.2–66.2
Appendices
68.4–69.0
66.7–64.4
73.4–68.9
69.2–70.5
65.6–64.3
66.9–66.0
67.7–68.9
Fathers
Sons
Fathers
Sons
Fathers
s)
(in inche
(in inche
s)
Sons
The Pearson and Lee Data
Heights of Fathers and Sons
Fathers
Sons
Fathers
Sons
Fathers
Sons
Fathers
Sons
Fathers
Sons
Fathers
A
and Lee Data
Sons
The Pearson
A
s
and Son
of Fathers
Heights
Sons
Appendix
Appendix
I agree!
65.4–67.0
66.1–67.7
73.6–70.8
72.7–75.2
71.2–71.6
68.0–69.8
64.9–66.5
64.5–65.9
68.7–71.7
71.0–70.1
62.7–64.4
69.3–67.2
66.0–66.9
62.9–69.0
66.0–64.2
72.2–70.9
69.1–67.1
72.7–74.2
72.6–67.1
67.2–64.8
72.7–69.7
64.4–67.7
66.6–69.3
67.2–64.0
70.0–69.3
68.3–68.3
67.2–67.3
65.8–69.8
67.6–69.9
68.2–72.0
64.3–66.4
63.8–66.6
65.4–69.4
67.4–68.1
67.4–71.3
66.5–69.1
68.4–68.4
67.7–70.5
67.4–68.1
61.6–67.5
66.5–70.5
63.7–66.7
72.3–68.4
68.8–66.9
64.6–65.9
67.7–64.7
67.0–68.6
64.5–67.7
65.8–67.0
67.7–70.6
68.5–65.5
67.5–68.4
68.7–67.7
67.5–70.1
70.3–71.5
72.7–71.9
65.5–69.6
65.8–66.2
63.2–65.7
68.4–71.2
62.9–74.0
70.9–71.5
68.9–67.7
67.5–69.2
65.6–67.4
64.5–72.0
67.8–66.3
69.8–69.4
62.9–64.9
68.5–72.0
67.4–65.5
65.7–64.0
66.5–73.1
62.7–63.4
66.7–66.5
70.4–70.9
68.0–72.2
67.0–71.0
68.0–68.5
64.9–66.9
71.3–70.4
69.5–68.7
59.3–64.3
66.9–66.3
63.7–69.4
64.3–68.0
65.0–68.3
69.9–71.3
67.6–70.3
64.5–65.1
70.3–68.2
66.0–67.1
71.5–71.0
67.5–63.1
71.5–69.3
68.6–68.2
69.8–70.6
70.1–65.2
61.6–65.8 1,050 68.4–67.5
62.6–64.8
64.8–69.2
65.5–63.0
76.6–72.0
70.8–67.9
67.3–68.4
66.4–65.7
69.2–78.1
69.2–67.5
69.4–70.6
70.6–74.3
69.9–73.4 1,000 72.8–72.3
70.8–68.2
66.1–67.0
70.1–70.0
70.3–69.5
64.5–69.9
67.2–66.7
67.7–69.0
64.3–65.1
74.0–75.5
69.3–72.2
63.6–66.8
71.0–68.7 950 66.7–70.1
63.6–66.7
67.0–69.8
66.3–67.9
66.0–65.4
66.3–67.7
68.0–73.5
64.9–69.9
71.4–68.5
65.7–70.0
65.0–67.7
67.3–68.2
900 66.4–66.6
67.6–67.5
65.6–64.6
69.3–69.0
62.8–68.2
68.8–66.5
68.5–65.9
70.9–70.8
63.7–63.5
67.3–68.8
70.5–73.2
62.8–68.2
68.9–69.9
71.7–68.7
68.0–74.0
69.3–68.2
67.5–70.0
67.1–68.0
67.9–68.0
69.4–73.5
69.5–69.4
71.1–72.8
69.6–67.3
65.7–71.3
65.5–69.4
65.7–68.0
65.6–70.8
64.8–66.5
63.1–63.9
64.0–70.8
61.6–63.4
61.8–67.0
68.2–63.2
65.7–68.5
68.9–70.8
70.4–71.5
71.6–74.3
65.1–68.4
63.5–69.7
68.7–67.7
67.0–68.5
66.9–67.3
71.2–76.5
64.4–68.0
67.4–68.2
70.5–69.5
70.1–72.8
70.4–70.4
70.5–73.6
70.2–66.1
67.7–70.0
73.2–69.6
66.0–70.1
61.5–68.0
69.0–71.7
69.8–70.4
68.0–65.9
68.5–69.4
66.1–68.7
69.3–71.0
69.4–69.3
69.3–69.1
68.3–67.5
1,064 TOTA
L fathers
and sons
listed
Appendices
55
6. How could this be when they knew that there were many
fathers and sons for whom they had no data?
The group of families that Pearson and Lee studied is called a
sample. A sample is a group taken from the whole population.
4 Dealing with Data
CuuDuongThanCong.com
/>
Are People Getting Taller? A
Sampling
To make valid conclusions about the whole population, the
person gathering the data must choose a sample in a proper
way. Conclusions from the sample about the characteristic they
are studying, such as height, eye color, or favorite food, must
also be true for the whole population. If the process of sampling
is not carefully done, then the results are unreliable.
Pearson and Lee collected their data in England in 1903 by asking
college students to measure the heights of their own family
members and of people in other families they knew.
7. Do you think the Pearson and Lee sample was chosen in a
proper way? Do you think the conclusions are valid for
everyone in England at that time?
You and your classmates can collect some current data to see how
heights in families might be related today.
Find the heights of some mother-daughter pairs. Remember that the
daughters should be at least 18 years old. Then gather all of the data
from your classmates.
Use your data on mother-daughter pairs for the following problems.
•
Make a list of the heights of the mother-daughter pairs collected by
your classmates. Organize your data like the list in Appendix A.
•
Make some statements about the data you collected.
Section A: Are People Getting Taller? 5
CuuDuongThanCong.com
/>
A Are People Getting Taller?
When people are investigating a question, they usually collect data.
If the group they want to study is very big, the investigators often
take a sample because they cannot ask everyone in the group.
It is important to be sure that the sample is chosen in a proper way;
otherwise, conclusions can be wrong.
A long list of data is better understood if it is organized. To understand
data, you need to think about the numbers carefully in some systematic
way.
1. Why is it important to choose a sample in a proper way?
2. Ann wants to know which sports students like. She decides to
ask students on Saturday in the swimming pool. Do you think
she chose the sample in a proper way?
3. Why is a long list of data hard to describe?
4. What might you do to organize a large data set?
Scientists have decided to investigate the heights of fathers and
sons today. Describe how you think they should choose their sample.
Write the differences and similarities you might expect to find
between this data and the data from Pearson and Lee. Be specific
in your explanations.
6 Dealing with Data
CuuDuongThanCong.com
/>
B
Scatter Plots
Graphs and Tables
Graphs and tables help you see patterns and trends in long lists of data.
Pearson and Lee wanted to make a graph that would help them
understand more about the relationship between the heights of
fathers and sons.
Shown here are the heights of five pairs of fathers and sons, taken
from the Pearson and Lee data.
Fathers’ Heights (in inches) Sons’ Heights (in inches)
A
66.8
68.4
B
68.5
69.4
C
65.6
67.5
D
70.0
67.8
E
67.5
67.5
You can plot the heights of each father-son pair with a point on the
grid on Student Activity Sheet 1.
vertical
axis
The heights of all of the fathers and sons range from 58 to 80 inches.
Sons’ Heights (in inches)
Pearson and Lee Data
80
79
78
77
76
75
74
73
72
71
70
69
68
67
66
65
64
63
62
61
60
59
58
The scale along the bottom of the graph is called
the horizontal axis. Another scale is marked off on
a line that goes up and down on the paper. This is
called the vertical axis.
The graph shows the location of point A, which
corresponds to the father-son pair A at (66.8, 68.4).
A
1. a. Put this point on the grid on Student
Activity Sheet 1. Explain how you plotted
this point.
b. Plot points B, C, D, and E on the grid on
Student Activity Sheet 1.
58 59 60 61 62 63 64 65 66 67 68 69 70 71 72 73 74 75 76 77 78 79 80
horizontal
axis
Fathers’ Heights (in inches)
c. What statement can you make about the
heights of fathers and sons from the points
you plotted?
Section B: Scatter Plots 7
CuuDuongThanCong.com
/>
B Scatter Plots
If you plot all 1,064 pairs of data that are in Appendix A,
on the grid on Student Activity Sheet 1, you would get
the diagram below. It is called a scatter plot. The points
are “scattered” across the diagram. By making a scatter
plot, you create a picture of your data.
Pearson and Lee Data
80
79
78
77
Sons’ Heights (in inches)
76
75
74
73
72
71
70
69
68
67
66
65
64
63
62
61
60
59
58
58 59 60 61 62 63 64 65 66 67 68 69 70 71 72 73 74 75 76 77 78 79 80
Fathers’ Heights (in inches)
2. The numbers along the axes of the scatter plot start with 58,
not 0. Why is this?
Use the copy of the scatter plot on Student Activity Sheet 2 for
problems 3–7.
3. a. Circle the point that represents the tallest father. How tall is
he? How tall is his son? Is he the tallest son?
b. Circle the point that represents the shortest father. How tall is
he? Is he taller than his son? How does the height of his son
compare to the heights of the other sons?
8 Dealing with Data
CuuDuongThanCong.com
/>
Scatter Plots B
4. a. Find a point that seems to be in the center of the cloud of
points. What are the father’s and son’s heights for this point?
b. What does this point tell you?
Dustin says, “From the graph, it looks like the taller the father is, the
taller the son is.”
5. Reflect Do you agree? Explain your reasoning.
6. a. Find three points for which sons are taller than their fathers.
Circle these points with a green pencil.
b. Find three points for which fathers are taller than their sons.
Circle these points with a red pencil.
c. Combine the class’s results on one graph. What patterns can
you see?
7. a. Find some points on the graph for which fathers are as tall as
their sons. Circle these points with a blue pencil.
b. What do you notice about how these points lie on the graph?
c. Study the graph you just colored. What can you say about the
heights of the fathers compared to the heights of the sons?
8. On Student Activity Sheet 3, make a scatter plot
of the class data that you collected for mothers
and daughters in Section A.
9. a. Find some points on your plot that represent
mothers and daughters who are equal in height.
Draw a line through these points.
b. What does it mean if a point lies above this line?
c. What does it mean if a point lies below the line?
d. What does it mean if a point lies very far from
the line?
10. Reflect What possible conclusions can you make based on your
data of mothers’ and daughters’ heights? Write an argument to
support your conclusions.
Section B: Scatter Plots 9
CuuDuongThanCong.com
/>
B Scatter Plots
Graphs of data can help you see patterns that you cannot see in a list
of numbers. Looking at a picture, you can see the patterns in the data
all at once.
A scatter plot is a good graph
to use when you have two
data sets that are paired in
some way.
Scatter plots can help you see
features of the data, such as
whether the tallest mother has
the tallest daughter. Scatter
plots can also reveal patterns.
80
Daughters’ Height
(in inches)
The graph on the right has data
for mothers’ and daughters’
heights in inches.
Sample Class Data
75
70
65
60
58
58 60
65
70
75
80
Mothers’ Height
(in inches)
In scatter plots like those for the heights of parents and their children,
you can draw a line through the points where members of pairs have
the same value. This line can help you to see relationships.
1. In the graph in the Summary above, you see data of mothers’
and daughters’ heights in inches.
a. What do the points above the dotted line indicate?
b. What do the points on the dotted line indicate?
c. What do the points below the dotted line indicate?
d. Make a general statement about the height of mothers and
daughters based on this graph.
10 Dealing with Data
CuuDuongThanCong.com
/>
Athletes can measure their condition with a test called the Cooper
test. They have to run as far as possible in exactly 12 minutes. Up
to age eight, they run for six minutes.
In the table, you find
the results for a group
of girls between ages
four and eight.
Name
Age
Distance
(in meters)
Rayna
7
1,210
Jacinta
8
1,070
Bridget
6
1,020
Kiyo
8
960
Keva
7
910
Ashley
7
1,160
Mila
7
1,090
Barb
7
950
MinJung
8
900
Daya
6
770
Yvinne
4
620
Maria
5
600
Coretta
4
400
Chris
8
1,200
Stacey
5
730
2. a. Make a scatter plot using the results in the table. Put the girls’
ages on the horizontal axis.
b. Write three conclusions based on your graph.
Describe how a scatter plot helps or does not help you understand
something about the data the plot represents. Use data sets from
Sections A and B to illustrate what you mean.
Section B: Scatter Plots 11
CuuDuongThanCong.com
/>
C
Stem-and-Leaf Plots
and Histograms
Stem-and-Leaf Plots
Theodore Roosevelt was the youngest person to become president
of the United States. He was 42 at his inauguration. John F. Kennedy
was 43, making him the second youngest.
Theodore Roosevelt
John F. Kennedy
1. a. Is it possible for a 40-year-old to be president of the
United States?
b. Reflect How old do you think a president of the United States
should be?
Pages 13 and 14 show when all of the presidents of the United
States were born, when they were inaugurated as president,
and when they died.
2. Who was the oldest person ever to become president of
the United States?
12 Dealing with Data
CuuDuongThanCong.com
/>
Stem-and-Leaf Plots and Histograms C
Name
Born
Inaugurated at Age
Died
at Age
George Washington
Feb. 22, 1732
1789
57
Dec. 14, 1799
67
John Adams
Oct. 30, 1735
1797
61
Jul. 4, 1826
90
Thomas Jefferson
Apr. 13, 1743
1801
57
Jul. 4, 1826
83
James Madison
Mar. 16, 1751
1809
57
Jun. 28, 1836
85
James Monroe
Apr. 28, 1758
1817
58
Jul. 4, 1831
73
John Q. Adams
Jul. 11, 1767
1825
57
Feb. 23, 1848
80
Andrew Jackson
Mar. 15, 1767
1829
61
Jun. 8, 1845
78
Martin Van Buren
Dec. 5, 1782
1837
54
Jul. 24, 1862
79
William H. Harrison
Feb. 9, 1773
1841
68
Apr. 4, 1841
68
John Tyler
Mar. 29, 1790
1841
51
Jan. 18, 1862
71
James K. Polk
Nov. 2, 1795
1845
49
Jun. 15, 1849
53
Zachary Taylor
Nov. 24, 1784
1849
64
Jul. 9, 1850
65
Millard Fillmore
Jan. 7, 1800
1850
50
Mar. 8, 1874
74
Franklin Pierce
Nov. 23, 1804
1853
48
Oct. 8, 1869
64
James Buchanan
Apr. 23, 1791
1857
65
Jun. 1, 1868
77
Abraham Lincoln
Feb. 12, 1809
1861
52
Apr. 15, 1865
56
Andrew Johnson
Dec. 29, 1808
1865
56
Jul. 31, 1875
66
Ulysses S. Grant
Apr. 27, 1822
1869
46
Jul. 23, 1885
63
Rutherford B. Hayes
Oct. 4, 1822
1877
54
Jan. 17, 1893
70
James A. Garfield
Nov. 19, 1831
1881
49
Sep. 19, 1881
49
Chester A. Arthur
Oct. 5, 1829
1881
51
Nov. 18, 1886
57
Grover Cleveland
Mar. 18, 1837
1885
47
Jun. 24, 1908
71
Benjamin Harrison
Aug. 20, 1833
1889
55
Mar. 13, 1901
67
Grover Cleveland
Mar. 18, 1837
1893
55
Jun. 24, 1908
71
William McKinley
Jan. 29, 1843
1897
54
Sep. 14, 1901
58
Section C: Stem-and-Leaf Plots and Histograms 13
CuuDuongThanCong.com
/>
C Stem-and-Leaf Plots and Histograms
Name
Born
Inaugurated at Age
Died
at Age
Theodore Roosevelt
Oct. 27, 1858
1901
42
Jan. 6, 1919
60
William H. Taft
Sep. 15, 1857
1909
51
Mar. 8, 1930
72
Woodrow Wilson
Dec. 28, 1856
1913
56
Feb. 3, 1924
67
Warren G. Harding
Nov. 2, 1865
1921
55
Aug. 2, 1923
57
Calvin Coolidge
Jul. 4, 1872
1923
51
Jan. 5, 1933
60
Herbert C. Hoover
Aug. 10, 1874
1929
54
Oct. 20, 1964
90
Franklin D. Roosevelt
Jan. 30, 1882
1933
51
Apr.12, 1945
63
Harry S. Truman
May 8, 1884
1945
60
Dec. 26, 1972
88
Dwight D. Eisenhower Oct. 14, 1890
1953
62
Mar. 28, 1969
78
John F. Kennedy
May 29, 1917
1961
43
Nov. 22, 1963
46
Lyndon B. Johnson
Aug. 27, 1908
1963
55
Jan. 22, 1973
64
Richard M. Nixon*
Jan. 9, 1913
1969
56
Apr. 22, 1994
81
Gerald R. Ford
Jul. 14, 1913
1974
61
James E. Carter
Oct. 1, 1924
1977
52
Ronald Reagan
Feb. 6, 1911
1981
69
Jun. 5, 2004
93
George Bush
Jun. 12, 1924
1989
64
William J. Clinton
Aug. 19, 1946
1993
46
George W. Bush
Jul. 6, 1946
2001
54
*Resigned Aug. 9, 1974
Most of the presidents were
from 50 to 54 years old at
the time of inauguration.
3. Reflect Do you agree with this student?
Write down your reasons.
14 Dealing with Data
CuuDuongThanCong.com
/>
Stem-and-Leaf Plots and Histograms C
It is possible to organize the numbers into a new list or a diagram that
makes it easier to see the distribution of the ages of the presidents at
inauguration. This can be done in several ways.
4. a. Organize the numbers into a new list or a diagram that makes
it easier to see the distribution of the ages of the presidents at
inauguration.
b. Write some conclusions that you can draw from the list or
diagram that you made for part a.
Sarah made a dot plot of the presidents’ ages at the time of their
inauguration.
42
44
46
48
50
52
54
56
58
60
62
64
66
68
70
Age at Inauguration
5. a. What information is easier to see in this graph than in the list
on pages 13 and 14?
b. What information is missing?
6. Write at least three conclusions that you can draw from Sarah’s
dot plot. Write them in sentences beginning, for example:
•
Most presidents were about _____________ at the time of
their inauguration.
•
•
Very few presidents _____________ .
_____________ .
The value that occurs most often in a data set is called the mode.
7. What is the mode of the presidents’ ages at inauguration?
Age
40’s
Numb
e
Presid r of
ents
50’s
60’s
Jamaal thought it would be better to divide the ages into
groups first and then look at what that might tell him. He
made a table and tallied the ages of the first 10 presidents.
8. a. Copy Jamaal’s table into your notebook and finish
it. What does it tell you about the ages?
b. Compare Jamaal’s table to Sarah’s graph.
Section C: Stem-and-Leaf Plots and Histograms
CuuDuongThanCong.com
/>
15
C Stem-and-Leaf Plots and Histograms
Unfortunately, you cannot see the exact ages with Jamaal’s method.
One way to tally the ages so that you can see all of the numbers is to
use a stem-and-leaf plot.
In a stem-and-leaf plot, each number is split into two parts, in this
case a tens digit and a ones digit.
The first age in the list is 57.
This would be written as:
5 7
You can make a stem-and-leaf plot like this one by going through the
list of presidents on pages 13 and 14 and splitting each age into a tens
digit and a ones digit.
Presidents’ Ages at Inauguration
4
5
6
9 8 6 9 7 2
7 7 7 8 7 4 1 0 2 6 4 1 5 5 4 1 6 5 1 4 1
1 1 8 4 5
Note: So that everyone can read
your diagram, you should always
include a key like the one in the
bottom corner, explaining what
the numbers mean.
Key: 5 | 7 means 57 years
In the stem-and-leaf plot above, 4 ͉ 9 8 6 9 7 2 stands for six presidents
who were ages 49, 48, 46, 49, 47, and 42 at inauguration. All the ages
at inauguration have been recorded except the last 11.
9. a. Copy and finish the stem-and-leaf plot.
(You will start with Harry S. Truman.)
Make sure you show the ages of all
43 presidents.
b. Compare this stem-and-leaf plot to
Jamaal’s table on page 15. How are
they different?
10. Reflect Why do you think this diagram
is called a stem-and-leaf plot?
Harry S. Truman
(1884–1972)
16 Dealing with Data
CuuDuongThanCong.com
/>
Stem-and-Leaf Plots and Histograms C
This is hard to
read! Let’s order
the data in each
group.
I think the groups
are too big. Let’s split
each age group into
smaller groups.
You can make your stem-and-leaf plot easier to read.
11. Make two new stem-and-leaf plots to include the suggestions
made above. (Be sure to include a key for each.)
a. Make one plot that gives the ages in order.
b. Make another plot that splits each row into two rows.
12. Consider your answer to problem 1 of this section for which you
decided how old you thought a president of the United States
should be. How many presidents were that age at inauguration?
13. What is the “typical” age of a U.S. president at inauguration?
Explain your reasoning.
Section C: Stem-and-Leaf Plots and Histograms 17
CuuDuongThanCong.com
/>
C Stem-and-Leaf Plots and Histogram
Histograms
Presidents’ Ages
at Inauguration
13
In this histogram, the ages have been put into
groups spanning five years, so the width of each
bar is 5 years. Ages 50 through 54, for example,
are in the same group.
12
11
Number of Presidents
This graph is called a histogram. It is a histogram
of the ages of the presidents of the United States
at inauguration.
10
9
14. a. How can you use your stem-and-leaf plots
from problem 11 to make this histogram?
8
7
6
b. Can you tell just by looking at the histogram
how many presidents were 57 years old
when they were inaugurated?
5
4
3
2
1
0
30 35 40 45 50 55 60 65 70 75 80
Age at Inauguration
Your Teacher’s Head
•
Without measuring, estimate the length (in centimeters) of
your teacher’s head. Then collect the estimates from your
classmates and make a histogram of the data. You will need
to decide on a width for the bars.
•
Now look at the collected data and decide whether to change
your guess about the length of your teacher’s head. When the
class has agreed on a length, find out how close the real length
is to the class guess.
?
18 Dealing with Data
CuuDuongThanCong.com
/>
Stem-and-Leaf Plots and Histograms C
PLOT
i
Number of Fathers
Now look again at the Pearson and Lee data. Here you see three
different histograms of the heights of the fathers.
20
10
0
50 51 52 53 54 55 56 57 58 59 60 61 62 63 64 65 66 67 68 69 70 71 72 73 74 75 76 77 78 79 80
PLOT
ii
Number of Fathers
,
Fathers Heights (in inches)
160
150
140
130
120
110
100
90
80
70
60
50
40
30
20
10
0
50 51 52 53 54 55 56 57 58 59 60 61 62 63 64 65 66 67 68 69 70 71 72 73 74 75 76 77 78 79 80
,
Fathers Heights (in inches)
900
PLOT
iii
Number of Fathers
800
700
600
500
400
300
200
100
0
50
60
70
80
,
Fathers Heights (in inches)
15. a. What is the width of a bar in each of the three graphs?
b. On plot ii, which bar is the tallest, and what does that tell you?
c. Write one conclusion you can draw from each of the plots
i, ii, and iii.
d. What happens to the information that is presented as the
widths of the bars change?
16. Which of the three histograms gives you the most information?
Say something about the heights of the fathers, using the
histogram you chose.
Section C: Stem-and-Leaf Plots and Histograms 19
CuuDuongThanCong.com
/>