High Performance Computing Systems Performance Modeling, Benchmarking, and Simulation
Bạn đang xem bản rút gọn của tài liệu. Xem và tải ngay bản đầy đủ của tài liệu tại đây (20.07 MB, 269 trang )
LNCS 10724
Stephen Jarvis · Steven Wright
Simon Hammond (Eds.)
High Performance
Computing Systems
Performance Modeling,
Benchmarking, and Simulation
8th International Workshop, PMBS 2017
Denver, CO, USA, November 13, 2017
Proceedings
123
Lecture Notes in Computer Science
Commenced Publication in 1973
Founding and Former Series Editors:
Gerhard Goos, Juris Hartmanis, and Jan van Leeuwen
Editorial Board
David Hutchison
Lancaster University, Lancaster, UK
Takeo Kanade
Carnegie Mellon University, Pittsburgh, PA, USA
Josef Kittler
University of Surrey, Guildford, UK
Jon M. Kleinberg
Cornell University, Ithaca, NY, USA
Friedemann Mattern
ETH Zurich, Zurich, Switzerland
John C. Mitchell
Stanford University, Stanford, CA, USA
Moni Naor
Weizmann Institute of Science, Rehovot, Israel
C. Pandu Rangan
Indian Institute of Technology, Madras, India
Bernhard Steffen
TU Dortmund University, Dortmund, Germany
Demetri Terzopoulos
University of California, Los Angeles, CA, USA
Doug Tygar
University of California, Berkeley, CA, USA
Gerhard Weikum
Max Planck Institute for Informatics, Saarbrücken, Germany
10724
More information about this series at />
Stephen Jarvis Steven Wright
Simon Hammond (Eds.)
•
High Performance
Computing Systems
Performance Modeling,
Benchmarking, and Simulation
8th International Workshop, PMBS 2017
Denver, CO, USA, November 13, 2017
Proceedings
123
Editors
Stephen Jarvis
University of Warwick
Coventry
UK
Simon Hammond
Sandia National Laboratories
Albuquerque, NM
USA
Steven Wright
University of Warwick
Coventry
UK
ISSN 0302-9743
ISSN 1611-3349 (electronic)
Lecture Notes in Computer Science
ISBN 978-3-319-72970-1
ISBN 978-3-319-72971-8 (eBook)
/>Library of Congress Control Number: 2017962895
LNCS Sublibrary: SL1 – Theoretical Computer Science and General Issues
© Springer International Publishing AG 2018
This work is subject to copyright. All rights are reserved by the Publisher, whether the whole or part of the
material is concerned, specifically the rights of translation, reprinting, reuse of illustrations, recitation,
broadcasting, reproduction on microfilms or in any other physical way, and transmission or information
storage and retrieval, electronic adaptation, computer software, or by similar or dissimilar methodology now
known or hereafter developed.
The use of general descriptive names, registered names, trademarks, service marks, etc. in this publication
does not imply, even in the absence of a specific statement, that such names are exempt from the relevant
protective laws and regulations and therefore free for general use.
The publisher, the authors and the editors are safe to assume that the advice and information in this book are
believed to be true and accurate at the date of publication. Neither the publisher nor the authors or the editors
give a warranty, express or implied, with respect to the material contained herein or for any errors or
omissions that may have been made. The publisher remains neutral with regard to jurisdictional claims in
published maps and institutional affiliations.
Printed on acid-free paper
This Springer imprint is published by Springer Nature
The registered company is Springer International Publishing AG
The registered company address is: Gewerbestrasse 11, 6330 Cham, Switzerland
Special Issue on the 8th International Workshop on
Performance Modeling, Benchmarking and Simulation
of High Performance Computing Systems (PMBS 2017)
This volume contains the 13 papers that were presented at the 8th International
Workshop on Performance Modeling, Benchmarking, and Simulation of High Performance Computing Systems (PMBS 2017), which was held as part of the 29th
ACM/IEEE International Conference for High Performance Computing, Networking,
Storage, and Analysis (SC 2017) at the Colorado Convention Centre in Denver
between 12–17 November 2017. SC offers a vibrant technical program, which includes
technical papers, tutorials in advanced areas, Birds of a Feather sessions (BoFs), panel
debates, a doctoral showcase, and a number of technical workshops in specialist areas
(of which PMBS is one). The focus of PMBS is comparing high performance computing systems through performance modeling, benchmarking, or the use of tools such
as simulators. Contributions are sought in areas including: performance modeling and
analysis of applications and high performance computing systems; novel techniques
and tools for performance evaluation and prediction; advanced simulation techniques
and tools; micro-benchmarking, application benchmarking, and tracing;
performance-driven code optimization and scalability analysis; verification and validation of performance models; benchmarking and performance analysis of novel
hardware; performance concerns in software/hardware co-design; tuning and
auto-tuning of HPC applications and algorithms; benchmark suites; performance
visualization; real-world case studies; studies of novel hardware such as Intel’s Knights
Landing platform and NVIDIA Pascal GPUs.
The 8th International Workshop on Performance Modeling, Benchmarking and
Simulation of High Performance Computing Systems (PMBS 2017) was held on
November 13 as part of the 29th ACM/IEEE International Conference for High Performance Computing, Networking, Storage, and Analysis (SC 2017) at the Colorado
Convention Center in Denver during November 12–17, 2017.
The SC conference is the premier international forum for high performance computing, networking, storage, and analysis. The conference is unique in that it hosts a
wide range of international participants from academia, national laboratories, and
industry; this year’s conference attracted over 13,000 attendees and featured over 350
exhibitors in the industry’s largest HPC technology fair.
This year’s conference was themed “HPC Connects,” encouraging academia and
industry to come together to inspire new collaborations between different fields of
science, with the goal of bringing about an impact on society and the changing nature
of our world.
SC offers a vibrant technical program, which includes technical papers, tutorials in
advanced areas, Birds of a Feather sessions (BoFs), panel debates, a doctoral showcase,
and a number of technical workshops in specialist areas (of which PMBS is one).
VI
Special Issue on the 8th International Workshop
The focus of the PMBS 2017 workshop was comparing high performance computing systems through performance modeling, benchmarking, or the use of tools such
as simulators. We were particularly interested in receiving research papers that reported
on the ability to measure and make trade-offs in hardware/software co-design to
improve sustained application performance. We were also keen to capture the
assessment of future systems, for example, through work that ensured continued
application scalability through peta- and exa-scale systems.
Like SC 2017, the aim of the PMBS 2017 workshop was to bring together
researchers from industry, national labs, and academia, who are concerned with the
qualitative and quantitative evaluation and modeling of high performance computing
systems. Authors were invited to submit novel research in all areas of performance
modeling, benchmarking, and simulation, and we welcomed research that combined
novel theory and practice. We also expressed an interest in submissions that included
analysis of power consumption and reliability, and were receptive to performance
modeling research that made use of analytical methods as well as those based on
tracing tools and simulators.
Technical submissions were encouraged in areas including: performance modeling
and analysis of applications and high performance computing systems; novel techniques and tools for performance evaluation and prediction; advanced simulation
techniques and tools; micro-benchmarking, application benchmarking, and tracing;
performance-driven code optimization and scalability analysis; verification and validation of performance models; benchmarking and performance analysis of novel
hardware; performance concerns in software/hardware co-design; tuning and
auto-tuning of HPC applications and algorithms; benchmark suites; performance
visualization; real-world case studies; and studies of novel hardware such as the Intel’s
Knights Landing platform and NVIDIA Pascal GPUs.
PMBS 2017
We received a good number of submissions for this year’s workshop. This meant that
we were able to be selective in those papers that were chosen; the acceptance rate for
papers was approximately 35%. The resulting papers show worldwide programs of
research committed to understanding application and architecture performance to
enable exascale computational science.
The workshop included contributions from Argonne National Laboratory,
Brookhaven National Laboratory, Clemson University, École Normale Supérieure de
Lyon, Edinburgh Parallel Computing Centre, ENS Lyon, Florida State University,
Hewlett Packard Labs, Inria, Lawrence Berkley National Laboratory, Los Alamos
National Laboratory, New Mexico State University, NVIDIA Corporation, Pacific
Northwest National Laboratory, Pazmany Peter Catholic University, Universidade de
Lisboa, University of Basel, University of Bristol, University at Buffalo, University of
Cambridge, University of Chicago, University of Florida, University of Tennessee,
University of Udine, University of Warwick, and Vanderbilt University.
Special Issue on the 8th International Workshop
VII
Several of the papers are concerned with “Performance Evaluation and Analysis”
(see Section A). The paper by Nathan Tallent et al. discusses the performance differences between PCIe- and NVLink-connected GPU devices on deep learning workloads. They demonstrate the performance advantage of NVLink over PCIe- connected
GPUs. Balogh et al. provide a comprehensive survey of parallelization approaches,
languages and compilers for unstructured mesh algorithms on GPU architectures. In
particular, they show improvements in performance for CUDA codes when using the
Clang compiler over NVIDIA’s own nvcc. Guillaume Aupy and colleagues exploit the
periodic nature of I/O in HPC applications to develop efficient scheduling strategies.
Using their scheduling strategy they demonstrate a 32% increase in throughput on the
Mira system. Finally, Romero et al. document their porting of the PWscf code to
multi-core and GPU systems decreasing time-to-solution by 2–3Â.
Section B of the proceedings collates papers concerned with “Performance
Modeling and Simulation.” Nicolas Denoyelle et al. present the cache-aware roofline
model (CARM) and validate the model on a Xeon Phi Knights Landing platform.
Similarly, Chennupati et al. document a scalable memory model to enable CPU performance prediction. Mollah et al. examine universal globally adaptive load-balanced
routing algorithms on the Dragonfly topology. Their performance model is able to
accurately predict the aggregate throughput for Dragonfly networks. Cavelan et al.
apply algorithm-based focused recovery (ABFR) to N-body computations. They
compare this approach with the classic checkpoint/restart strategy and show significant
gains over the latter. Zhang et al. propose a multi-fidelity surrogate modeling approach,
using a combination of low-fidelity models (mini-applications) and a small number of
high fidelity models (production applications) to enable faster application/architecture
co-design cycles. They demonstrate an improvement over using either low-fidelity
models or high-fidelity models alone. Finally, Simakov and colleagues document their
development of a simulator of the Slurm resource manager. Their simulation is able to
use historical logs to simulate different scheduling algorithms to identify potential
optimizations in the scheduler.
The final section of the proceedings, Section C, contains the three short papers
presented at PMBS. The paper by Yoga et al. discusses their extension to the Gen-Z
communication protocol in the structural simulation toolkit, enabling source-code
attribution tagging in network packets. Tyler Allen and colleagues at the Lawrence
Berkley National Laboratory, conduct a performance and energy survey for NERSC
workloads on Intel KNL and Haswell architectures. The final paper in this volume, by
Turner and McIntosh-Smith, presents a survey of application memory usage on the
ARCHER national supercomputer.
The PMBS 2017 workshop was extremely well attended and we thank the participants for the lively discussion and positive feedback received throughout the workshop. We hope to be able to repeat this success in future years.
The SC conference series is sponsored by the IEEE Computer Society and the ACM
(Association for Computing Machinery). We are extremely grateful for the support we
received from the SC 2017 Steering Committee, and in particular from Almadena
Chtchelkanova and Luiz DeRose, the workshop chair and vice chair.
The PMBS 2017 workshop was only possible thanks to significant input from AWE
in the UK, and from Sandia National Laboratories and the Lawrence Livermore
VIII
Special Issue on the 8th International Workshop
National Laboratory in the USA. We acknowledge the support of the AWE Technical
Outreach Program (project CDK0724).
We are also grateful to LNCS for their support, and to Alfred Hofmann and Anna
Kramer for assisting with the production of this issue.
November 2017
Stephen A. Jarvis
Steven A. Wright
Simon D. Hammond
Organization
Workshop Chairs
Stephen Jarvis
Steven Wright
Simon Hammond
University of Warwick, UK
University of Warwick, UK
Sandia National Laboratories (NM), USA
Workshop Technical Program Committee
Reid Atcheson
Pavan Balaji
Prasanna Balaprakash
David Beckingsale
Abhinav Bhatele
Robert Bird
Richard Bunt
Cristopher Carothers
Patrick Carribault
Aurélien Cavelan
Raphaël Couturier
Todd Gamblin
Wayne Gaudin
Paddy Gillies
Jeff Hammond
Andreas Hansson
Andy Herdman
Thomas Ilsche
Nikhil Jain
Guido Juckeland
Michael Klemm
Andrew Mallinson
Satheesh Maheswaran
Simon McIntosh-Smith
Branden Moore
Misbah Mubarak
Gihan Mudalige
Elmar Peise
John Pennycook
Karthik Raman
István Reguly
Jose Cano Reyes
Numerical Algorithms Group Ltd., UK
Argonne National Laboratory, USA
Argonne National Laboratory, USA
Lawrence Livermore National Laboratory, USA
Lawrence Livermore National Laboratory, USA
Los Alamos National Laboratory, USA
ARM Ltd., UK
Rensselaer Polytechnic Institute, USA
CEA, France
University of Basel, Switzerland
L’université Bourgogne, Franche-Comté, France
Lawrence Livermore National Laboratory, USA
NVIDIA, UK
European Centre for Medium-Range Weather
Forecasts, UK
Intel Corporation, USA
ARM Ltd., UK
UK Atomic Weapons Establishment, UK
Technische Universität Dresden, Germany
Lawrence Livermore National Laboratory, USA
Helmholtz-Zentrum Dresden-Rossendorf, Germany
Intel Corporation, Germany
Intel Corporation, UK
UK Atomic Weapons Establishment, UK
Bristol University, UK
Sandia National Laboratores (NM), USA
Argonne National Laboratory, USA
University of Warwick, UK
AICES, RWTH Aachen, Germany
Intel Corporation, USA
Intel Corporation, USA
Pázmány Péter Catholic University, Hungary
University of Edinburgh, UK
X
Organization
Yves Robert
Stephen Roberts
Arun Rodrigues
Fabio Schifano
Andrey Semin
Govind Sreekar Shenoy
Thomas Steinke
Peter Strazdins
Christian Trott
Alejandro Valero
Yunquan Zhang
ENS Lyon, France
ARM Ltd., UK
Sandia National Laboratories (NM), USA
Università di Ferrara, Italy
Intel Corporation, Germany
University of Edinburgh, UK
Zuse Institute Berlin, Germany
Australian National University, Australia
Sandia National Laboratories (NM), USA
University of Zaragoza, Spain
Chinese Academy of Sciences, China
Contents
Performance Evaluation and Analysis
Evaluating On-Node GPU Interconnects for Deep Learning Workloads . . . . .
Nathan R. Tallent, Nitin A. Gawande, Charles Siegel, Abhinav Vishnu,
and Adolfy Hoisie
Comparison of Parallelisation Approaches, Languages, and Compilers
for Unstructured Mesh Algorithms on GPUs . . . . . . . . . . . . . . . . . . . . . . .
G. D. Balogh, I. Z. Reguly, and G. R. Mudalige
Periodic I/O Scheduling for Super-Computers . . . . . . . . . . . . . . . . . . . . . . .
Guillaume Aupy, Ana Gainaru, and Valentin Le Fèvre
A Performance Study of Quantum ESPRESSO’s PWscf Code
on Multi-core and GPU Systems . . . . . . . . . . . . . . . . . . . . . . . . . . . . . . . .
Joshua Romero, Everett Phillips, Gregory Ruetsch,
Massimiliano Fatica, Filippo Spiga, and Paolo Giannozzi
3
22
44
67
Performance Modeling and Simulation
Modeling Large Compute Nodes with Heterogeneous Memories
with Cache-Aware Roofline Model . . . . . . . . . . . . . . . . . . . . . . . . . . . . . .
Nicolas Denoyelle, Brice Goglin, Aleksandar Ilic,
Emmanuel Jeannot, and Leonel Sousa
91
A Scalable Analytical Memory Model for CPU Performance Prediction . . . . .
Gopinath Chennupati, Nandakishore Santhi, Robert Bird,
Sunil Thulasidasan, Abdel-Hameed A. Badawy, Satyajayant Misra,
and Stephan Eidenbenz
114
Modeling UGAL on the Dragonfly Topology . . . . . . . . . . . . . . . . . . . . . . .
Md Atiqul Mollah, Peyman Faizian, Md Shafayat Rahman,
Xin Yuan, Scott Pakin, and Michael Lang
136
Resilient N-Body Tree Computations with Algorithm-Based
Focused Recovery: Model and Performance Analysis . . . . . . . . . . . . . . . . .
Aurélien Cavelan, Aiman Fang, Andrew A. Chien,
and Yves Robert
Multi-fidelity Surrogate Modeling for Application/Architecture Co-design . . .
Yiming Zhang, Aravind Neelakantan, Nalini Kumar, Chanyoung Park,
Raphael T. Haftka, Nam H. Kim, and Herman Lam
158
179
XII
Contents
A Slurm Simulator: Implementation and Parametric Analysis . . . . . . . . . . . .
Nikolay A. Simakov, Martins D. Innus, Matthew D. Jones,
Robert L. DeLeon, Joseph P. White, Steven M. Gallo,
Abani K. Patra, and Thomas R. Furlani
197
Short Papers
Path-Synchronous Performance Monitoring in HPC
Interconnection Networks with Source-Code Attribution . . . . . . . . . . . . . . .
Adarsh Yoga and Milind Chabbi
Performance and Energy Usage of Workloads on KNL
and Haswell Architectures . . . . . . . . . . . . . . . . . . . . . . . . . . . . . . . . . . . .
Tyler Allen, Christopher S. Daley, Douglas Doerfler,
Brian Austin, and Nicholas J. Wright
221
236
A Survey of Application Memory Usage on a National Supercomputer:
An Analysis of Memory Requirements on ARCHER. . . . . . . . . . . . . . . . . .
Andy Turner and Simon McIntosh-Smith
250
Author Index . . . . . . . . . . . . . . . . . . . . . . . . . . . . . . . . . . . . . . . . . . . .
261
Performance Evaluation and Analysis
Evaluating On-Node GPU Interconnects
for Deep Learning Workloads
Nathan R. Tallent1(B) , Nitin A. Gawande1 , Charles Siegel1 , Abhinav Vishnu1 ,
and Adolfy Hoisie2
1
Pacific Northwest National Laboratory, Richland, WA, USA
{nathan.tallent,nitin.gawande,charles.siegel,abhinav.vishnu}@pnnl.gov
2
Brookhaven National Laboratory, Upton, NY, USA
Abstract. Scaling deep learning workloads across multiple GPUs on
a single node has become increasingly important in data analytics. A
key question is how well a PCIe-based GPU interconnect can perform
relative to a custom high-performance interconnect such as NVIDIA’s
NVLink. This paper evaluates two such on-node interconnects for eight
NVIDIA Pascal P100 GPUs: (a) the NVIDIA DGX-1’s NVLink 1.0
‘hybrid cube mesh’; and (b) the Cirrascale GX8’s two-level PCIe tree
using dual SR3615 switch risers. To show the effects of a range of neural network workloads, we define a parameterized version of the popular
ResNet architecture. We define a workload intensity metric that characterizes the expected computation/communication ratio; we also locate
AlexNet and GoogLeNet within that space. As expected, the DGX-1 typically has superior performance. However, the GX8 is very competitive
on all ResNet workloads. With 8 GPUs, the GX8 can outperform the
DGX-1 on all-to-all reductions by 10% for medium-sized payloads; and
in rare cases, the GX8 slightly outperforms on ResNet.
Keywords: GPU interconnects · NVIDIA DGX-1 · NVIDIA NVLink
Cirrascale SR3615 switch riser · Convolutional neural networks
1
Introduction
Scaling deep learning workloads across multiple GPUs has become increasingly
important in data analytics. For example, strong scaling can reduce the training
time of neural networks. Moreover to train deep networks on large data sets, it
may be necessary to harness multiple GPU memories.
The inter-GPU network can dictate performance when scaling deep learning
workloads across multiple GPUs. Figure 1 shows that scaling some workloads
is impossible without a high-performance interconnect [1]. The figure shows
strong scaling behavior of two well known workloads — CifarNet/Cifar10 and
AlexNet/ImageNet — on an NVIDIA DGX-1 [2] and an Intel Knights Landing [3] (KNL) cluster. The DGX-1 uses an NVLink-based GPU interconnect. The
KNL cluster interconnects KNL processors (1 per node) using Intel’s Omni-Path.
For each workload, the single-KNL/GPU performance is very similar — despite
c Springer International Publishing AG 2018
S. Jarvis et al. (Eds.): PMBS 2017, LNCS 10724, pp. 3–21, 2018.
/>
4
N. R. Tallent et al.
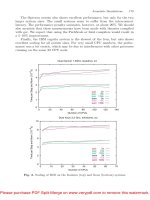
Fig. 1. Performance scaling of (a) CifarNet/Cifar10 and (b) AlexNet/ImageNet on an
NVIDIA DGX-1 and an Intel KNL/Omni-Path cluster.
the GPU’s higher peak floating point rate. However, scaling behavior is quite
different. Although both workloads perform better over NVLink than OmniPath, the qualitative scaling trends are different. With NVLink, the AlexNet
workload (Fig. 1b) scales better than the CifarNet one (Fig. 1a). With OmniPath, the qualitative scaling performance is inverted : scaling is better with CifarNet than AlexNet. The reason is that AlexNet’s much larger all-to-all reduction
operations (allreduce) place a much higher stress on interconnect bandwidth.
Omni-Path, designed as a cluster interconnect, has a per-node (uni-directional)
bandwidth of 12.5 GB/s whereas the DGX-1’s NVLink supports up to 80 GB/s
per GPU.
Because GPU interconnect performance can be a bottleneck when scaling
deep learning workloads, some computing vendors are creating products to
enable scalable GPU computing on a single densely populated node. A key
question is how well a PCIe-based GPU interconnect can perform relative to
a custom high-performance interconnect such as NVIDIA’s NVLink. Unfortunately, it is difficult for data scientists to quantify the potential of these different
products. In particular, Fig. 1 shows that a high-performance interconnect may
not be critical to scaling. The interconnect’s importance depends significantly on
a workload’s characteristics, including total work and effective communication
to computation ratio.
This paper evaluates two recent GPU interconnects (Sect. 2) for eight
NVIDIA Pascal P100 GPUs on a single node: (a) the NVIDIA DGX-1’s ‘hybrid
cube mesh’ based on NVLink 1.0; and (b) the Cirrascale GX8’s [4] two-level
PCIe tree using two Cirrascale SR3615 switch risers.
We evaluate the two interconnects on a parameterized neural network workload (Sect. 3). The performance scaling of a parameterized neural network space
has not been well studied. Other performance evaluations select specific networks — for example AlexNet [5] and GoogLeNet [6] — that have been designed
for classifier performance, not workload evaluation. We define a parameterized
variant of the popular ResNet [7] with controllable computational and communication intensities. With our parameterized ResNet, we show the effects of
different neural network topologies and batch sizes on a workload’s communication/computation ratio and scaling behavior. We define a workload intensity
Evaluating On-Node GPU Interconnect for Deep Learning Workloads
5
metric to characterize space of workload intensities and locate AlexNet and
GoogLeNet within that space.
Our findings (Sect. 4) are as follows. The workload intensity metric in helpful
in explaining scaling behavior. Given that the DGX-1’s NVLink interconnect has
more links and higher per-link bandwidth than the GX8’s PCIe bus, it is not
surprising that the DGX-1 typically has superior performance. However, we find
that the GX8 is very competitive for all ResNet-style workloads; in rare cases,
the GX8 slightly outperforms. Surprisingly, with 8 GPUs, the GX8 can outperform the DGX-1 on an allreduce benchmark by as much as 10% on payloads
between 0.5–6 MB. In contrast, with 4 GPUs the DGX-1 allreduces outperform
the GX8 by 40%. The reason is that with 8 GPUs, the PCIe network saturates
more quickly with respect to payload size. The DGX-1 has a distinct scaling
advantage for the communication-intensive AlexNet where we hypothesize that
load imbalance enables its NVLink interconnect to perform closer to the 4 GPU
bandwidths than 8, resulting in a 36% DGX-1 advantage.
2
Multi-GPU Computing Systems
This section describes the NVIDIA DGX-1 (Pascal) [2] and the Cirrascale GX8
(NVIDIA Pascal) [4] computing systems and then explains the test configuration.
To isolate the interconnects, we configured the systems as closely as possible
except for GPU interconnect.
Each system has a very similar host processor configuration. Both systems
have a dual-processor host based on Intel Xeon processors. For the DGX-1, each
processor is an Intel Xeon E5-2698v4; for the GX8, it is an E5-2697v4. The DGX1’s Xeon has 20 cores, two threads enabled per core, running at 2.2/3.6 GHz;
and a 50 MB L3 cache, a 256 KB L2 cache shared between two cores, and 64 KB
L1 cache per core. The GX8’s Xeon has 18 cores with 2 thread/core, running
at 2.3/3.6 GHz; L3 45 MB. In both cases, host memory is 512 GB DDR4-2133.
Both systems use PCIe 3.0.
All important workload activities (e.g., neural network training) occurs on the
GPUs. The primary work the host CPU performs is reading the initial training
data set into memory and transferring it to the GPUs. Both systems read the
large training inputs files from a local SSD whose throughput is sufficient to
overlap training and reading.
2.1
NVIDIA P100 Pascal
Both systems have eight NVIDIA Tesla P100 (Pascal) GPUs. To isolate the interconnects, we configured the systems with the closest possible GPUs: Tesla P100SXM2 and P100-PCIE-16GB. The DGX-1 has the former and the Cirrascale the
latter. The only P100 available with NVLink support is the P100-SXM2; and
because of NVLink support it uses a different form factor (SXM2). The P100PCIE-16GB is the ‘highest bin’ P100 available with the PCIe 3.0 × 16 interface. The only differences between the two P100s — besides NVLink and form
factor — are SM clock speed (1328 vs. 1189 MHz) and TDP (300 vs. 250 W).
6
N. R. Tallent et al.
Pascal GPUs are fabricated with a 16 nm process. Each GPU has 3584 CUDA
cores divided into 56 streaming multiprocessors (SM), where each SM has 64
CUDA cores. The P100-PCIE-16GB has a peak FP performance of 9.3 Teraflops
single precision (4.67 Teraflops double). Due to the higher clock rate, the P100SXM2 has a peak FP performance of 10.6 Teraflops single precision (5.3 Teraflops
double). Each GPU has 16 GB high-bandwidth global memory (HBM2), a 4096bit memory bus operating at 715 MHz (split into 8 memory controllers), and
4 MB L2 cache.
Normalizing GPU Performance. Given the different GPUs, it is necessary
to distinguish the performance effects of the varying GPU clocks from the different interconnects. One possibility is normalizing or scaling GPU performance
post facto. This approach is difficult with fixed clocks; and more difficult with
dynamically boosted clocks. Rather than attempting this approach, we powercapped both GPUs. The obvious approach is to cap both GPU variants at the
nominal frequency of the P100-PCIE-16GB, 1189 MHz. To present results as
close to the P100-SXM2 as possible, we found the maximum sustained frequency
of the P100-PCIE-16GB for a representative workload. That is, we empirically
identified the maximum frequency for the P100-PCIE-16GB to execute without throttling. Based on this study, we capped both GPUs at 1227 MHz, which
closes the gap by 27%. With this experimental setup, we expect the performance
of each GPU to be identical. The GPU performance is still sufficiently high to
highlight the scaling effects of each interconnect.
2.2
NVIDIA DGX-1 and NVLink 1.0
Figure 2 shows the DGX-1’s intra-node interconnect topology [2]. Each GPU’s
SXM2 interface, in contrast to the more conventional PCIe interface, connects
directly to the NVLink interconnect. The NVLink interconnect enables intranode GPU communication. Each GPU has 4 NVLink lanes arranged in a ‘hybrid
cube mesh’ topology. The hybrid cube mesh has two directly connected groups
of 4 along with 3D hypercube links between the groups. The topology ensures
that a GPU is no more than two hops away from another GPU.
Each of the 4 NVLink lanes supports 20 GB/s in both directions. Thus, the
total NVLink uni-directional bandwidth of a GPU is 80 GB/s. Each GPU also
connects via a PLX-switch to a PCIe 3.0 × 16 bus with maximum bandwidth of
16 GB/s (uni-directional). This PLX switch serves as a connecting point between
GPUs and CPUs, and a potential InfiniBand network.
2.3
Cirrascale GX8 and SR3615 Switch
The Cirrascale GX8 [4] system supports direct communication between 8 GPUs
using two Cirrascale SR3615 switch risers [8]. Communication occurs over the
PCIe bus, enabling a single memory address space.
Evaluating On-Node GPU Interconnect for Deep Learning Workloads
7
Fig. 2. Inter-GPU network on NVIDIA DGX-1.
Fig. 3. Inter-GPU network on Cirrascale GX8.
Figure 3 shows the GX8’s inter-GPU network. To enable communication over
a single PCIe bus (and hence single memory address space), the GX8 uses a tree
topology rooted at only one of the host CPUs [9]. The two-level tree is rooted
at one host’s on-die PCIe controller, a.k.a. the root complex, supporting PCIe
3.0×40. Attached to that host CPU are two SR3615 switch risers. Each SR3615’s
upstream is PCIe 3.0 × 16 (16 GB/s uni-directional). Two risers consume 32/40
lanes of the root complex. Communication between the SR3615s occurs via the
root complex using the standard PCIe bus.
Four P100s are attached to each SR3615 switch riser. Each GPU (P100-PCIE16GB) has a PCIe 3.0 × 16 interface. Thus, each switch riser’s input is 64 PCIe
8
N. R. Tallent et al.
lanes of GPU; and 16 out. As a result there is a peak uni-directional 16 GB/s
(PCIe 3.0 × 16) between any two GPUs.
Because of the SR3615 switch, communication paths do not all need to traverse the root complex. A pair of GPUs attached to different risers traverse two
switches and the PCIe root complex. However, a pair of GPUs attached to the
same switch require no intermediate paths.
2.4
Inter-GPU Communication
For inter-GPU (peer-to-peer) communication, we use a combination of CUDA
8.0 and the NVIDIA Collective Communications Library (NCCL). CUDA 8.0
includes support for GPUDirect, or GPU-to-GPU direct memory access (DMA).
NCCL [10,11] is a library for inter-GPU collective communication and synchronization. NCCL’s collective algorithms are based on topology-aware rings and
optimized for throughput [12,13]. NCCL is interconnect-aware and thus the same
collective call uses, as appropriate, the NVLink or PCIe interconnect. Available
collectives include allgather, allreduce, and broadcast.
To achieve high throughput on large payloads, NCCL’s algorithms are
pipelined based on small 4–16 KB chunks and GPUDirect peer-to-peer direct
access. With large payloads, pipelining hides the linear latency term of the ring
resulting in transfer bandwidths approaching link bandwidth [14]. However, for
small messages, the ring latency is exposed.
3
Workloads
In this paper, we develop a systematic approach for characterizing and specifying neural network workloads. To explore the effects of different neural network topologies and batch sizes on scaling behavior, we define a parameterized
variant of the popular ResNet [7] with controllable computational and communication intensities. We complement our study with results from the well known
AlexNet [5] and GoogLeNet [6]. The subsections below describe each CNN architecture. After each network is described, we characterize the space of workload
intensities and locate AlexNet and GoogLeNet within that space.
Each distinct neural-network training workload executes in the following manner. First, a given neural network architecture is replicated on each GPU. Then,
the neural network is trained, processing an image dataset sequentially in batches
or iterations. For each batch, images are divided among available GPUs for data
parallelism. To train, each GPU processes its images resulting in a series of
model activations — floating point operations — resulting in distinct values for
each GPU’s copy of model parameters. At the end of each iteration, allreduce
operations ensure each GPU’s model has an identical copy of model parameters.
For all workloads, we use the ImageNet Large Scale Visual Recognition Challenge (ILSVRC) [15], a well known benchmark for object classification and detection. Specifically, we use ILSVRC2012 which has 1000 object classes and 1.43 M
images annotated images, each of size 256 × 256.
Evaluating On-Node GPU Interconnect for Deep Learning Workloads
3.1
9
AlexNet
AlexNet [5] uses the ImageNet (ILSVRC2012) [15] dataset. Compared to nondeep learning methods, AlexNet has performed well on ILSVRC2012. AlexNet
has five convolution layers, three pooling layers, and two fully-connected layers.
This CNN architecture requires about 1.4 M activations/image and has 60 M
parameters.
3.2
GoogLeNet
GoogLeNet [6] is more complex model than AlexNet. GoogLeNet has two convolution layers, two pooling layers, and nine inception layers. Each inception
layer consists of six convolution layers and one pooling layer. The concept of
inception layer is to cover bigger area of images while maintaining fine resolution for small information on these images. The inception module of GoogLeNet
concatenates filters of different sizes into a single new filter. This avoids parameter explosion with the use of inception layers. GoogLeNet performs significantly
better than AlexNet for the ImageNet and the recent ILSVRC [15] challenge
datasets. This CNN architecture has about 5.5 M parameters. GoogLeNet in
relation to AlexNet has (i) more layers; (ii) fewer features per layer, and; (iii)
more activations. GoogLeNet has 10.8 M activations per image.
3.3
ResNet/x
Deep Residual Learning Network (ResNet) [7] introduced the concept of a residual block. Each block consists of two convolution layers along with a connection
adding the output of the second block to the input of the first. Residual blocks
are designed to allow the training of substantially deeper models than had been
trained previously. By adding the input of the block to its output, the residual
block learns the residual function, and forwards the activations to deeper layers
than earlier. One advantage of ResNet is that it can improve accuracy of the
model while avoiding parameter explosion. That is, the ResNet blocks increase
the depth (and inner layers) of the network instead of its width.
Using residual blocks as a fundamental building block, several ResNet incarnations have been designed by researchers, including ResNet50 and ResNet1000.
ResNets of various depths outperform GoogLeNet on the ILSVRC challenge,
with a 50 layer network — consisting of a convolutional layer, 48 residual blocks,
and a classifier layer — winning in 2015.
To explore the effects of different ResNet networks, we generate several
ResNet variants by defining each network’s inner layers to be a multiple of a
‘ResNet block’. This enables us to explore how neural network topology and
training batch size affects its communication/computation ratio and scaling. We
define ResNet/x to be a standard ResNet input and output layer but where the
inner layers are defined by x replications of the ‘ResNet block’. Thus, ResNet/1 is
a single convolution layer followed by a residual block and finally a classifier layer.
Similarly, ResNet/16 has the same convolution and classifier layers as ResNet/1
10
N. R. Tallent et al.
but 16 residual blocks. Using this parameterized definition, we can explore the
different computation and communication ratios by simply increasing the depth
of residual blocks.
Each ResNet block has a certain number of features. As a result, increasing
ResNet blocks proportionally increases activations/image and model parameters.
More precisely, activations/image as a function of the block replications x is
given with the following expression: 1, 204, 224x + 11, 55, 113. Similarly model
parameters as a function of replications is given by 46, 211x + 74, 857. Thus, our
ResNet/x models have the activations/image and parameters shown in Fig. 4.
Fig. 4. Activations and parameters for ResNet/x.
3.4
Workload Characterization
Figure 5 overviews the workloads we used in our study. To leverage well-known,
verified, and optimized implementations of convolutional neural networks (CNN),
we based our experiments on Convolutional Architecture for Fast Feature Embedding (Caffe) framework [16,17], a widely used framework for CNN models. Caffe
is a collection of state-of-the-art deep learning algorithms and reference models
in a clean and modifiable framework accessible through a open source repository [18].
Fig. 5. CNN architecture models and input datasets.
Figure 6 characterizes each workload’s batch properties using metrics representing work and work intensity. Figure 6a shows activations per batch, a measure
of total GPU work. The horizontal axis refers to the batch categories in Fig. 5.
(AlexNet and GoogLeNet each have two categories while ResNet/x has three.)
Evaluating On-Node GPU Interconnect for Deep Learning Workloads
11
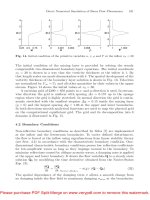
Fig. 6. Each workload’s (a) work and (b) work intensity (work/communication).
Fig. 7. Each workload’s intensity (work/communication) during strong scaling.
Observe the large spread of work shown along the vertical axis (independent of the
horizontal axis). The points densely cover over two orders of magnitude, specifically between 38 M and 5,500 M activations/batch.
Next we characterize work intensity, a measure of the ratio of communication to computation. Figure 6b shows activations per parameter for each batch,
a measure of the batch’s work intensity. We capture well over two orders of
magnitude of intensities, between 6–1650 activations/parameter. Our ResNet/x
parameter sweep densely covers the space between 300–1650; and it sandwiches
GoogLeNet.
Finally, we characterize each execution’s work intensity. For each performance experiment, the batch’s work is strong-scaled across 1, 2, 4 or 8 GPUs.
Figure 7 shows activations per parameter for each GPU, a measure of the communication/computation ratio during execution. We capture well over three orders
12
N. R. Tallent et al.
of magnitude of intensities, between 1–1650 activations per parameter per GPU.
Our ResNet/x parameter sweep densely covers most of the space (between 40–
1650); again, it sandwiches GoogLeNet.
4
Evaluation
We conduct a performance evaluation using strong scaling to highlight effects of
interconnect performance. Strong scaling is often desirable to reduce response
time. With strong scaling, the amount of available per-GPU work systematically
decreases, increasing the communication to computation ratio. In contrast to
strong scaling, weak scaling tends to mask performance effects of weaker interconnects.
We used NVIDIA’s optimized Caffe, a fork from BVLC-Caffe [18] optimized
for the DGX-1 architecture [19]. For AlexNet and GoogLeNet, we used NVIDIA’s
provided models. For ResNet/x, we defined custom versions. We confirmed that
all executions produced semantically meaningful results in that the models were
equivalent to a sequentially equivalent execution.
We present our results in four subsections. The first two subsections discuss
microbenchmarks for inter-GPU copies and NCCL collectives. We then show
scaling results for AlexNet and GoogLeNet. Finally we discuss ResNet/x.
4.1
Inter-GPU Data Transfer
We used MGBench [20] to collect bandwidths and latencies between pairs of
GPUs for GPU-to-GPU memory copy and GPU-to-GPU DMA (direct memory
access).
Fig. 8. Bandwidth of GPU-to-GPU memory copy for DGX-1 and GX8.
Figure 8a shows bandwidths between pairs of GPUs for GPU-to-GPU memory copy. (Units are in power of 2, or GiB.) This unidirectional GPU-to-GPU
memory copy is pipelined using CUDA’s asynchronous memory-copy primitive.
Evaluating On-Node GPU Interconnect for Deep Learning Workloads
13
Fig. 9. Latency of GPU-to-GPU memory copy for DGX-1 and GX8.
Rather than showing the full matrix for all pairs, we group the results by value
clusters, where each group has an insignificant spread.
Figure 9 shows latencies of GPU-to-GPU memory copy highlighted at four
different data sizes. A horizontal axis label of x-y means GPU x sent data to
GPU y. Although the figure shows data with GPU 0 as source, we validated that
using other GPUs as source produced qualitatively similar results.
For both figures, the DGX-1 results are typically clustered in two groups,
one representing a single NVLink hop and the other representing two NVLink
hops. The one-hop data corresponds to communication within a fully-connected
4-GPU cluster; achieved bandwidth is about 85% (17.2 GB/s) of the 20 GB/s
per-link peak. The two-hop data corresponds to communication between 4-GPU
clusters; achieved bandwidth is about 50% (9.6 GB/s) of the peak.
The GX8 results are clustered in three groups. The groups are clearly seen in
the latency plots (Fig. 9) for payload sizes 1 MB and above. The first two groups,
Intra-SR and Inter-SR, correspond to communication within and between an
SR3615 switch riser (SR), respectively. These groups are analogous to DGX-1
groups in that each SR forms a fully connected 4-GPU cluster. The Intra-SR
achieved bandwidth is about 75% (12.2 GB/s) of peak (16 GB/s). The Inter-SR
group includes GPUs 4, 6 and 7; achieved bandwidth is about 60% (9.6 GB/s)
of peak. The third Inter-SR* group captures the anomaly of sending data from
GPU 0 to 5. It turns out that the second logical PCIe slot (GPU5) has longer
physical signal paths between some elements on the ASIC which can lead to
delays in dequeuing PCIe packets [21]. The circumstances in which these delays
occur are narrow and more likely to originate within a microbenchmark than a
real world application. For example, we do not observe the behavior in collective
benchmarks.
Interestingly, the GX8 can have better bandwidth and latencies between
GPUs that are in different 4-GPU-clusters. Compare Fig. 8a’s Inter-SR and