Ứng dụng kỹ thuật RAPD phân tích sự đa dạng gene của lươn nuôi (Monopterus albus) ở Trung Quốc
Bạn đang xem bản rút gọn của tài liệu. Xem và tải ngay bản đầy đủ của tài liệu tại đây (208.22 KB, 8 trang )
Asian Fisheries Science 19(2006):61-68
61
Asian Fisheries Society, Manila, Philippines
Available online at www.asianfisheriessociety.org
Genetic Diversity of Rice Field Eel (Monopterus albus) in
China Based on RAPD Analysis
RONG-BIAN WEI
1,2,3
, GAO-FENG QIU
1*
and RU SONG
2
1
College of Life Science,
Shanghai Fisheries University,
Shanghai 200090, P. R. China
2
College of Marine Science and Technology,
Zhejiang Ocean University,
Zhoushan, Zhejiang 316000, P. R. China
3
Present address: School of Life Sciences,
China Pharmaceutical University,
Nanjing, 210009, P. R.China
Abstract
The genetic diversity of seven populations of Monopterus albus from China, i.e., Yancheng, Mianyang,
Baoding, Suqian, Anshun, Shaoyang and Nanning, was studied based on RAPD analysis. Thirteen of 50 arbitrate
primers were screened to detect 122 polymorphic loci in 72 individuals. Shannon index, Nei’s gene diversity
coefficient and percentage of polymorphic loci analysis consistently indicated that Mianyang and Yancheng
populations displayed the largest diversity information, followed by Baoding, Suqian, Nanning, Anshun and
Shaoyang in order. The genetic variations were found partitioned mainly within rather than among populations,
as the latter accounted for only a small portion of variations (27.9% by AMOVA). Genetic differentiation
existed among all the populations (Gst = 0.1798), with a gene flow of 2.2813.The overall Shannon index and
Nei’s gene diversity index was 0.4991 and 0.3302 respectively. Inferred from genetic distance, a phylogenetic
dendrogram was also constructed by UPGMA method for the seven populations. Generally speaking, low
genetic diversity was shown for all these populations of M. albus in China mainland.
Introduction
Rice field eel, Monopterus albus, a Synbranchiformes freshwater fish usually inhab-
ited in subtropical and tropical areas in Asia, is widely cultivated across China in the past
decade. It is one of the most valuable freshwater fishes for export and domestic consumption
in China’s fishery industry. However, due to its idiosyncrasy of burrowing, air breathing and
sex reversal phenomenon during maturation, large-scale breeding and rearing for this fish are
still problematic. Yet, there has been considerable progress in the practice and study of M.
albus reproduction and artificial culture in China. Previous researches mainly focused on
*
Corresponding author. Tel.: +86 21 65710705, Fax: +86 21 65687210
E-mail address:
Asian Fisheries Science 19(2006):61-68
62
physiology, ecology, disease control, cellular and molecular genetics and environmental
toxicology of this species (
Tao et al. 1993; Liu et al. 2001; Lu et al. 2002; Xu and Su 2003).
To date, the study on the genetic resources of rice field eels has not been reported in a geo-
graphically broad scale in China mainland except for the comparison of genetic diversity
made by
He et al. (2004) among M. albus from China, M. cuchia from Burma, and M. fos-
sorius from Indonesia. The knowledge of genetic background of M. albus, in particular, the
genetic diversity and genetic differentiation over different regions across the nation is still
obscure and urgently required in the aquacultural industry. The objective of this research was
to examine the genetic relationships to assess the genetic diversity of M. albus from seven
geographically widely separated regions in China mainland based on randomly amplified
polymorphic DNA (RAPD), expecting to provide a preliminary data for resources conserva-
tion and selected breeding of this species.
Materials and Methods
Sample collection
Seventy-two wild individuals of M. albus were collected from the rice fields or marsh
at seven different sampling regions throughout China in 2002 (
Table 1).
The minimum body length was 13 cm and the maximum, 25 cm, with 18 cm in aver-
age. Muscle tissues were immediately preserved in 95% ethanol solution after biopsy, then
were brought back to laboratory and stored at 4℃ till use.
Table 1. Samples of Monopterus albus and their geographic sources
Population name Sample number, population habitat
environment abbreviation and code
Geographic source Longitude Latitude
Yancheng/ plain 13;YC, A
Dongtai County, Yancheng
City, Jiangsu Province
32º84’N 120º31’E
Mianyang/ plain 8; MY, B
An County, Mianyang City,
Sichuan Province
31º64’N 104º41’E
Baoding/ plain
12; BD, C
Gaoyang County, Baoding
City, Hebei Province
38º68’N 115º78’E
Suqian/ plain 10; SQ, D
Siyang County, Suqian City,
Jiangsu Province
33º73’N 118º68’E
Anshun/ moun-
tainous
9; AS, E
Puding County, Anshun City,
Guizhou Province
26º32’N 105º75’E
Shaoyang/
mountainous
10; SY, F
Dongkou County, Shaoyang
City, Hunan Province
27º06’N 110º57’E
Nanning/
mountainous
10; NN, G
Shanglin County, Nanning
City, Guangxi Province
23º44’N 108º59’E
DNA extraction
Between 100 and 150 mg muscle tissue was minced to fine powder, then transferred to
a 1.5 ml Eppendorff tube containing 500 µl lysis buffer (25µl 0.5mol•l
-1
Tris-HCl, pH8.0;
100µl 0.25mol•l
-1
ETDA; 50µl 20% SDS; 10µl 20mg•ml
-1
Proteinase K (Merck Inc.); 10µl
10mg•ml
-1
RNase; 305µl ddH2O), from which total DNA was extracted. The procedure of
DNA isolation and purification were referred to the previous method used in our lab (
Qiu and
Chang 2001
).
Asian Fisheries Science 19(2006):61-68
63
Polymerase chain reaction
Fifty random 10-mer primers (Sangon Co., Shanghai, China) of S
1
to S
50
were used to
amplify. The 25 µl PCR reaction mixture was composed of 10 mmol•l
-1
Tris-HCl pH9.0,
50mmol•l
-1
KCl, 2.0 mmol•l
-1
MgCl
2 ,
0.001% glutin,0.2 mmol•l
-1
dNTPs, 0.4 µmol•l
-1
arbitrate primers,50 ng genomic DNA, and 1.5 U Taq DNA polymerase (Biostar, Canada).
Amplification of DNA was performed in a thermal cycler (Eppendorf Mastercycler Gradient).
The program was set as: pre-denaturation at 97℃ for 10 min, followed by 40 cycles of 1 min
at 94℃; 1 min at 36℃; 1.5 min at 72℃, and a final cycle of 5 min at 72℃. Negative controls
without template DNA were run in each reaction.
Electrophoresis and photography
The PCR products were resolved by electrophoresis in 1.6% agarose gels (Sigma
Chemicals) for 2 h at 5 V.cm
-1
.A 100bp DNA ladder (BBST Co., Shanghai, China) was used
as size marker. After electrophoresis, gels were stained with ethidium bromide and photo-
graphed in a UV light transilluminator (Biostep imaging system, Jahnsdorf, Germany).
Data analysis
The patterns of the electrophoresis resulting from the RAPD PCR products were con-
verted into figure “1” or “0”, corresponding to where a clearly defined reproducible band was
present or absent. Then these 1, 0 data were fed to RAPDistance v1.04 (
Armstrong et al.
1996
) to calculate genetic similarity and genetic distance. Standard genetic distances were
estimated using Nei’s standard genetic distance (
Nei 1972) as implemented in the programs.
A phylogenetic dendrogram was constructed with unweighted pair group method using arith-
metic average (UPGMA) as integrated in MEGA 2.1(
Kumar et al. 2001).
The distance matrices were analyzed by WINAMOVA 155 (
Excoffier et al. 1992) to
define the sources of variation originated from within-population and between-population. To
test for significant level of the variations, 9999 permutations were conducted to obtain a P
value with φ statistics as implemented in the program.
Shannon index and Nei’s gene diversity index were employed to determine the overall
genetic diversity and the degree of genetic divergence among the populations (Gst) and mi-
gration number per generation (Nm). These calculations were made using POPGEN 32 (
Yeh
and Boyle 1997
).
Results
Amplification results of PCR
Thirteen of the 50 arbitrate primers were screened out, which can produce clearly re-
producible fragments, to detect 122 polymorphic loci in 72 individuals of seven populations.
The codes and sequences of these primers were: S11, 5’-gtagacccgt-3’; S17, 5’-agggaacgag-
3’; S22, 5’-tgccgagctg-3’; S28, 5’-gtgacgtagg-3’; S29, 5’-gggtaacgcc-3’; S3, 5’-catccccctg-3’;
S31, 5’-caatcgccgt-3’; S38, 5’-aggtgaccgt-3’; S4, 5’-ggactggagt-3’; S45, 5’-tgagcggaca-3’;
S6, 5’-tgctctgccc-3’; S7, 5’-ggtgacgcag-3’; and S8, 5’-gtccacacgg-3’.
The fragments amplified by a single primer in all the populations varied from seven to
13, with a molecular weight ranged from 300 bp to 4,000 bp. The percentage of polymorphic
Asian Fisheries Science 19(2006):61-68
64
loci differed in seven populations, with the largest 82.79% for populations Yancheng and
Mianyang, the smallest 29.51% existing in Shaoyang population (
Table 4).
Genetic distance and genetic similarity
Among all the population pairs of M. albus, the Nanning -Anshun pair recorded the
largest genetic distance of 0.6199 while the Baoding-Suqian pair showed the smallest of
0.0485, with a mean of 0.3505. Table 2 displayed the genetic distances and genetic similari-
ties between and within populations.
The genetic distances within populations scored the biggest for the Mianyang popula-
tion (0.5130) and the smallest for Anshun population (0.1524), averaging in 0.2811.
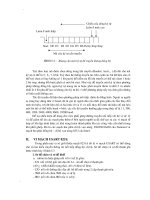
Phylogenetic tree
Phylogenetic dendrogram was generated based on Nei’s genetic distances for all popu-
lations, shown as in Fig. 1.
According to the graph, firstly, the Baoding population groups together with Suqian,
then converges with geographically proximate region, Yancheng, followed by clustering with
the two southwestern populations, Anshun and Mianyang, which finally gathers to the clades
of Shaoyang and Nanning, the two central south populations.
Genetic variation analyzed by AMOVA
The result of analysis of molecular variance was as indicated in Table 3.
This table illustrates the source of genetic variation. Variations were found be parti-
tioned mostly within (61.72%) rather than among populations, as the latter accounted for only
a small part of variations (27.90%). And the rest variation (10.38%) originated from among
regions, with an unbiased estimate value of 0.104 (P=0.0513).
Table 2. Genetic distances (Fst) and genetic similarities of M. albus among and within populations
YC MY BD SQ AS SY NN
YC 0.4139 0.8062 0.8924 0.8797 0.7762 0.6083 0.5522
MY 0.1938 0.5130 0.7182 0.6859 0.6272 0.6324 0.6007
BD 0.1076 0.2818 0.2503 0.9515 0.8601 0.5297 0.4617
SQ 0.1203 0.3141 0.0485 0.2284 0.8667 0.5000 0.4549
AS 0.2238 0.3728 0.1399 0.1333 0.1524 0.4407 0.3801
SY 0.3917 0.3676 0.4703 0.5000 0.5593 0.1782 0.4152
NN 0.4478 0.3993 0.5383 0.5451 0.6199 0.5848 0.2314
Notes: Lower triangle matrix are values of genetic distances between populations, upper triangle matrix are
values of genetic similarities, and values on diagonal are genetic distances within populations.
Table 3. Analysis of Molecular Variance (AMOVA ) for 72 individual M. albus of seven populations in three
regions, using 122 RAPD marker loci
Sources of variation df SSD MSD Variance
component
% Total φstatistics P-value
Among Regions 2 2.6126 1.306 0.02362732 10.38 φCT= 0.104 0.0513
Among Populations/regions 4 3.2098 0.802 0.06353478 27.90 φSC= 0.311 <0.0001
Among Individuals/ populations 65 9.1366 0.141 0.14056342 61.72 φST = 0.383 < 0.0001
Asian Fisheries Science 19(2006):61-68
65
Analyses of genetic diversity
Evaluation of genetic diversity was based
on levels of single population and all populations.
As can be seen in
Table 4, the greatest
Shannon index (I) occurred in Mianyang popula-
tion (0.4568), followed by Yancheng (0.4251),
Baoding (0.3515), Suqian (0.3028), Nanning
(0.2019) and Anshun (0.1946) in order. Shaoyang
population, which only scored 0.1551, was the
smallest one. With reference to Nei’s gene diver-
sity coefficient (h), the order was Mianyang
(0.3071), Yancheng (0.2811), Baoding (0.2352),
Suqian (0.2010), Nanning (0.1339), Anshun
(0.1287), and Shaoyang (0.1030). The results
analyzed by these two parameters were consistent with that by the percentages of polymor-
phic loci (PL%).
BD
SQ
YC
AS
MY
SY
NN
0.05
Fig. 1. Phylogenetic dendrogram constructed by
UPGMA method for seven popula-
tions of M. albus, indicating the scale
of branch length
Analysis for all of the seven populations of M. albus as a whole exhibited that the
overall Shannon index was 0.4991, Nei’s gene diversity, 0.3302, gene flow among popula-
tions, 2.2813, and genetic differentiation index (Gst), 0.1798 (
Table 5). These findings re-
vealed that there was a genetic differentiation, albeit low, for the M. albus populations
throughout China, and the genetic variations mainly came from individuals within populations
(82.02%), the remainder contributed by among populations (17.98%).
Table 4. Genetic variations for single population of M. albus
YC MY BD SQ AS SY NN
Sample size 13 8 12 10 9 10 10
h 0.2811 0.3071 0.2352 0.2010 0.1287 0.1030 0.1339
I 0.4251 0.4568 0.3515 0.3028 0.1946 0.1551 0.2019
PL% 82.79 82.79 66.39 57.38 37.70 29.51 38.52
Notes: cf. Table 5
Table 5. Nei's analysis of gene diversity in multi-populations as a whole
Sample size h I Ht Hs Gst Nm
72 0.3302 0.4991 0.3322 0.2725 0.1798 2.2813
Notes: h: Nei's gene diversity; I: Shannon's Information index; Ht: total gene diversity; Hs: gene diversity within
population; Gst: coefficient of gene differentiation; Nm: number of migration, the estimate of gene flow; PL%:
percentage of polymorphic loci.
Discussion
The results of this study present the genetic differences among geographically isolated
populations of M. albus based on RAPD data. In general, in terms of most genetic parameters,
the populations (Yancheng, Baoding, Suqian) from the maritime provinces (Jiangsu, Hebei,
Table 1) showed a relatively high value compared to their southwestern inland counterparts
(Anshun, Shaoyang and Nanning), with an exception of Mianyang, which locates within the
fertile Sichuan Plain. The possible reasons for this discrepancy will be discussed later in this
paper.