CÁC YẾU TỐ TÁC ĐỘNG ĐẾN GIÁ TRỊ THƯƠNG HIỆU CỦA CÁC DOANH NGHIỆP DƯỢC VIỆT NAM DƯỚI GÓC NHÌN CỦA NGƯỜI TIÊU DÙNG
Bạn đang xem bản rút gọn của tài liệu. Xem và tải ngay bản đầy đủ của tài liệu tại đây (829.62 KB, 13 trang )
<span class='text_page_counter'>(1)</span><div class='page_container' data-page=1>
145
<b>FACTORS AFFECTING CONSUMER-BASED BRAND EQUITY OF </b>
<b>VIETNAMESE PHARMACEUTICAL COMPANIES </b>
<b>Nguyen Cao Quynh Tu</b>
<b>a*</b><b>, Luu Tien Dung</b>
<b>b</b><i>a<sub>The Faculty of Pharmacy, Lac Hong University, Dongnai, Vietnam </sub></i>
<i>b<sub>The Faculty of Business Administration - International Economics, Lac Hong University, Dongnai, Vietnam</sub> </i>
<i>*<sub>Corresponding author: Email: </sub></i>
<b>Article history </b>
Received: March 10th<sub>, 2018 </sub>
Received in revised form: April 08th<sub>, 2018 | Accepted: May 02</sub>nd<sub>, 2018</sub>
<b>Abstract </b>
<i>The concept and importance of a company’s brand have always been widely acknowledged. </i>
<i>However, in modern Vietnam, many Vietnamese companies are still unaware of the importance </i>
<i>of building their brand. Particularly in the pharmaceutical industry where products are </i>
<i>directly related to human health, buying products of famous pharmaceutical brands to help </i>
<i>ensure the lowest risk is gradually becoming a habit of consumers. The purpose of this paper is </i>
<i>to find out factors affecting consumer-based brand equity of Vietnamese pharmaceutical </i>
<i>companies. The study provides a conceptual framework in which brand awareness, brand </i>
<i>associations, perceived quality and brand loyalty are related to brand equity. The survey was </i>
<i>conducted on a sample of 328 customers at pharmacies and hospitals in Vietnam who have </i>
<i>basic knowledge on some of Vietnamese pharmaceutical companies’ brands. The research </i>
<i>instruments included an 18-item questionnaire on brand equity, plus demographic questions. </i>
<i>Results show that there are four factors affecting the brand equity of Vietnamese </i>
<i>pharmaceutical companies, including brand awareness, brand associations, perceived quality, </i>
<i>brand loyalty and the correlation between them. </i>
<b>Keywords</b>: Brand associations; Brand awareness; Brand equity; Brand loyalty; Perceived
quality; Pharmaceutical companies.
Article identifier:
Article type: (peer-reviewed) Full-length research article
Copyright © 2018 The authors.
</div>
<span class='text_page_counter'>(2)</span><div class='page_container' data-page=2>
146
<b>CÁC YẾU TỐ TÁC ĐỘNG ĐẾN GIÁ TRỊ THƯƠNG HIỆU CỦA CÁC </b>
<b>DOANH NGHIỆP DƯỢC VIỆT NAM DƯỚI GĨC NHÌN CỦA </b>
<b>NGƯỜI TIÊU DÙNG </b>
<b>Nguyễn Cao Quỳnh Túa*<sub>, Lưu Tiến Dũng</sub>b</b>
<i>a<sub>Khoa Dược, Trường Đại học Lạc Hồng, Đồng Nai, Việt Nam </sub></i>
<i>b<sub>Khoa Quản trị Kinh doanh - Kinh tế Quốc tế, Trường Đại học Lạc Hồng, Đồng Nai, Việt Nam</sub> </i>
<i>*<sub>Tác giả liên hệ: Email: </sub></i>
<b>Lịch sử bài báo </b>
Nhận ngày 10 tháng 03 năm 2018
Chỉnh sửa ngày 08 tháng 04 năm 2018 | Chấp nhận đăng ngày 02 tháng 05 năm 2018
<b>Tóm tắt </b>
<i>Khái niệm và tầm quan trọng của thương hiệu doanh nghiệp luôn được công nhận rộng rãi. </i>
<i>Tuy nhiên, hiện nay, nhiều doanh nghiệp Việt Nam vẫn không ý thức được về tầm quan trọng </i>
<i>của việc xây dựng thương hiệu, đặc biệt trong ngành dược phẩm nơi mà sản phẩm có liên quan </i>
<i>trực tiếp đến sức khoẻ con người, thì việc mua sản phẩm của các thương hiệu dược nổi tiếng </i>
<i>giúp đảm bảo nguy cơ thấp nhất đang dần trở thành thói quen của người tiêu dùng. Mục đích </i>
<i>của bài báo này là tìm ra các yếu tố tác động đến giá trị thương hiệu dựa trên người tiêu dùng </i>
<i>của các doanh nghiệp dược phẩm Việt Nam. Nghiên cứu cung cấp khn khổ khái niệm trong </i>
<i>đó nhận thức thương hiệu, liên tưởng thương hiệu, chất lượng cảm nhận và lòng trung thành </i>
<i>của thương hiệu có liên quan đến giá trị thương hiệu. Cuộc khảo sát được thực hiện trên 328 </i>
<i>khách hàng tại các nhà thuốc và bệnh viện ở Việt Nam có kiến thức cơ bản về thương hiệu của </i>
<i>các doanh nghiệp dược phẩm Việt Nam. Công cụ nghiên cứu bao gồm 18 mục hỏi về giá trị </i>
<i>thương hiệu, cộng với việc khảo sát nhân khẩu học. Kết quả tìm ra bốn yếu tố tác động đến giá </i>
<i>trị thương hiệu của các doanh nghiệp dược phẩm Việt Nam, bao gồm nhận thức thương hiệu, </i>
<i>liên tưởng thương hiệu, chất lượng cảm nhận, lòng trung thành thương hiệu và sự tương quan </i>
<i>giữa chúng. </i>
<b>Từ khóa: </b>Chất lượng cảm nhận; Doanh nghiệp dược phẩm; Giá trị thương hiệu; Liên tưởng
thương hiệu; Lòng trung thành thương hiệu; Nhận thức thương hiệu.
Mã số định danh bài báo:
Loại bài báo: Bài báo nghiên cứu gốc có bình duyệt
Bản quyền © 2018 Các tác giả.
</div>
<span class='text_page_counter'>(3)</span><div class='page_container' data-page=3>
147
<b>1. </b> <b>INTRODUCTION </b>
Vietnam's pharmaceutical market is considered an attractive market for investors,
with the top growth rate in Southeast Asia. According to Business Monitor International
(2018), in 2016, Vietnamese pharmaceutical market expenditure was estimated to reach
$4.7 billion, an increase of 12% over the previous year and is expected to increase to about
$7.7 billion by 2021. As a result, Vietnam is a deeply decentralized and fragmented market
with over 1,000 drugs wholesalers or distributors, leading to a fiercer competition in the
industry (Business Sweden, 2015). In the context of competition where consumers have
many choices, brands become the means to help consumers identify the differences and
choose the best option. Therefore, if a pharmaceutical company would like to grow and
survive, it is necessary to focus on building its brand. However, there are still many other
pharmaceutical companies that do not pay attention to building a distinct brand name. They
are unaware that brands can decide the success of a company in long-term development.
Christodoulides, Cadogan, and Veloutsou (2015) asserted that we need to generate a better
understanding of the composition of brand equity to understand how to manage brand
equity.
Brand equity was first mentioned by Farquhar (1989) as the 'added value' of a
product. Then there are many other studies on brand equity in the world. Typically, there
are researches conducted by Aaker (1991); Musekiwa, Chiguvi, and Hogo (2013); Wang
and Finn (2013); and Yoo, Donthu, and Lee (2000). Aaker (1991) provided the theory of
brand equity and its components as the basis for building and developing a brand. Yoo et
al. (2000) conducted an examination of selected marketing mix elements and brand equity
on three product categories, that is, athletic shoes, camera film, and color television sets.
Wang and Finn (2013) studied heterogeneous sources of customer-based brand equity
within a product category (i.e. soft drinks). Musekiwa et al. (2013) carried out a study to
determine the nature of the relationship between retail brand equity dimensions and retail
brand equity for OK supermarket in Bindura. In Vietnam, there have also been many
studies on brand equity. Ngo, Nguyen, and Dinh (2014) searched components of brand
equity in the case of Binhthuan dragon fruit. Hoang (2016) examined the impact of
advertising and promotion on brand equity of the FMCG supermarket industry in Hue.
However, so far there has been no firm official research on brand equity of Vietnamese
pharmaceutical companies. Recognizing the urgency of this issue, the study conducted a
survey on the factors affecting brand equity of Vietnamese pharmaceutical companies.
The objectives of this study were to determine the factors affecting the brand equity
of Vietnamese pharmaceutical companies, as well as to explore the consumer-based brand
equity practice scale, and propose some recommendations for brand-building for
pharmaceutical companies in Vietnam. The research was based on Aaker's brand equity
model in 1991 and was adapted to fit the characteristics of the pharmaceutical industry.
The article consists of five parts, including (1) Introduction; (2) Literature review; (3)
Methodology; (4) Results and discussions; and (5) Conclusions.
<b>2. </b> <b>LITERATURE REVIEW </b>
</div>
<span class='text_page_counter'>(4)</span><div class='page_container' data-page=4>
148
research, consumer-based brand equity valuation is supported by more scholars because
brand equity is the result of consumers' perception of that brand (Vázquez, Del Rio, &
Iglesias, 2002; Wang & Finn, 2013; Yoo et al., 2000). Therefore, this study mostly
discusses brand equity from a consumer perspective.
Customer-based brand equity is defined as the disparate impact of brand knowledge
on consumer response to the marketing of the brand (Keller, 1993). According to Aaker
(1991), brand equity is a class of assets and liabilities connected to the brand name and
brand symbol that add to or subtract the value of a product or service to a firm and its
customers. It also can be defined as the marketing and financial value linked to a brand’s
place in the marketplace (Ferrell & Hartline, 2011) or the overall utility that the consumer
connects to the utilization of the brand about both functional and symbolic utilities
(Vázquez et al., 2002).
There are many models of brand equity being offered such as the models by Aaker
(1991); Wang and Finn (2013); and Yoo et al. (2000). Aaker (1991) said that brand equity
can be grouped into five categories: Brand loyalty; Name awareness; Perceived quality;
Brand associations; and other proprietary brand assets. Yoo et al. (2000) proposed brand
equity measured by the interaction of factors including perceived quality, brand loyalty and
brand awareness/associations. Wang and Finn (2013) suggested seven dimensions of brand
equity: Past brand loyalty; Current brand awareness; Current perceived quality; Current
perceived value for the cost; Current brand associations; Uniqueness; and Brand emotions.
This study is based on David Aaker's model, which has been tested on a variety of
products by many scientists (Atilgan, Aksoy, & Akinci, 2005; Christodoulides et al., 2015;
Musekiwa et al., 2013; Pappu, Quester, & Cooksey, 2005) and is considered one of the
most generalized brand equity measurement models. In addition, the experts, pharmacists,
doctors interviewed by the authors also suggested that Aaker's model is suitable for
research on the pharmaceutical market. However, the fifth factor (i.e. other proprietary
brand assets) is almost not mentioned later in the studies of other authors (Keller, 1993;
Wang & Finn, 2013; & Yoo et al., 2000) because this factor is not really associated with
consumers and marketing. Accordingly, the authors suggest four factors affecting brand
equity: Brand awareness; Brand associations; Perceived quality; and Brand loyalty.
<b>2.1. </b> <b>Brand awareness </b>
</div>
<span class='text_page_counter'>(5)</span><div class='page_container' data-page=5>
149
Keller, 1993; Musekiwa et al., 2013; Panchal et al., 2012; Pappu et al., 2005; Wang &
Finn, 2013; Yoo et al., 2000). Therefore, the first hypothesis would be:
H1: Brand awareness has a positive impact on brand equity.
<b>2.2. </b> <b>Brand associations </b>
Aaker (1991) defined brand associations are anything connect to the memory of
customers to a brand. Brand associations can be divided into product associations and
organizational associations. Product associations can consist of quality, price, and usage;
organizational associations would contain corporate ability and corporate social onus
(Musekiwa et al., 2013). Chen (2001) and Yoo et al. (2000) argued that brand association
is one of the core elements of a brand. Customers will think of one or a few features of a
particular brand when the brand is mentioned. Brand associations create equity for the
company and its customers by providing information, create positive attitudes and
emotions, provide the reason to buy the product, differentiating and positioning the brand.
Atilgan et al. (2005) discovered that associations create a base for purchase decisions and
value to the firm and customers. Consumers use brand name to surmise quality of an
unfamiliar product because a brand name has been built based on its associations with
quality, value or utility of its products (Lassar, Mittal, & Sharma, 1995). Río, Vázquez, and
Iglesias (2001) proposed that consumers' brand associations are a crucial element in brand
equity origination and management. Previous studies showed that brand associations are
directly related to brand equity (Chen, 2001; Keller, 1993; Musekiwa et al., 2013; Pappu et
al., 2005; Wang & Finn, 2013; Yoo et al., 2000). Therefore, the authors suggest the
following hypothesis:
H2: Brand associations have a positive impact on brand equity.
<b>2.3. </b> <b>Perceived quality </b>
Keller (2013) defined that perceived quality is customers’ recognition of the overall
quality or prominence of a service or product compared to alternatives. Perceived quality is
different from the objective or actual quality of the product (Zeithaml, 1988). Perceived
quality is a perception by customers. It thus differs from actual or objective quality – the
extent to which the product or service delivers superior service. Perceived quality will
directly influence purchasing decisions and brand loyalty. Customers often choose brands
with higher perceived quality (Yoo et al., 2000). Many previous studies showed that
perceived quality is positively related to brand equity (Aaker, 1991; Atilgan et al., 2005;
Musekiwa et al., 2013; Nguyen, Barrett, & Miller, 2011; Pappu et al., 2005; Sanyal &
Datta, 2011; Wang & Finn, 2013; & Yoo et al., 2000). So, the following hypothesis is
given:
H3: Perceived quality has a positive impact on brand equity.
<b>2.4. </b> <b>Brand loyalty </b>
</div>
<span class='text_page_counter'>(6)</span><div class='page_container' data-page=6>
150
switching to another brand; therefore, brand equity will increase (Yoo et al., 2000). The
existence of loyal customers also diminishes opportunities for competitors, frustrating
them in finding ways to entice customers because of the high cost but low efficiency.
During the growth stage, the overall strategy changes from acquisition to retention and
building brand loyalty (Ferrell & Hartline, 2011). Strong brands are always identified and
guaranteed by loyal customers. At the same time, finding a new customer will be far
costlier than maintaining old customers. In addition, loyal customers give the company a
huge benefit by introducing its products to other customers. Researchers have concluded
that brand loyalty has a significant positive effect on brand equity (Atilgan et al., 2005;
Fatema, Azad, & Masum, 2015; Musekiwa et al., 2013; Pappu et al., 2005; Wang & Finn,
2013; & Yoo et al., 2000). Therefore, the authors propose the final hypothesis:
H4: Brand loyalty has a positive impact on brand equity.
<b>3. </b> <b>METHODOLOGY </b>
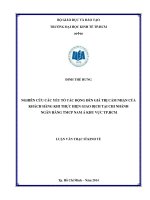
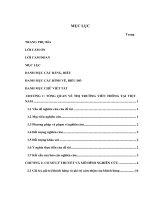
Structural equation modelling (SEM) was used to estimate parameters (Figure 1).
There are 18 items in brand equity measures shown in the path diagram; There are four
variables were available for brand awareness (AW1, AW2, AW3 and AW4), four variables
for brand associations (AS1, AS2, AS3 and AS4), four variables for perceived quality
(PQ1, PQ2, PQ3 and PQ4), three variables for brand loyalty (LO1, LO2 and LO3) and
three variables for brand equity (BE1, BE2 and BE3). In addition, the questionnaire also
used a rating scale to measure the variables of the personal information such as gender,
age, income level. All items are measured by 5-point Likert scales, which were 5) strongly
agree, 4) agree, 3) not sure, 2) disagree, and 1) strongly disagree.
</div>
<span class='text_page_counter'>(7)</span><div class='page_container' data-page=7>
151
Hair, Black, Babin, and Anderson (2010) confirmed that the sample size must be at
least 100 in order to use the Exploratory Factor Analysis (EFA). Besides, in Confirmatory
Factor Analysis (CFA) and SEM, Anderson and Gerbing (1988) suggested a sample size of
at least 150 to obtain parameter estimates of practical use. Bentler and Chou (1987)
proposed that the ratio of sample size to the number of free parameters may be 5:1 under
the normal theory, especially when there are many indicators of latent variables. According
to Tabachnick and Fidell (2013), 300 cases or more provide a good sample size for factor
analysis.
In this study, the authors use a total of 328 customers selected by non-probability
sampling methods (i.e. convenience sampling technique) at some large hospitals,
pharmacies in Hochiminh City and Dongnai province. The demographic collection below
has shown the diversity of the sample (Table 1).
<b>Table 1. Demographic characteristics of respondents </b>
Variable Description Frequency
Count Percentage
Gender Male 141 43.0
Female 187 57.0
Age (years) Below 25 139 42.4
25-50 149 45.4
Above 50 40 12.2
Monthly income range (VND) Below 5 million 97 29.6
5-20 million 163 49.7
Above 20 million 68 20.7
<b>4. </b> <b>RESULTS AND DISCUSSIONS </b>
<b>4.1. </b> <b>Reliability and validity </b>
As can be seen from Table 2, the lowest alpha value is 0.756. This shows a
coefficient exceeding the cut of the value of 0.7 as recommended by Nunnally and
Bernstein (1994). Convergent validity is verified when scores from various instruments
used to measure the same construct are strongly correlated (O'Rourke & Hatcher, 2013).
Convergent validity was estimated by factor loading. The value of Kaiser-Mayer-Olkin
(KMO) was 0.853 (between 0.5 and 1.0) which means that data is suitable for conducting a
factor analysis. All loadings are higher than the 0.50 (Table 2). According to Hair et al.
(2010), loadings ±.50 or greater are considered practically significant. The authors also ran
confirmatory factor analysis (CFA) to further test composite reliability and convergent
validity. The lowest composite reliability (CR) is 0.763, exceeding the cut-off point 0.7
(Fornell & Larcker, 1981). The AVE for each construct is at 0.520 or higher, exceeding the
0.5 benchmark (Fornell & Larcker, 1981). So, composite reliability and convergent
validity are demonstrated by the CFA results as well.
</div>
<span class='text_page_counter'>(8)</span><div class='page_container' data-page=8>
152
any the square of correlation among any pair of latent ones (Fornell & Larcker, 1981). So,
with the result of AVE in Table 2 and the correlations between the factors in Table 3, the
discriminant validity of this model is also good. The results of the CFA (Table 4)
confirmed that the hypothesized model provides a good fit to the data.
<b>Table 2. Results of factor analysis and reliability tests </b>
Items Question Factor loading
<b>Brand awareness (Cronbach's Alpha = 0.803; CR = 0.813; AVE = 0.523) </b>
AW1 I am aware of X. 0.712
AW2 I can quickly recall the symbol, logo or slogan of X. 0.769
AW3 I can recognize X among other competing brands. 0.776
AW4 I can recognize X by dominant colors. 0.627
<b>Brand associations (Cronbach's Alpha = 0.849; CR = 0.838; AVE = 0.574) </b>
AS1 I trust X. 0.545
AS2 Some characteristics of this brand come to my mind quickly. 0.617
AS3 This brand has unique associations. 0.905
AS4 X is a market leader brand. 0.895
<b>Perceived quality (Cronbach's Alpha = 0.848; CR = 0.841; AVE = 0.571) </b>
PQ1 Buying X was a really good decision. 0.859
PQ2 X is the well-known brand. 0.692
PQ3 X’s products are of high quality. 0.773
PQ4 Price for X is reasonable. 0.684
<b>Brand loyalty (Cronbach's Alpha = 0.756; CR = 0.763; AVE = 0.520) </b>
LO1 X would be my first choice. 0.734
LO2 I will be willing to pay more for X’s products. 0.642
LO3 I will not buy other brands if X is available at the store. 0.780
<b>Brand equity (Cronbach's Alpha = 0.880; CR = 0.857; AVE = 0.667) </b>
BE1 If another brand is not different from X in any way, it seems smarter to
purchase X. 0.831
BE2 Even if another brand has the same features as X, I would prefer to buy X. 0.760
BE3 If there is another brand as good as X, I prefer to buy X. 0.855
<b>Table 3. Correlation matrix </b>
Brand
awareness
Brand
associations
Perceived
quality
Brand
loyalty
</div>
<span class='text_page_counter'>(9)</span><div class='page_container' data-page=9>
153
<b>Table 4. CFA's results </b>
Chi-square Df Chi-square/df GFI TLI CFI RMSEA
303.688 124 2.449 0.911 0.932 0.945 0.067
Suggested cut-off values ≤ 3 > 0.7 < 0.1
Source: Segars and Grover (1993); Bentler and Chou (1987); MacCallum, Browne, and Sugawara (1996);
and Segars and Grover (1993).
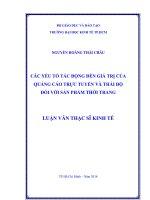
SEM's results showed that Chi-square (CMIN) = 303.688 and degrees of freedom
(df) = 124, CMIN/df = 2.449 < 3 (Segars & Grover, 1993). Root mean square error of
approximation (RMSEA) = 0.067 (< 0.1) is also indicated an acceptable level of fit for the
model (MacCallum et al., 1996; Segars & Grover, 1993). Besides that, goodness-of-fit
index (GFI) = 0.911, Tucker Lewis index (TLI) = 0.932 and comparative fit index (CFI) =
0.945 are higher than the cut-off value of 0.7 (Bentler & Chou, 1987) suggested that the
model fits the data well (Figure 2).
</div>
<span class='text_page_counter'>(10)</span><div class='page_container' data-page=10>
154
<b>4.2. </b> <b>Hypothesis testing </b>
Critical ratio (C.R.) and P were used to test the significance of hypotheses. C.R.
should be greater than 1.96 based on the significance level of 0.05. Those values under
1.96 are not considered to be an important parameter in the model. Table 5 shows the
regression coefficients and values of C.R. and P associated with each hypothesis.
<b>Table 5. Hypothesis testing results </b>
Hypotheses Path Regression
coefficients C.R P Result
H1 Brand awareness Brand equity 0.215 4.582 0.000 Supported
H2 Brand associations Brand equity 0.094 2.467 0.014 Supported
H3 Perceived quality Brand equity 0.603 7.059 0.000 Supported
H4 Brand loyalty Brand equity 0.325 5.068 0.000 Supported
As reported in Table 5, brand awareness has effects on brand equity with a path
coefficient of 0.215. Brand associations have effects on brand equity with a path
coefficient of 0.094. Perceived quality has effects on brand equity with a path coefficient
of 0.603. Finally, brand loyalty has effects on brand equity with a path coefficient of 0.325.
So, all the four hypotheses are supported.
All the four hypotheses were supported in this study (Table 5). As a result, brand
awareness, brand associations, perceived quality and brand loyalty have a positive impact
on brand equity, especially the strong impact of perceived quality on brand equity. The
reason is that pharmaceutical products are directly related to human health, and customers
will choose a pharmaceutical brand when they feel the quality of the products is good. This
conclusion is complement to previous studies by other authors. Pharmaceutical companies
can change their strategy according to the results to increase the factors that help improve
their brand equity. The regression indicates that an increase in any one of the dimensions
will be followed by an increase in brand equity (see Table 5). Under conditions of limited
resources, a company can focus on perceived quality and brand loyalty – the most efficient
way of improving brand equity. However, it is important to note that the best results of an
increase in brand equity require an increase in all factors. The results also show a
correlation between the factors, especially there are two strong correlations (i.e. brand
associations and perceived quality; brand loyalty and perceived quality) (Table 3). Some
studies of previous authors had similar results (Dlacic & Kezman, 2014; Nguyen et al.,
2011; Pappu et al., 2005; & Yoo et al., 2000).
</div>
<span class='text_page_counter'>(11)</span><div class='page_container' data-page=11>
155
<b>5. </b> <b>CONCLUSIONS AND RECOMMENDATIONS </b>
The research results show that there are four factors affecting consumer-based
brand equity of Vietnamese pharmaceutical companies: Brand awareness; Brand
associations; Perceived quality; and Brand loyalty. The impact level is as follows:
Perceived quality > Brand loyalty > Brand awareness > Brand associations. In this study,
the authors also found a high correlation amongst these two determinants of brand equity
(i.e. perceived quality and brand loyalty).
The study demonstrates Vietnamese pharmaceutical companies’ composition of
brand equity, and complements previous studies of other authors. However, due to limited
time and resources, the research was conducted on only a small scale. Future studies will
be continued on a larger scale and with more generalization. Policies to improve brand
equity are suggested through the following factors:
<i>Perceived quality factor</i>: To increase perceived quality, the company must
invest in product innovations, change the product’s shape and packing
methods, researching and developing products to create products of higher
quality than other pharmaceutical brands’. Besides, they need to provide
high-quality customer services and conduct utilize valuation methods to offer the
best price and maintain a competitive edge over other brands.
<i>Brand loyalty factor</i>: Brand loyalty can be improved by setting a reasonable
commission rate, paying attention to promotions to stimulate the market and
offering gifts on holidays and anniversaries for distributors, wholesalers, etc.
<i>Brand awareness factor</i>: There are many ways to improve brand awareness.
The authors suggest the following ways: creating different brands, each being
connected to the parent brand, creating products of different and unique colors
and designs, increasing the use of leaflets on pharmaceutical products in
pharmacies and hospitals, offering free gifts-with-purchase with the
company’s logo, such as pens, raincoats, etc and utilizing emails and messages
to send notifications to target customers.
<i>Brand associations factor</i>: The company should increase the frequency of
appearing in the media by advertising or interviewing and inviting celebrities
to serve as brand ambassadors to represent the company or products.
<b>REFERENCES </b>
Aaker, D. A. (1991). <i>Managing brand equity: Capitalizing on the value of a brand name</i>.
New York, USA: The Free Press.
Aaker, D. A. (1996). <i>Building strong brands</i>. New York, USA: The Free Press.
Anderson, J. C., & Gerbing, D. W. (1988). Structural equation modeling in practice: A
review and recommended two-step approach. <i>Psychological Bulletin, 103</i>(3),
411-423.
Atilgan, E., Aksoy, Ş., & Akinci, S. (2005). Determinants of the brand equity: A
</div>
<span class='text_page_counter'>(12)</span><div class='page_container' data-page=12>
156
<i>Planning, 23</i>(3), 237-248.
Bentler, P. M., & Chou, C. P. (1987). Practical issues in structural modeling. <i>Sociological </i>
<i>Methods & Research, 16</i>(1), 78-117.
Business Monitor International. (2018). <i>Vietnamp pharmaceuticals and healthcare report</i>.
London, UK: Business Monitor International Research.
Business Sweden. (2015). <i>Opportunities in Vietnam’s healthcare sector. </i>Hanoi, Vietnam:
Business Sweden in Vietnam.
Chen, A. C. H. (2001). Using free association to examine the relationship between the
characteristics of brand associations and brand equity. <i>Journal of Product & Brand </i>
<i>Management, 10</i>(7), 439-451.
Christodoulides, G., Cadogan, J. W., & Veloutsou, C. (2015). Consumer-based brand
equity measurement: Lessons learned from an international study. <i>International </i>
<i>Marketing Review, 32</i>(3/4), 307-328.
Dlacic, J., & Kezman, E. (2014). Exploring relationship between brand equity and
customer loyalty on pharmaceutical market. <i>Economic and Business Review for </i>
<i>Central and South-Eastern Europe, 16</i>(2), 121-131.
Farquhar, P. H. (1989). Managing brand equity. <i>Marketing Research, 1</i>(3), 24-33.
Fatema, M., Azad, M. A. K., & Masum, A. K. M. (2015). Impact of brand image and brand
loyalty in measuring brand equity of Islami Bank Bangladesh Ltd. <i>Asian Business </i>
<i>Review, 2</i>(1), 42-46.
Ferrell, O. C., & Hartline, M. (2011). <i>Marketing strategy</i> (5th ed.). Mason, USA:
South-Western Cengage Learning.
Fornell, C., & Larcker, D. F. (1981). Evaluating structural equation models with
unobservable variables and measurement error. <i>Journal of Marketing Research, </i>
<i>18</i>(1), 39-50.
Hair, J. F., Black, W. C., Babin, B. J., & Anderson, R. E. (2010). <i>Multivariate data </i>
<i>analysis</i> (7th ed.). New Jersey, USA: Pearson Prentice Hall.
Hoang, T. A. T. (2016). The impact of advertising and promotion on brand equity: The
case of the FMCG supermarket industry in Hue. <i>VNU Journal of Science: </i>
<i>Economics and Business, 32</i>(4), 49-58.
Keller, K. L. (1993). Conceptualizing, measuring, and managing customer-based brand
equity. <i>Journal of Marketing, 57</i>(1), 1-22.
Keller, K. L. (2013). <i>Strategic brand management: Building, measuring, and managing </i>
<i>brand equity</i> (4th ed.). New Jersey, USA: Pearson Prentice Hall.
Lassar, W., Mittal, B., & Sharma, A. (1995). Measuring customer-based brand equity.
<i>Journal of Consumer Marketing, 12</i>(4), 11-19.
MacCallum, R. C., Browne, M. W., & Sugawara, H. M. (1996). Power analysis and
determination of sample size for covariance structure modeling. <i>Psychological </i>
</div>
<span class='text_page_counter'>(13)</span><div class='page_container' data-page=13>
157
Musekiwa, A., Chiguvi, D., & Hogo, H. (2013). Customer-based retail brand equity (RBE)
dimensions effect on retail brand equity for OK supermarket in Bindura.
<i>International Journal of Business and Management, 8</i>(19), 45-52.
Nunnally, J. C., & Bernstein, I. H. (1994). <i>Psychometric theory</i> (3rd ed.). New York, USA:
McGraw-Hill.
Ngo, T. N. H., Nguyen, V. B., & Dinh, T. M. (2014). Components of brand equity: The
case of Binhthuan dragon fruit. <i>Journal of Economic Development, </i>(222), 142-160.
Nguyen, T. D., Barrett, N. J., & Miller, K. E. (2011). Brand loyalty in emerging markets.
<i>Marketing Intelligence & Planning, 29</i>(3), 222-232.
O'Rourke, N., & Hatcher, L. (2013). <i>A step-by-step approach to using SAS for factor </i>
<i>analysis and structural equation modeling</i> (2nd ed.). North Carolina, USA: SAS
Institute.
Oliver, R. L. (1999). Whence consumer loyalty? <i>The Journal of Marketing, 63</i>(special),
33-44.
Panchal, S. K., Khan, B. M., & Ramesh, S. (2012). Importance of ‘brand loyalty, brand
awareness and perceived quality parameters’ in building brand equity in the Indian
pharmaceutical industry. <i>Journal of Medical Marketing, 12</i>(2), 81-92.
Pappu, R., Quester, P. G., & Cooksey, R. W. (2005). Consumer-based brand equity:
Improving the measurement - empirical evidence. <i>Journal of Product & Brand </i>
<i>Management, 14</i>(3), 143-154.
Río, A. B. D., Vázquez, R., & Iglesias, V. (2001). The effects of brand associations on
consumer response. <i>Journal of Consumer Marketing, 18</i>(5), 410-425.
Sanyal, S. N., & Datta, S. K. (2011). The effect of perceived quality on brand equity: An
empirical study on generic drugs. <i>Asia Pacific Journal of Marketing and Logistics, </i>
<i>23</i>(5), 604-625.
Segars, A. H., & Grover, V. (1993). Re-examining perceived ease of use and usefulness: A
confirmatory factor analysis. <i>MIS Quarterly, 17</i>(4), 517-525.
Tabachnick, B. G., & Fidell, L. S. (2013). <i>Using multivariate statistics</i> (6th<sub> ed.). New </sub>
Jersey, USA: Pearson Prentice Hall.
Vázquez, R., Del Rio, A. B., & Iglesias, V. (2002). Consumer-based brand equity:
Development and validation of a measurement instrument. <i>Journal of Marketing </i>
<i>Management, 18</i>(1-2), 27-48.
Wang, L., & Finn, A. (2013). Heterogeneous sources of customer-based brand equity
within a product category. <i>Marketing Intelligence & Planning, 31</i>(6), 674-696.
Yoo, B., Donthu, N., & Lee, S. (2000). An examination of selected marketing mix
elements and brand equity. <i>Journal of the Academy of Marketing Science, 28</i>(2),
195-211.
Zeithaml, V. A. (1988). Consumer perceptions of price, quality, and value: A means-end
</div>
<!--links-->
Các yếu tố tác động đến giá trị nợ
- 32
- 783
- 6


.push({});</script> </div> </div> </div> <div class="vf_link_relate px-2 my-2"> <h2 class="vf_doc_relate text-2xl font-bold my-4">Tài liệu liên quan</h2> <ul class="grid grid-cols-12 gap-2"> <li class="col-span-6 md:col-span-2"> <div class="card-doc " onclick="actionDocRelated(this)"> <a class="card-doc-img" href="https://text.123docz.net/document/893265-cac-yeu-to-tac-dong-den-gia-tri-no.htm" title="Các yếu tố tác động đến giá trị nợ "> <i class="icon i_type_doc i_type_doc2"></i> <img class="lazy" src="data:image/gif;base64,R0lGODlhAQABAIAAAP///wAAACH5BAEAAAAALAAAAAABAAEAAAICRAEAOw==" data-src="https://media.store123doc.com/images/document/13/ce/al/medium_ale1387340530.jpg" width="124" height="179" alt="Các yếu tố tác động đến giá trị nợ " onerror="this.src=)