Niên giám thống kê tỉnh bình định 2017 binh dinh statistical yearbook 2017
Bạn đang xem bản rút gọn của tài liệu. Xem và tải ngay bản đầy đủ của tài liệu tại đây (3.53 MB, 638 trang )
NIÊN GIÁM THỐNG KÊ TỈNH BÌNH ĐỊNH 2017
1
Chỉ đạo biên soạn:
NGUYỄN THỊ MỸ
QUYỀN CỤC TRƯỞNG CỤC THỐNG KÊ TỈNH BÌNH ĐỊNH
Tham gia biên soạn:
PHỊNG THỐNG KÊ TỔNG HỢP
PHỊNG THỐNG KÊ NƠNG NGHIỆP
PHỊNG THỐNG KÊ CƠNG NGHIỆP - XÂY DỰNG
PHÒNG THỐNG KÊ THƯƠNG MẠI
PHÒNG THỐNG KÊ DÂN SỐ - VĂN XÃ
2
LỜI NÓI ĐẦU
Để đáp ứng yêu cầu nghiên cứu của các tổ chức và cá nhân về tình hình
kinh tế - xã hội trên địa bàn tỉnh, Cục Thống kê tỉnh Bình Định biên soạn và
xuất bản cuốn “Niên giám Thống kê tỉnh Bình Định năm 2017”.
Nội dung Niên giám bao gồm số liệu chính thức các năm 2010, 2014,
2015, 2016 và sơ bộ năm 2017.
Các ký hiệu nghiệp vụ cần lưu ý:
...
: Khơng có hiện tượng phát sinh.
: Có phát sinh nhưng không thu thập được.
Cục Thống kê tỉnh Bình Định chân thành cảm ơn những ý kiến đóng
góp của bạn đọc đối với các lần xuất bản trước và mong tiếp tục nhận được
nhiều ý kiến xây dựng để Niên giám Thống kê tỉnh Bình Định ngày càng
đáp ứng tốt hơn yêu cầu của người sử dụng thông tin.
CỤC THỐNG KÊ TỈNH BÌNH ĐỊNH
3
FOREWORD
Binh Dinh Statistics Office compiles and publishes the book “Binh
Dinh Statistical Yearbook 2017” in order to meet the requirements of the
data users in Binh Dinh to study and research on the socio-economic
situation of Binh Dinh province.
This yearbook consists of the official data for the years 2010, 2014,
2015, 2016 and preliminary 2017.
Special symbols used in the book are:
- : No facts occurred.
… : Facts occurred but no information.
Binh Dinh Statistics Office would like to express its sincere thanks to
all readers for their comments and feedbacks on the previous publications
and wishes to receive more suggestions in order that the Statistical
Yearbook of Binh Dinh will be improved and better satisfy the demands of
the information users.
BINH DINH STATISTICS OFFICE
4
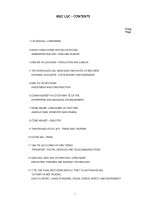
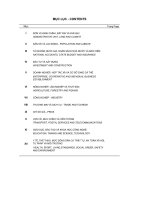
MỤC LỤC - CONTENT
Trang
Page
Lời nói đầu
Foreword
3
4
Tổng quan kinh tế - xã hội tỉnh Bình Định năm 2017
Overview on socio-economic situation in Bình Định province in 2017
7
13
Đơn vị hành chính, Đất đai và Khí hậu
Administrative unit, Land and Climate
19
Dân số và Lao động - Population and Labour
37
Tài khoản quốc gia, Ngân sách Nhà nước và Bảo hiểm
National accounts, State budget and Insurance
93
Đầu tư và Xây dựng - Investment and Construction
127
Doanh nghiệp, Hợp tác xã và Cơ sở sản xuất kinh doanh cá thể
Enterprise, Cooperative and Individual business establishment
159
Nông nghiệp, Lâm nghiệp và Thủy sản
Agriculture, Forestry and Fishing
347
Công nghiệp - Industry
453
Thương mại và Du lịch - Trade and Tourism
497
Chỉ số giá - Price Index
523
Vận tải, Bưu chính và Viễn thơng
Transport, Postal services and Telecommunication
543
Giáo dục, đào tạo và Khoa học, công nghệ
Education, training and Science, technology
557
Y tế, Thể thao, Mức sống dân cư, Trật tư, an tồn xã hội, Tư pháp
và Mơi trường - Health, Sport, Living standard, Social order, safety,
Justice and Environment
599
5
6
TỔNG QUAN KINH TẾ - XÃ HỘI TỈNH BÌNH ĐỊNH NĂM 2017
1. Tăng trưởng kinh tế
Tổng sản phẩm trong tỉnh (GRDP) năm 2017 (theo giá so sánh 2010)
tăng 6,72% so với năm 2016. Trong đó, khu vực nơng, lâm nghiệp và thủy sản
tăng 3,24%; khu vực công nghiệp và xây dựng tăng 9,72%, riêng công nghiệp
tăng 9,72%; khu vực dịch vụ tăng 6,79%; thuế sản phẩm trừ trợ cấp sản phẩm
tăng 6,28%.
GRDP năm 2017 theo giá hiện hành ước đạt 63.102,2 tỷ đồng; GRDP
bình quân đầu người đạt 41,3 triệu đồng, tương đương 1.814 USD (Tăng 100
USD so với năm 2016). Về cơ cấu kinh tế năm 2017, khu vực nông, lâm
nghiệp và thủy sản chiếm tỷ trọng 26,1%; khu vực công nghiệp và xây dựng
chiếm 31,4%; khu vực dịch vụ chiếm 38,1%; thuế sản phẩm trừ trợ cấp sản
phẩm chiếm 4,4%.
2. Thu, chi ngân sách nhà nước và bảo hiểm
Tổng thu cân đối ngân sách Nhà nước năm 2017 ước đạt 9.898,5 tỷ đồng,
tăng 13,36% so với thực hiện năm 2016. Tổng chi ngân sách Nhà nước địa
phương năm 2017 ước đạt 16.898,1 tỷ đồng, giảm 2,01% so với thực hiện
năm 2016.
Tổng thu bảo hiểm năm 2017 đạt 2.446 tỷ đồng, tăng 18,68% so với năm
2016, trong đó: Thu Bảo hiểm xã hội đạt 1.246 tỷ đồng; Bảo hiểm y tế đạt
1.112 tỷ đồng; Bảo hiểm thất nghiệp đạt 88 tỷ đồng. Tổng chi bảo hiểm năm
2017 đạt 2.649 tỷ đồng, tăng 1,3% so với năm 2016, trong đó: Chi Bảo hiểm
xã hội: 1.576 tỷ đồng; Bảo hiểm y tế: 1.017 tỷ đồng; Bảo hiểm thất nghiệp: 56
tỷ đồng.
3. Đầu tư
Tổng vốn đầu tư phát triển trên địa bàn thực hiện năm 2017 (theo giá
hiện hành) đạt 31.481 tỷ đồng, tăng 10,51% so với năm 2016, bao gồm: Vốn
khu vực nhà nước đạt 8.130 tỷ đồng, chiếm 25,8% tổng vốn đầu tư và tăng
8,07% so với năm 2016; Khu vực ngoài nhà nước đạt 22.909 tỷ đồng, chiếm
72,8% tổng vốn đầu tư và tăng 13,07%; khu vực có vốn đầu tư nước ngoài đạt
442 tỷ đồng, chiếm 1,4% tổng vốn đầu tư.
7
4. Chỉ số giá
Năm 2017 tỉnh Bình Định tiếp tục thực hiện mục tiêu ổn định kinh tế vĩ
mô, kiềm chế lạm phát; tăng cường kiểm tra, kiểm soát thị trường, kịp thời phát
hiện xử lý nghiêm các hành vi buôn bán, vận chuyển hàng lậu, hàng giả, hàng
kém chất lượng, gian lận thương mại và vi phạm pháp luật về giá; thu hút đầu
tư, thực hiện chính sách tiền tệ, cắt giảm đầu tư công, giảm bội chi ngân sách
địa phương, thúc đẩy sản xuất kinh doanh phát triển… một cách có hiệu quả
trong cơng tác quản lý, điều hành và bình ổn giá cả nên trong năm 2017 chỉ số
giá khơng có biến động lớn, giữ ổn định ở mức tăng nhẹ.
Chỉ số giá tiêu dùng (CPI) tháng 12 tăng 0,78% so với tháng trước; tăng
2,34% so với cùng kỳ năm trước. Chỉ số giá tiêu dùng bình quân năm 2017
tăng 2,93% so với bình quân năm 2016.
Chỉ số giá vàng tháng 12/2017 tăng 5,94% so với cùng kỳ năm 2016;
bình quân năm 2017 tăng 3,18% so với năm 2016. Chỉ số giá đô la Mỹ tháng
12/2017 tăng 0,18% so với cùng kỳ năm 2016; bình quân năm 2017 tăng
1,61% so với năm 2016.
5. Tình hình hoạt động của doanh nghiệp
Năm 2017, có 922 doanh nghiệp đăng ký thành lập mới, tăng 18% so với
năm trước. Tổng số vốn đăng ký đạt 5.820 tỷ đồng, tăng 72% so cùng kỳ, bình
quân một doanh nghiệp đạt 6,3 tỷ đồng.
Phân theo ngành kinh doanh, doanh nghiệp mới thành lập đi vào hoạt
động như sau: Ngành dịch vụ chiếm tỷ trọng cao nhất 376 doanh nghiệp
(chiếm 40%); tiếp đến ngành bán buôn, bán lẻ, sửa xe máy 237 doanh nghiệp
(chiếm 25%); ngành công nghiệp chế biến 161 doanh nghiệp (chiếm 17%);
ngành xây dựng 119 doanh nghiệp (chiếm 12%); thấp nhất ngành nông nghiệp
29 doanh nghiệp (chiếm 4%).
Kinh tế của tỉnh đang có nhiều khởi sắc, do đó số doanh nghiệp giải thể
giảm đáng kể so với cùng kỳ (-29%).
6. Kết quả sản xuất một số ngành lĩnh vực
- Nông, lâm nghiệp và thủy sản
Năm 2017, sản lượng lương thực có hạt cả tỉnh đạt 715.390 tấn, tăng
27.072 tấn so với năm 2016, trong đó sản lượng lúa đạt 666.378 tấn, tăng
27.478 tấn (sản lượng lúa đông xuân đạt 320.383 tấn, tăng 99 tấn; sản lượng
8
lúa hè thu đạt 280.315 tấn, tăng 20.938 tấn; sản lượng lúa mùa đạt 65.680 tấn,
tăng 6.441 tấn).
Năm 2017, diện tích rừng trồng mới tập trung đạt 8.992 ha, tăng 0,2% so
với thực hiện năm 2016, trong đó rừng sản xuất 8.233 ha; rừng phòng hộ 759
ha. Sản lượng gỗ khai thác đạt 853.587 m3, tăng 17,94% so với thực hiện năm
2016; sản lượng củi khai thác đạt 634.456 ster, tăng 17,55%; tre khai thác được
1.776 nghìn cây, giảm 0,17%; lá nón đạt 2.832 nghìn lá, giảm 0,11%.
Năm 2017, sản lượng thủy sản đạt 230.454 tấn, tăng 3,82% so với năm
2016. Trong đó: Sản lượng ni trồng đạt 9.446 tấn, giảm 5,25% so với năm
trước; sản lượng thuỷ sản khai thác đạt 221.008 tấn, tăng 4,24% so với cùng kỳ
năm trước.
- Công nghiệp
Chỉ số sản xuất công nghiệp ngành công nghiệp năm 2017 tăng 8,8% so
với năm 2016, trong đó ngành khai khống tăng 5,51%; cơng nghiệp chế biến,
chế tạo tăng 8,32%; sản xuất và phân phối điện tăng 20,6%; cung cấp nước,
hoạt động quản lý và xử lý rác thải, nước thải tăng 6,4%.
- Thương mại, dịch vụ
Năm 2017, tổng mức bán lẻ hàng hóa và doanh thu dịch vụ tiêu dùng ước
tính đạt 57.380 tỷ đồng, tăng 9,4% so với năm trước.
Vận tải hành khách năm 2017 đạt 33.809 nghìn lượt khách, tăng 5,8% so
với thực hiện năm trước và luân chuyển đạt 3.458.965 nghìn hành khách.km,
tăng 7,9%. Vận tải hàng hóa năm 2017 đạt 17.739 nghìn tấn, tăng 5,6% so với
năm 2016 và luân chuyển đạt 2.691.106 nghìn tấn.km, tăng 5%.
Năm 2017, tổng số lượt khách do các cơ sở lưu trú và lữ hành phục vụ
đạt 1.880.425 lượt người, tăng 17,88% so với năm 2016.
7. Một số vấn đề xã hội
- Dân số, lao động việc làm
Dân số trung bình tỉnh Bình Định năm 2017 ước đạt 1.529.020 người,
tăng 4.397 người, tương đương 0,3% so với năm 2016, bao gồm dân số thành
thị 474.458 người, chiếm 31,03%; dân số nông thôn 1.054.562 người, chiếm
68,97%; dân số nam 746.851 người, chiếm 48,85%; dân số nữ 782.169 người,
chiếm 51,15%.
9
Lực lượng lao động từ 15 tuổi trở lên ước tính năm 2017 là 936.191
người, tăng 4.779 người so với năm 2016. Lao động 15 tuổi trở lên đang làm
việc trong nền kinh tế năm 2017 ước đạt 907.892 người, tăng 7.299 người so
với năm 2016.
Tỷ lệ thất nghiệp của lực lượng lao động trong độ tuổi năm 2017 là 3,4%,
trong đó khu vực thành thị là 5,1%; khu vực nông thôn là 2,7%. Tỷ lệ thiếu
việc làm của lực lượng lao động trong độ tuổi năm 2017 là 1,58%, trong đó
khu vực thành thị là 1,95%; khu vực nơng thôn là 1,42%.
- Đời sống dân cư
Năm 2017, thu nhập bình quân đầu người một tháng theo giá hiện hành
đạt 2.612,2 nghìn đồng, tăng 0,26% so với năm 2016; tỷ lệ hộ nghèo năm 2017
theo chuẩn nghèo tiếp cận đa chiều áp dụng cho giai đoạn 2016-2020 là 6,9%.
Trong năm 2017 theo số liệu sơ bộ, thiên tai đã làm 33 người chết và mất
tích; 45 người bị thương; 155 ngôi nhà bị sập đổ, cuốn trôi; 991 ngôi nhà bị
ngập, sạt lở, tốc mái, hư hại; 1.429 ha lúa, 897 ha hoa màu bị thiệt hại. Tổng
giá trị thiệt hại do thiên tai gây ra trong năm 2017 ước tính 1.154 tỷ đồng.
- Trật tự, an tồn xã hội
Năm 2017 trên địa bàn tỉnh Bình Định đã xảy 161 vụ tai nạn giao thơng
có tính chất từ nghiêm trọng trở lên, làm 170 người chết, 36 người bị thương.
So với năm 2016 số vụ tai nạn giao thông năm 2017 giảm 12,5% (giảm 23 vụ);
số người chết giảm 12,37% (giảm 24 người), số người bị thương tăng 2,86%
(tăng 1 người) so với năm 2016.
Năm 2017 trên địa bàn tỉnh Bình Định đã xảy ra 53 vụ cháy, nổ, ước tính
giá trị thiệt hại 64,9 tỷ đồng. So với năm 2016, số vụ cháy, nổ giảm 56,91%,
giá trị thiệt hại tăng 153,05%.
Khái quát lại, năm 2017 tỉnh Bình Định triển khai nhiệm vụ phát triển
kinh tế - xã hội trong điều kiện kinh tế cả nước tiếp tục chuyển biến tích cực.
Kinh tế vĩ mơ ổn định, lạm phát được kiểm soát. Các cân đối lớn của nền kinh
tế cơ bản được đảm bảo. Đối với tỉnh Bình Định, ngồi ảnh hưởng hưởng nặng
nề của 5 đợt lũ cuối năm 2016 và các đợt bão lụt vào cuối năm 2017, tình hình
chăn ni gặp nhiều khó khăn trong các tháng đầu năm 2017 do giá cả sản
phẩm chăn nuôi xuống thấp, nhất là chăn nuôi heo đã ảnh hưởng đến thu nhập
10
của bà con nông dân trên địa bàn tỉnh; bên cạnh đó, hoạt động sản xuất kinh
doanh của các doanh nghiệp tuy có nhiều nỗ lực cố gắng nhưng vẫn gặp khó
khăn.
Trước tình hình đó, Tỉnh ủy, HĐND, UBND tỉnh đã lãnh đạo, chỉ đạo
các ngành, các địa phương ra sức khắc phục khó khăn, phát huy thuận lợi triển
khai thực hiện đồng bộ Nghị quyết số 01/NQ-CP ngày 01/01/2017 của Chính
phủ về những nhiệm vụ, giải pháp chủ yếu chỉ đạo điều hành thực hiện kế
hoạch phát triển kinh tế - xã hội và dự toán ngân sách nhà nước năm 2017 và
các Nghị quyết của Tỉnh ủy, HĐND tỉnh về nhiệm vụ năm 2017. Tốc độ tăng
trưởng kinh tế năm 2017 ước đạt 6,72%; cơ cấu kinh tế chuyển dịch theo
hướng tích cực; có 16/19 chỉ tiêu chủ yếu đạt và vượt kế hoạch đề ra.
Như vậy, trong năm 2017, với sự nỗ lực phấn đấu của Đảng bộ, chính
quyền, nhân dân và các doanh nghiệp trong tỉnh, đã thực hiện hoàn thành phần
lớn các mục tiêu Nghị quyết của Chính phủ, Nghị quyết của Tỉnh ủy và Nghị
quyết của HĐND tỉnh về kế hoạch phát triển kinh tế - xã hội và dự toán ngân
sách năm 2017 đã đề ra; an sinh xã hội được bảo đảm, quốc phòng - an ninh
được củng cố, các lĩnh vực dịch vụ tiếp tục phát triển, việc làm và thu nhập của
người dân được cải thiện, đời sống nhân dân cơ bản ổn định, hiệu quả hoạt
động chính quyền được nâng lên. Tuy nhiên, có 03/19 chỉ tiêu chủ yếu là: Tổng
sản phẩm địa phương, Tổng kim ngạch xuất khẩu và Tỷ lệ chất thải rắn ở đô thị
được thu gom chưa đạt so với kế hoạch.
11
12
OVERVIEW ON SOCIO-ECONOMIC SITUATION
IN BINH ĐINH IN 2017
1. Economic growth
Gross regional domestic products (GRDP) in 2017 (at 2010 constant
prices) increased by 6.72% over the previous year. Of which, the agriculture,
forestry and fishery sector increased by 3.24%; the industry and construction
sector rose by 9.72%, particularly the industry subsector rose by 9.72%; the
service sector grew by 6.79%; and the product taxes less subsidies on
production rose by 6.28%.
GRDP in 2017 at current prices reached 63,102.2 billion VND; GRDP
per capital achieved 41.3 million VND, equivalent to 1,814 USD (an increase
of 100 USD over 2016). In term of economic structure in 2017, the agriculture,
forestry and fishery sector accounted for 26.1%; the industry and construction
sector made up 31.4%; the service sector shared 38.1%; and the product taxes
less subsidies on production accounted for 4.4%.
2. State budget revenues, expenditures and insurance
Total State budget revenues in the province in 2017 were estimated to
reach 9,898.5 billion VND, an increase of 13.36% compared to 2016. Total
local State budget expenditures reached 16,898.1 billion VND, fell by 2.01%
compared to the implementation in 2016.
Total insurance revenues in 2017 were estimated to be worth 2,446
billion VND, rising by 18.86% over 2016, of which: the social insurance
revenue reached 1,246 billion VND; the health insurance revenue gained 1,112
billion VND; the unemployment insurance revenue attained 88 billion VND.
Total insurance expenditures in 2017 gained 2,649 billion VND, going up
1.3%, of which: the social insurance expenditure achieved 1,576 billion VND;
the health insurance expenditure reached 1,017 billion VND; the
unemployment insurance expenditure was 56 billion VND.
3. Investment
Total implementation investment in the province at current prices was
estimated to reach 31,481 billion VND in 2017, a growth of 10.51% compared
13
to 2016, of which: the State sector’s investment gained 8,130 billion VND,
accounting for 25.8% of total investment and increasing by 8.07%; the Nonstate sector’s investment achieved 22,909 billion VND, sharing 72.8% of total
investment and rising by 13.07%; the foreign direct investment (FDI) sector’s
investment was 442 billion VND, representing 1.4%.
4. Price index
In 2017, Binh Dinh province continued implementing the objective of
macroeconomic stabilization and inflation control; strengthened examining
market to timely detect and deal with the behaviors of trading and
transportation of smuggled, fake and poor quality goods, trade fraud or legal
violation regarding price; investment attraction, monetary policy performance,
public investment cut-down, local state budget deficit as well as promoted
business production development in an effective manner in the work of
management, controlling and stabilizing price, thus in 2017 the price index did
not encounter huge fluctuation and remained a slight rising level.
The CPI in December 2017 rose by 0.78% over the previous month and
increased by 2.34% in comparison with the same period last year. On average,
the CPI in 2017 grew by 2.93% over 2016.
The gold price index in December 2017 increased by 5.94% over the
same month last year; the average gold index in 2017 expanded 3.18%
compared to the previous year. The USD price index in December 2017
increased by 0.18% over the same period in 2016; the average USD price index
in 2017 grew by 1.61% compared to 2016.
5. Enterprise operation
In 2017, the province had 922 newly established enterprises, a rise of 18%
compared to the previous year. Total registered capital reached 5,820 billion
VND, rising by 72% in comparison with 2016. On average, one enterprise
attained 6.3 billion VND of registered capital.
By business activities, the newly established enterprises were as follows:
the service sector accounted for the highest share of 376 enterprises (sharing
40%); the following was the wholesale and retail trade, repair of motorbikes
with 237 enterprises (accounting for 25%); the manufacturing was 161
14
enterprises (sharing 17%); the construction was 119 enterprises (making up
12%); the lowest share was recorded in the agriculture sector with 29
enterprises (accounting for 4%).
The economy in the province revealed many positive changes, thus the
number of dissolved enterprises reduced remarkably in comparison with the
same period (-29%).
6. Results of productions and business in some economic activities,
sectors
- Agriculture, forestry and fishery
In 2017, the production of cereals in the province obtained 715,390 tons,
rising by 27,072 tons in comparison with the previous year, of which, the
production of paddy gained 666,378 tons, growing by 27,478 tons (the
production of spring paddy reached 320,383 tons, going up 99 tons; the
production of autumn paddy was 280,315 tons, rising by 20,938 tons; the
production of winter paddy was 65,680 tons, a rise of 6,441 tons).
In 2017, the area of newly concentrated planted forests in the province
was estimated to reach 8,992 ha, an upturn of 0.20% over 2016, of which, the
production forest was 8,233 ha, the protection forest was 759 ha. The
production of timber reached 853,587 m3, a rise of 17.94% over 2016. The
production of firewood gained 634,456 ster, rising by 17.55%; exploited
bamboo was 1,776 thousand trees, declining by 0.17%; corypha saribus
obtained 2,832 pieces, a drop of 0.11%.
The production of fishery in 2017 achieved 230,454 tons, rising 3.82%
compared to the previous year, of which the production of fishery aquaculture
was 9,446 tons, falling by 5.25%; the production of aquaculture catch was
221,008 tons, rising by 4.24%.
- Industry
The index of industrial production in 2017 was estimated to increase by
8.8% compared to the previous year. Of which, the mining and quarrying went
up 5.51%; the manufacturing grew by 8.32%; the production and distribution
of electricity grew by 20.6%; the water supply, sewerage, waste management
and remediation services expanded 6.4%.
15
- Trade and tourism
The Gross retail sales of goods and services in 2017 were estimated to reach
57,380 billion VND, increasing 9.4% compared to the previous year.
In 2017, the number of passengers carried was 33,809 thousand persons,
rising by 5.8% over the previous year and the passenger traffic reached 3,458,965
thousand persons.km, growing by 7.9%. The volume of freight carried was
estimated to reach 17,739 thousand tons, increasing 5.6% over 2016, the
corresponding volume of freight traffic was 2,691,106 thousand tons.km, an
increase of 5%.
The total number of visitors served by the accommodations and travelling
achieved 1,880,425 persons, rising by 17.88% against 2016.
7. Some social issues
- Population, labor and employment
Average population in 2017 in Binh Dinh province was estimated at
1,529,020 persons, an increase of 4,397 persons, equivalent to 0.3% over 2016,
of which the urban population was 474,458 persons, accounting for 31.03%;
the rural population was 1,054,562 persons, accounting for 68.97%; the male
and female population was 746,851 persons and 782,169 persons, respectively
with the corresponding share of 48.85% and 51.15%.
Labor force aged 15 years and over in the province was estimated at
936,191 persons, a growth of 4,779 persons over 2016. The labor force aged
15 years and over engaging in economic activities in 2017 was estimated at
907,892 persons, a rise of 7,299 persons compared to 2016.
The unemployment rate of the labor force in working age in 2017 was
3.4%, of which the ubran area was 5.1%; the rural area was 2.7%. The
underemployment rate of the labor force aged 15 years and over in 2017 was
1.58%, of which the urban area was 1.95% and the rural area was 1.42%.
- People’s living standards
In 2017, monthly income per capita at current prices reached 2,612.2
thousand VND, an expansion of 0.26% against 2016; the rate of poverty
households in 2017 as identified by multi-dimentional poverty standard
applicable to the period 2016-2020 was 6.9%.
16
According to preliminary data in 2017, natural disasters caused 33 deaths
and missing; 45 wounded; 155 houses were collapsed and swept away; 991
houses were flooded, landslided and roof ripped off; 1,429 ha of paddy and 897
ha of crops were damaged. Total loss caused by natural disasters in 2017 was
estimated at 1,154 billion VND.
- Social order and safety
In 2017, there were 161 serious and even severe traffic accidents
occurred in Binh Dinh province, causing 170 deaths, 36 wounded. Compared
to the figures of 2016, the number of traffic accidents in 2017 declined by
12.5% (23 cases); number of deaths declined by 12.37% (24 persons) and
number of wounded went up 2.86% (1 person).
In 2017, there were 53 fires, explosion occurred. The value of property
loss was estimated at 64.9 billion VND. Compared to the previous year, the
number of fires, explosion decreased 56.91%; the value of property loss rose
by 153.05%.
In short, the task of socio-economic development in Binh Dinh province
in 2017 was carried out in the conditions of continuously positive changes of
the whole national economy. Macro economy was stable, inflation was
controlled. The huge balances of the economy was basically guaranteed. For
Binh Dinh province, besides the adverse impacts of 5 floods in the late 2016
and thunderstorms in the late 2017, the livestock raising faced many difficulties
in the early months of 2017 because the price of livestock products remained at
a low level, particularly pig farming had influence on the income of the farmers
in the province; additionally, the business production activities of the
enterprises had a lot of efforts but still encountered difficulties.
Facing such a situation, the Provincial Communist Party Committee,
People’s Council, People’s Committee led and guided economic sectors and
localities to make efforts to overcome difficulties and proved the advantages in
the consistent deployment of the Resolution No 01/NQ-CP dated 01/01/2017
by the Prime Minister guiding key duties and solutions in the implementation
of the socio-economic development plan and state budget estimate in 2017 as
well as Resolutions issued by the Provincial Communist Party, People’s
Council guiding the tasks in 2017. The economic growth rate in 2017 was
17
estimated at 6.72%; the economic structure transitioned in the positive direction;
there were 16 per 19 key indicators reached or exceeded the stated plan.
Thus, in 2017, along with the efforts made by the Communist Party
Committee, local Government, the people and enterprises in the province
completed majority of the objectives stated by the Resolution of the
Government, Resolutions of the Provincial Communist Party Committee, and
People’s Council on the socio-economic development plan and state budget
estimate in 2017; social security was guaranteed, national defense and public
security were enhanced, the serives continued developing, the people’s
employment and income were improved and the people’s life was basically
stable, the operation effectiveness of the government was improved. However,
there were 3 per 19 key indicators, including GRDP, total export turnover and
the percentage of urban solid waste collected not reaching the expected plan.
18
ĐƠN VỊ HÀNH CHÍNH, ĐẤT ĐAI VÀ KHÍ HẬU
ADMINISTRATIVE UNIT, LAND AND CLIMATE
Biểu
Table
1
2
3
4
5
6
7
8
9
10
11
Trang
Page
Số đơn vị hành chính có đến 31/12/2017
phân theo huyện/thị xã/thành phố
Number of administrative units as of 31 December 2017 by district
25
Hiện trạng sử dụng đất (Tính đến 31/12/2017)
Land use (As of 31 Dec. 2017)
26
Hiện trạng sử dụng đất phân theo loại đất
và phân theo huyện/thị xã/thành phố (Tính đến 31/12/2017)
Land use by types of land and by district (As of 31 Dec. 2017)
27
Cơ cấu đất sử dụng phân theo loại đất
và phân theo huyện/thị xã/thành phố (Tính đến 31/12/2017)
Structure of land use by types of land and by district (As of 31 Dec. 2017)
28
Chỉ số biến động diện tích đất năm 2017 so với năm 2016
phân theo loại đất và phân theo huyện/thị xã/thành phố
(Tính đến 31/12/2017)
Change in natural land area index in 2017 compared to 2016
by types of land and by district (As of 31 Dec. 2017)
29
Nhiệt độ khơng khí trung bình tại trạm quan trắc Quy Nhơn
Mean air temperature at Quy Nhon station
30
Số giờ nắng tại trạm quan trắc Quy Nhơn
Monthly sunshine duration at Quy Nhon station
31
Lượng mưa tại trạm quan trắc Quy Nhơn
Monthly rainfall at Quy Nhon station
32
Độ ẩm khơng khí trung bình tại trạm quan trắc Quy Nhơn
Monthly mean humidity at Quy Nhon station
33
Mực nước và lưu lượng sông An Lão tại trạm quan trắc An Hòa
Water level and flow of An Lao river at An Hoa station
34
Mực nước và lưu lượng sông Kơn tại trạm quan trắc Bình Nghi
Water level and flow of Kon river at Bình Nghi station
35
19
20
GIẢI THÍCH THUẬT NGỮ, NỘI DUNG VÀ PHƯƠNG PHÁP TÍNH
MỘT SỐ CHỈ TIÊU THỐNG KÊ ĐẤT ĐAI VÀ KHÍ HẬU
ĐẤT ĐAI
Tổng diện tích đất của đơn vị hành chính được xác định gồm tồn bộ
diện tích các loại đất trong phạm vi đường địa giới của từng đơn vị hành chính
đã được xác định theo quy định của pháp luật.
Đất sản xuất nông nghiệp là đất đang dùng vào sản xuất nông nghiệp,
bao gồm đất trồng cây hàng năm và đất trồng cây lâu năm.
Đất lâm nghiệp là đất đang có rừng (gồm rừng tự nhiên và rừng trồng)
đạt tiêu chuẩn rừng theo quy định của pháp luật về bảo vệ và phát triển rừng và
đất mới được trồng rừng hoặc trồng kết hợp khoanh nuôi tự nhiên.
Đất chuyên dùng bao gồm đất trụ sở cơ quan nhà nước; đất xây dựng
cơng trình sự nghiệp; đất quốc phịng; đất an ninh; đất sản xuất, kinh doanh phi
nông nghiệp; đất sử dụng vào mục đích cơng cộng.
Đất ở là đất để xây dựng nhà ở, xây dựng các cơng trình phục vụ cho đời
sống; đất vườn, ao gắn liền với nhà ở trong cùng một thửa đất thuộc khu dân cư
(kể cả trường hợp vườn, ao gắn liền với nhà ở riêng lẻ) đã được công nhận là
đất ở. Đất ở bao gồm đất ở tại nông thôn, đất ở tại đơ thị.
Nhóm đất chưa sử dụng gồm các loại đất chưa xác định mục đích sử
dụng, bao gồm đất bằng chưa sử dụng; đất đồi núi chưa sử dụng; núi đá khơng
có rừng cây.
KHÍ HẬU
Nhiệt độ khơng khí trung bình các tháng là số bình qn của nhiệt độ
khơng khí trung bình của các ngày trong tháng.
Nhiệt độ khơng khí trung bình năm là số bình quân của nhiệt độ khơng
khí trung bình các ngày trong năm.
• Nhiệt độ khơng khí được đo bằng nhiệt kế thường, nhiệt kế tối cao (thủy
ngân), nhiệt kế tối thấp (rượu) và nhiệt ký (bộ phận cảm ứng là một tấm lưỡng
kim) đặt trong lều khí tượng ở độ cao 2m cách mặt đất nơi khơng có trực xạ
của bức xạ mặt trời.
21
• Nhiệt độ khơng khí trung bình ngày được tính theo phương pháp bình
quân số học giản đơn từ kết quả của 4 lần quan trắc chính trong ngày tại thời
điểm 1 giờ, 7 giờ, 13 giờ và 19 giờ, hoặc được tính từ kết quả của 24 lần quan
trắc tại các thời điểm 1 giờ, 2 giờ, 3 giờ,… và 24 giờ của nhiệt kế.
Số giờ nắng trong các tháng là tổng số giờ nắng các ngày trong tháng
cộng lại. Số giờ nắng là số giờ có cường độ bức xạ mặt trời trực tiếp với giá trị
bằng hay lớn hơn 0,1 kw/m² (≥ 0,2 calo/cm² phút). Thời gian nắng được đo
bằng nhật quang ký.
Tổng số giờ nắng trong năm là tổng số giờ nắng các ngày trong năm.
Lượng mưa trong tháng là tổng lượng mưa của các ngày trong tháng.
Lượng mưa là độ dày tính bằng milimét (mm) của lớp nước nổi do mưa tạo nên
trên một bề mặt phẳng tại một địa điểm được đo bằng vũ kế và vũ ký.
Tổng lượng mưa trong năm là tổng lượng mưa của các ngày trong năm.
Độ ẩm khơng khí trung bình các tháng trong năm là số bình quân của
độ ẩm khơng khí tương đối trung bình của các ngày trong tháng.
• Độ ẩm khơng khí tương đối là tỷ số giữa sức trương hơi nước có trong
khơng khí và sức trương hơi nước bão hòa (tối đa) ở cùng một nhiệt độ. Nó
được thể hiện bằng tỷ lệ phần trăm (%). Độ ẩm khơng khí được đo bằng ẩm kế
và ẩm ký.
• Độ ẩm khơng khí tương đối trung bình ngày được tính theo phương pháp
bình qn số học giản đơn từ kết quả của 4 lần quan trắc chính trong ngày tại
thời điểm 1 giờ, 7 giờ, 13 giờ và 19 giờ, hoặc được tính từ kết quả của 24 lần
quan trắc tại các thời điểm 1 giờ, 2 giờ, 3 giờ,… và 24 giờ của ẩm ký.
Độ ẩm khơng khí trung bình năm là số bình qn của độ ẩm khơng khí
tương đối trung bình của các ngày trong năm.
Mực nước là độ cao của mặt nước nơi quan sát so với mặt nước biển,
được tính theo centimét (cm). Để quan trắc mực nước người ta thường dùng hệ
thống cọc, thước và máy tự ghi.
Lưu lượng nước là lượng nước chảy qua mặt cắt ngang sông trong một
đơn vị thời gian, đơn vị tính lưu lượng nước thường là m³/s. Lưu lượng trung
bình tháng là trị số bình quân của lưu lượng các ngày trong tháng. Dụng cụ đo
lưu lượng nước là máy lưu tốc kế, phao trôi hoặc máy chuyên dụng ADCP.
22
EXPLAINING OF TERMININOLOGY, CONTENT
AND METHODOLOGY OF SOME STATISTICAL INDICATORS
OF LAND AND CLIMATE
LAND
Total land area of an administration unit is the aggregate area of all
types of land within the boundary line of each administration unit which is
determined in accordance with the provisions of law.
Agriculture production land is the land used in agricultural production,
including annual crop land and perennial crop land.
Forestry land is the land under forests (including natural forests and
planted forests) that meet the forest standards prescribed by the legislation on
forest protection and development, and newly planted forestor plantation forest
in combination with natural farming.
Specially used land includes land for offices of the State agencies, land
for construction of for-profit facilities; land for security and national defense
purposes; land for non-agricultural production and business, and land used for
public purposes.
Residential land is the land used for construction of houses and facilities
for living activities; garden and pond attached to house in the same residential
land plot (including garden and pond attached to detached house) which is
recognized as residential land. It includes residential land in rural areas,
residential land in urban areas.
Unused land includes all categories of land of which the purposes of use
have not been yet determined, including unused plain land; unused hilly land;
rocky mountains without forests.
CLIMATE
Average air temperature in months is the average of average air
temperature of days in the month.
Average air temperature in year is the average of average air
temperature of days in the year.
• Air temperature is measured by normal thermometer, maximum
thermometer (mercury), minimum thermometer (alcohol liquid) and
23
thermograph (sensor is a bi-metal plate) exposed to the air in a meteor bust at
altitude 2m away from the ground, sheltered from direct solar radiation.
• Daily average air temperature is calculated using the simple arithmetic
mean from the results of 4 main observations in the day at 1 a.m., 7 a.m., 13 p.m.,
19 p.m. or from the results of 24 observations at the time of 1 a.m., 2 a.m.,
3 a.m.,... 24 p.m. of the thermometer.
Number of sunshine hours in months is the sum of sunshine hours of
the days in the month. Numbers of sunshine hours are hours with direct solar
radiation equal or exceed 0.1 kw/m2 (≥ 0.2 cal/cm2 min.). Sunshine duration is
measured by heliograph.
Total number of sunshine hours in the year is the total number of
sunshine hours of the days in the year.
Rainfall in months is the total rainfall of the days in the month. Rainfall
is the thickness measured in millimeters (mm) of the floating water layer made
by rain on a flat surface at a site, which measured by rain-gauge/pluviometer.
Total rainfall in year is the total rainfall of the days in the year.
Average humidity in months is the average of average relative humidity
of the days in the month.
• Relative humidity is the ratio between the vapor in the air and saturation
vapor (maximum) at the same temperature. It is indicated in percentage (%).
Humidity is measured by hygrometer and hygrograph.
• Daily average relative humidity is calculated by the simple arithmetic
mean from the results of 4 main observations in the day at: 1 a.m., 7 a.m.,
13 p.m., 19 p.m. or from the results of 24 observations at the time of 1 a.m.,
2 a.m., 3 a.m.,... 24 p.m. of the hygrograph.
Average humidity in year is the average of average relative humidity of
all days in the year.
The water level is elevation of the water surface at the observation place
in relation to the sea surface, measured in centimeters (cm). A system of piles,
rulers and self-recording machines are used to monitor the water level.
Water flow is the amount of water flowing through a cross section of the
river in a unit of time, measured in m³/s. Monthly average flow is the average
value of flow of the days in the month. Water flow is measured by flowmeters,
drifting buoys or ADCP machines.
24
1
Số đơn vị hành chính có đến 31/12/2017
phân theo huyện/thị xã/thành phố
Number of administrative units as of 31 December 2017 by district
Chia ra - Of which
Tổng số
Total
TỔNG SỐ - TOTAL
Phường
Thị trấn
Xã
Wards
Town under
districts
Communes
159
21
12
126
Quy Nhon city
21
16
-
5
Huyện An Lão
An Lao district
10
-
1
9
Huyện Hoài Nhơn
Hoai Nhon district
17
-
2
15
Huyện Hoài Ân
Hoai An district
15
-
1
14
Huyện Phù Mỹ
Phu My district
19
-
2
17
9
-
1
8
Tay Son district
15
-
1
14
Huyện Phù Cát
Phu Cat district
18
-
1
17
Thị xã An Nhơn
An Nhon town
15
5
-
10
Huyện Tuy Phước
Tuy Phuoc district
13
-
2
11
7
-
1
6
Thành phố Quy Nhơn
Huyện Vĩnh Thạnh
Vinh Thanh district
Huyện Tây Sơn
Huyện Vân Canh
Van Canh district
25
