Tài liệu JasperReports 3.5 for Java Developers- P7 pptx
Bạn đang xem bản rút gọn của tài liệu. Xem và tải ngay bản đầy đủ của tài liệu tại đây (1.2 MB, 50 trang )
Chapter 10
[
289
]
We modied the Vertical Alignment of all three text elds in the page header
by selecting the appropriate values in the Properties window for each one of them.
Now it is time to add some dynamic data to the report. We can enter a report
query selecting the report node in the Report Inspector window and then selecting
Edit Query.
As we type the report query, by default iReport retrieves report elds from it. This
query will retrieve the tail number, serial number, and model of every aircraft in the
database.
This material is copyright and is licensed for the sole use by William Anderson on 26th August 2009
4310 E Conway Dr. NW, , Atlanta, , 30327Please purchase PDF Split-Merge on www.verypdf.com to remove this watermark.
Graphical Report Design with iReport
[
290
]
Now that we have a query and report elds, we can add text elds to the report. We
can do so by dragging the elds in the Report Inspector window to the appropriate
location in the report template.
This material is copyright and is licensed for the sole use by William Anderson on 26th August 2009
4310 E Conway Dr. NW, , Atlanta, , 30327Please purchase PDF Split-Merge on www.verypdf.com to remove this watermark.
Chapter 10
[
291
]
After aligning each text eld with the corresponding header, our report should now
look like this:
To avoid extra vertical space between records, we resized the Detail band by
dragging its bottom margin up. The same effect can be achieved by double-clicking
on the bottom margin.
Notice that we have an empty Column Header band in the report template. This
empty band will result in having some whitespace between each header and the rst
row in the Detail band. To avoid having this whitespace in our report, we can easily
delete this band by right-clicking on it in the Report Inspector window and selecting
Delete Band.
This material is copyright and is licensed for the sole use by William Anderson on 26th August 2009
4310 E Conway Dr. NW, , Atlanta, , 30327Please purchase PDF Split-Merge on www.verypdf.com to remove this watermark.
Graphical Report Design with iReport
[
292
]
We now have a simple but complete report. We can view it by clicking on Preview.
That's it! We have created a simple report graphically with iReport.
Creating more elaborate reports
In the previous section, we created a fairly simple database report. In this section, we
will modify that report to illustrate how to add images, charts, and multiple columns
to a report. We will also see how to group report data. We will perform all of these
tasks graphically with iReport.
Adding images to a report
Adding static images to a report is very simple with iReport. Just drag the Image
component from the Palette to the band where it will be rendered in the report.
When we drop the image component into the appropriate band, a window pops up
asking us to specify the location of the image le to display.
This material is copyright and is licensed for the sole use by William Anderson on 26th August 2009
4310 E Conway Dr. NW, , Atlanta, , 30327Please purchase PDF Split-Merge on www.verypdf.com to remove this watermark.
Chapter 10
[
293
]
After we select the image, we can drag it to its exact location where it will be rendered.
As we can see, adding images to a report using iReport couldn't be any simpler.
This material is copyright and is licensed for the sole use by William Anderson on 26th August 2009
4310 E Conway Dr. NW, , Atlanta, , 30327Please purchase PDF Split-Merge on www.verypdf.com to remove this watermark.
Graphical Report Design with iReport
[
294
]
Adding multiple columns to a report
The report we've been creating so far in this chapter contains over 11,000 records.
It spans over 300 pages. As we can see, there is a lot of space between the text elds.
Perhaps it would be a good idea to place the text elds closer together and add
an additional column. This would cut the number of pages in the report by half.
To change the number of columns in the report, we simply need to select the root
report node in the Report Inspector window at the top left and then modify its
Columns property in the Properties window at the bottom right.
When we modify the Columns property, iReport automatically modies the Column
Width property to an appropriate value. We are free, of course, to modify this value
if it doesn't meet our needs.
As our report now contains more than one column, it makes sense to re-add the
Column Header band we deleted earlier. This can be done by right-clicking on
the band in the Report Inspector window and selecting Add Band.
This material is copyright and is licensed for the sole use by William Anderson on 26th August 2009
4310 E Conway Dr. NW, , Atlanta, , 30327Please purchase PDF Split-Merge on www.verypdf.com to remove this watermark.
Chapter 10
[
295
]
Next, we need to move the static text in the page header to the Column Header band.
To move any element from one band to another, all we need to do is drag it to the
appropriate band in the Report Inspector window.
Next, we need to resize and reposition the text elds in the Detail band and the static
text elements in the Column Header band so that they t in the new, narrower width
of the columns. Also, resize the Column Header band to avoid having too much
whitespace between the elements of the Column Header and Detail bands. Our report
now looks like this:
This material is copyright and is licensed for the sole use by William Anderson on 26th August 2009
4310 E Conway Dr. NW, , Atlanta, , 30327Please purchase PDF Split-Merge on www.verypdf.com to remove this watermark.
Graphical Report Design with iReport
[
296
]
We can see the resulting report by clicking on Preview.
Grouping report data
Suppose we are asked to modify our report so that data is divided by the state where
the aircraft is registered. This is a perfect situation to apply report groups. Recall
from Chapter 6, Report Layout and Design, that report groups allow us to divide report
data when a report expression changes. Recall that our report query limits the result
set to aircraft registered in the United States, and one of the columns it retrieves is
the state where the aircraft is registered.
To dene a report group, we need to right-click on the root report node in the Report
Inspector window, and then select Add Report Group.
This material is copyright and is licensed for the sole use by William Anderson on 26th August 2009
4310 E Conway Dr. NW, , Atlanta, , 30327Please purchase PDF Split-Merge on www.verypdf.com to remove this watermark.
Chapter 10
[
297
]
Then, enter the Group name and indicate whether we want to group by a eld or by
a report expression. In our case, we want to group the data by
state
eld.
After clicking on Next>, we need to indicate whether we want to add a group header
and/or footer to our report.
This material is copyright and is licensed for the sole use by William Anderson on 26th August 2009
4310 E Conway Dr. NW, , Atlanta, , 30327Please purchase PDF Split-Merge on www.verypdf.com to remove this watermark.
Graphical Report Design with iReport
[
298
]
For aesthetic purposes, we move the static text elds in the Column Header band
to the Group Header band, remove the column and page header bands, and add
additional information to the Group Header band. After making all of these changes,
our report preview will look like this:
We can preview the report by clicking Preview.
This material is copyright and is licensed for the sole use by William Anderson on 26th August 2009
4310 E Conway Dr. NW, , Atlanta, , 30327Please purchase PDF Split-Merge on www.verypdf.com to remove this watermark.
Chapter 10
[
299
]
Adding charts to a report
To add a chart to a report, we need to drag the Chart component from the Palette
into the approximate location where the chart will be rendered in the report.
When dropping the chart component into the report, the following window will
pop up, allowing us to select the type of chart we want to add to the report:
For this example, we will add a 3D bar chart to the report. All that needs to be done
is to click on the appropriate chart type, and then click on the OK button.
This material is copyright and is licensed for the sole use by William Anderson on 26th August 2009
4310 E Conway Dr. NW, , Atlanta, , 30327Please purchase PDF Split-Merge on www.verypdf.com to remove this watermark.
Graphical Report Design with iReport
[
300
]
Our chart will graphically illustrate the number of aircraft registered in each state
of the United States. (We will explain how to have the chart display the appropriate
data later in this section.) We will place the chart in the Summary band at the end of
the report. As the chart will illustrate a lot of data, we need to resize the Summary
band so that our chart can t. After resizing the Summary band, outlining the area
of the report to be covered by the chart, and selecting the chart type, the Summary
section of our report preview looks like this:
To ne-tune the appearance of the chart, we can select it in the Report Inspector
window and then modify its properties as necessary in the Properties window.
This material is copyright and is licensed for the sole use by William Anderson on 26th August 2009
4310 E Conway Dr. NW, , Atlanta, , 30327Please purchase PDF Split-Merge on www.verypdf.com to remove this watermark.
Chapter 10
[
301
]
To specify the data that will be displayed in the chart, we need to right-click on the
chart in the Report Inspector window and select Chart Data. We then need to click
on the Details tab in the resulting pop-up window.
This material is copyright and is licensed for the sole use by William Anderson on 26th August 2009
4310 E Conway Dr. NW, , Atlanta, , 30327Please purchase PDF Split-Merge on www.verypdf.com to remove this watermark.
Graphical Report Design with iReport
[
302
]
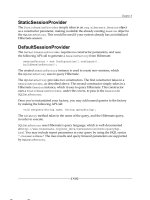
We then need to click on the Add button to add a new Category series.
The Series expression eld is the name of the series. Its value can be any object that
implements
java.lang.Comparable
. In most cases, the value of this eld is a string.
The Category expression eld is the label of each value in the chart. The value of this
eld is typically a string. In our example, each state is a different category, so we will
use the state eld (
$F{state}
) as our category expression.
The Value expression eld is a numeric value representing the value to be charted
for a particular category. In our example, the number of aircraft in a particular state
is the value we want to chart. Therefore, we use the implicit
stateGroup_COUNT
variable (
$V{stateGroup_COUNT}
) as our value expression.
The optional Label Expression eld allows us to customize item labels in the chart.
Every time we create a group in a report template, an implicit variable
named groupName_COUNT is created, where groupName is the name
of the group.
This material is copyright and is licensed for the sole use by William Anderson on 26th August 2009
4310 E Conway Dr. NW, , Atlanta, , 30327Please purchase PDF Split-Merge on www.verypdf.com to remove this watermark.
Chapter 10
[
303
]
We can either type in a value for the Series expression, Category expression,
and Value expression elds, or we can click on the icon to be able to graphically
select the appropriate expression using iReport's Expression editor.
Using the Expression editor, we can select any parameter, eld, or variable as
our expression. We can also use user-dened expressions to ll out any of the
elds that require a valid JasperReports expression.
After selecting the appropriate expressions for each of the elds, our chart details
are as follows:
This material is copyright and is licensed for the sole use by William Anderson on 26th August 2009
4310 E Conway Dr. NW, , Atlanta, , 30327Please purchase PDF Split-Merge on www.verypdf.com to remove this watermark.
Graphical Report Design with iReport
[
304
]
After clicking on OK and closing the Chart details window, we are ready to view
our chart in action, which can be done simply by clicking on Preview.
Help and support
Although this chapter didn't discuss every iReport feature, I'm condent that iReport
is intuitive enough after you get comfortable with it. Some of the iReport features
not covered in this chapter include subreport creation and adding crosstabs, lines,
ellipses, and rectangles to a report. However, we have learned all these features
the "hard" way by creating a JRXML template by hand. For someone familiar with
JasperReports, adding these features to a report created by iReport should be
trivial. If more help is needed, JasperSoft provides additional documentation for
iReport, and lots of knowledgeable people frequent the iReport forums at
http://
jasperforge.org/plugins/espforum/browse.php?group_id=83&forumid=101
.
This material is copyright and is licensed for the sole use by William Anderson on 26th August 2009
4310 E Conway Dr. NW, , Atlanta, , 30327Please purchase PDF Split-Merge on www.verypdf.com to remove this watermark.
Chapter 10
[
305
]
Summary
This chapter taught us how to install and set up iReport, use iReport's Report Wizard
to quickly generate a report, and graphically design custom reports. Moreover, we
learned how to group report data graphically with iReport, to add multiple columns
to a report, and to add images and charts to a report graphically with iReport.
iReport is a very powerful tool that can signicantly reduce report design time.
To use all of the features of iReport effectively, however, an iReport user must be
familiar with basic JasperReports concepts, such as bands, report variables, report
elds, and so on.
This material is copyright and is licensed for the sole use by William Anderson on 26th August 2009
4310 E Conway Dr. NW, , Atlanta, , 30327Please purchase PDF Split-Merge on www.verypdf.com to remove this watermark.
This material is copyright and is licensed for the sole use by William Anderson on 26th August 2009
4310 E Conway Dr. NW, , Atlanta, , 30327Please purchase PDF Split-Merge on www.verypdf.com to remove this watermark.
Integrating JasperReports
with Other Frameworks
In previous chapters, we have seen several examples of web-based applications
generating reports and streaming them to the browser. In those examples, we
have been using "raw" servlets to generate reports. Most modern web-based Java
applications are written using one of several web application frameworks. In
addition to using a web application framework, most modern Java projects use
an object-relational mapping (ORM) tool for database access. In this chapter, we
will cover how to integrate JasperReports with several popular web application
frameworks and ORM tools. We will cover the following topics:
• Integrating JasperReports with Hibernate
• Integrating JasperReports with the Java Persistence API (JPA)
• Integrating JasperReports with Spring
• Integrating JasperReports with Java Server Faces (JSF)
• Integrating JasperReports with Struts
Please note that this chapter assumes some familiarity with the above frameworks.
Feel free to skip to the sections that apply to the frameworks used in your project.
This material is copyright and is licensed for the sole use by William Anderson on 26th August 2009
4310 E Conway Dr. NW, , Atlanta, , 30327Please purchase PDF Split-Merge on www.verypdf.com to remove this watermark.
Integrating JasperReports with Other Frameworks
[
308
]
Integrating JasperReports with Hibernate
Hibernate (
) is a very popular ORM tool. JasperReports
(version 1.2 and newer) includes native support for Hibernate integration. This
integration consists of allowing embedded report queries to be written in the
Hibernate Query Language (HQL). The following JRXML template illustrates how
to do this:
<?xml version="1.0" encoding="UTF-8"?>
<jasperReport
xmlns="
xmlns:xsi="
xsi:schemaLocation="
/jasperreports
/jasperreport.xsd"
name="HibernateQueryDemoReport" pageWidth="595" pageHeight="842"
columnWidth="555" leftMargin="20" rightMargin="20"
topMargin="30" bottomMargin="30">
<parameter name="countryCode" class="java.lang.String"/>
<queryString language="hql">
<![CDATA[from Aircraft aircraft
where country = $P{countryCode} order by aircraft.id]]>
</queryString>
<field name="id" class="java.lang.String"/>
<field name="aircraftSerial" class="java.lang.String"/>
<field name="yearBuilt" class="java.lang.String"/>
<title>
<band height="30">
<textField>
<reportElement x="0" y="0" width="555" height="30"/>
<textElement/>
<textFieldExpression class="java.lang.String">
<![CDATA["Aircraft Registered in Country Code: " +
$P{countryCode}]]>
</textFieldExpression>
</textField>
</band>
</title>
<pageHeader>
<band height="30">
<staticText>
<reportElement x="0" y="0" width="100" height="30"/>
<textElement/>
<text>
<![CDATA[Tail Number]]>
This material is copyright and is licensed for the sole use by William Anderson on 26th August 2009
4310 E Conway Dr. NW, , Atlanta, , 30327Please purchase PDF Split-Merge on www.verypdf.com to remove this watermark.