Tài liệu Cảm biến trong sản xuất P2 pptx
Bạn đang xem bản rút gọn của tài liệu. Xem và tải ngay bản đầy đủ của tài liệu tại đây (400.16 KB, 18 trang )
Soft computing techniques, such as fuzzy logic, artificial neural networks and ge-
netic algorithms, which can to some extent imitate the human brain, can possibly
contribute to making the monitoring system more intelligent.
1 Fundamentals6
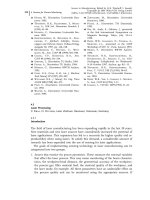
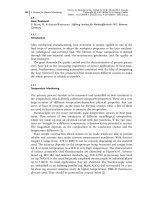
Fig. 1.1-6 Evolution of monitoring system
1.1.6
References
1 Shaw, M. C., Metal Cutting Principles; Ox-
ford: Oxford University Press, 1984.
2 Weck, M., Werkzeugmaschinen Fertigungssys-
teme 1, Maschinenarten und Anwendungsber-
eiche, 5. Auflage; Berlin: Springer, 1998.
3 Usher, M. J., Sensors and Transducers; Lon-
don, Macmillian, 1985.
4 Sukvittyawong, S., Inasaki, I., JSME Int.,
Series 3 34 (4) (1991), 546–552.
5 Sakakura, M., Inasaki, I., Ann. CIRP 42
(1) (1993), 379–382.
1.2
Principles of Sensors in Manufacturing
D. Dornfeld, University of California, Berkeley, CA, USA
1.2.1
Introduction
New demands are being placed on monitoring systems in the manufacturing en-
vironment because of recent developments and trends in machining technology
and machine tool design (high-speed machining and hard turning, for example).
Numerous different sensor types are available for monitoring aspects of the man-
ufacturing and machining environments. The most common sensors in the in-
dustrial machining environment are force, power, and acoustic emission (AE) sen-
sors. This section first reviews the classification and description of sensor types
and the particular requirements of sensing in manufacturing by way of a back-
ground and then the state of sensor technology in general. The section finishes
with some insight into the future trends in sensing technology, especially semi-
conductor-based sensors.
Sensors in Manufacturing. Edited by H.K. Tönshoff, I. Inasaki
Copyright © 2001 Wiley-VCH Verlag GmbH
ISBNs: 3-527-29558-5 (Hardcover); 3-527-60002-7 (Electronic)
In-process sensors constitute a significant technology, helping manufacturers to
meet the challenges inherent in manufacturing a new generation of precision
components. In-process sensors play different roles in manufacturing processes
and can address the tooling, process, workpiece, or machine. First and foremost,
they allow manufacturers to improve the control over critical process variables.
This can result in the tightening of control limits of a process and as improve-
ments in process productivity, forming the basis of precision machining (Figure
1.2-1). For example, the application of temperature sensors and appropriate con-
trol to traditional machine tools has been demonstrated to reduce thermal errors,
the largest source of positioning errors in traditional and precision machine tools,
and the work space errors they generate. Second, they serve as useful productivity
tools in monitoring the process. For example, as already stated, they improve pro-
ductivity by detecting process failure as is the case with acoustic sensors detecting
catastrophic tool failure in cutting processes. They also reduce dead time in the
process cycle by detecting the degree of engagement between the tool and the
work, allowing for a greater percentage of machining time in each part cycle. As
process speeds increase and equipment downtime becomes less tolerable, sensors
become critical elements in the manufacturing system to insure high productivity
and high-quality production.
With regard to sensor systems for manufacturing process monitoring, a distinc-
tion is to be made on the one hand between continuous and intermittent systems
and on the other between direct and indirect measuring systems. In the case of
continuously measuring sensor systems, the measured variable is available
throughout the machining process; intermittently measuring systems record the
measured variable only during intervals in the machining process. The distinction
is sometimes referred to as pre-, inter-, or post-process measurement for intermit-
1.2 Principles of Sensors in Manufacturing 7
Fig. 1.2-1 Sensor application versus level
of precision and error control parameters
tent systems and in-process for continuous systems. Obviously, other distinctions
can apply. Direct measuring systems employ the actual quantity of the measured
variable, eg, tool wear, whereas indirect measuring systems measure suitable aux-
iliary quantities, such as the cutting force components, and deduce the actual
quantity via empirically determined correlations. Direct measuring processes pos-
sess a higher degree of accuracy, whereas indirect methods are less complex and
more suitable for practical application. Continuous measurement permits the con-
tinuous detection of all changes to the measuring signal and ensures that sudden,
unexpected process disturbances, such as tool breakage, are responded to in good
time. Intermittent measurement is dependent on interruptions in the machining
process or special measuring intervals, which generally entail time losses and,
subsequently, high costs. Furthermore, tool breakage cannot be identified until
after completion of the machining cycle when using these systems, which means
that consequential damage cannot be prevented. Intermittent wear measurement
nevertheless has its practical uses, provided that it does not result in additional
idle time. It would be conceivable, for example, for measurement to be carried
out in the magazine of the machine tool while the machining process is contin-
ued with a different tool. Intermittent wear-measuring methods can be
implemented with mechanical, inductance-capacitance, hydraulic-pneumatic and
opto-electronic probes or sensor systems.
Direct and continuous sensor measuring is the optimal combination with re-
spect to accuracy and response time. For direct measurement of the wear land
width, an opto-electronic system has been available, for example, whereby a
wedgeshaped light gap below the cutting edge of the tool, which changes propor-
tionally to the wear land width, is evaluated. The wear land width can also be
measured directly by means of specially prepared cutting plates, the flanks of
which are provided with strip conductors which act as electrical resistors. Another
approach uses an image processing system based on a linear camera for on-line
determination of the wear on a rotating inserted-tooth face mill. Non-productive
time due to measurement is avoided and the system reacts quickly to tool break-
age. There are, however, problems due to the short distance between the tool and
the camera, which is mounted in the machine space to the side of the milling cut-
ter, and due to chips and dirt on the inserts.
The indirect continuous measuring processes, which are able to determine the
relevant disturbance, eg, tool wear, by measuring an auxiliary quantity and its
changes, are generally less accurate than the direct methods. A valuable variable
which can be measured for the purpose of indirect wear determination is the cut-
ting temperature, which generally rises as the tool wear increases as a result of
the increased friction and energy conversion. However, all the known measuring
processes are pure laboratory methods for turning which are furthermore not fea-
sible for milling and drilling, owing to the rotating tools. Continuous measure-
ment of the electrical resistance between tool and workpiece is also not feasible
for practical applications, on account of the required measures, such as insulation
of the workpiece and tool, and to short circuits resulting from chips or cooling lu-
bricant. Systems based on sound monitoring using microphones, for example,
1 Fundamentals8
also have not yet reached industrial application owing to the problems caused by
noise that is not generated by the machining process.
The philosophy of implementation of any sensing methodology for diagnostics
or process monitoring can be divided into two simple approaches. In one
approach, one uses a sensing technique for which the output bears some relation-
ship to the characteristics of the process. After determining the sensor output and
behavior for ‘normal’ machine operation or processing, one observes the behavior
of the signal until it deviates from the normal, thus indicating a problem. In the
other approach, one attempts to determine a model linking the sensor output to
the process mechanics and then, with sensor information, uses the model to pre-
dict the behavior of the process. Both methods are useful in differing circum-
stances. The first is, perhaps, the most straightforward but liable to misinterpreta-
tion if some change in the process occurs that was not foreseen (that is, ‘normal’
is no longer normal). Thus some signal processing strategy is required.
The signal that is delivered by the sensor must be processed to detect distur-
bances. The simplest method is the use of a rigid threshold. If the threshold is
crossed by the signal owing to some process change affecting the signal, collision
or tool breakage can be detected. Since this method only works when all restrictions
(depth of cut, workpiece material, etc.) remain constant, the use of a dynamic thresh-
old is more appropriate in most cases. The monitoring system calculates an upper
threshold from the original signal. The upper threshold time-lags the original sig-
nal. Slow changes of the signal can occur without violating the threshold. At the in-
stant of breakage, however, the upper threshold is crossed and, following a plausibil-
ity check (the signal must remain above the upper threshold for a certain time dura-
tion), a breakage is confirmed and signaled. Because of the high bandwidth of the
acoustic emission signal, fast response time to a breakage is insured. Of course, pro-
cess changes not due to tool breakage (eg, some interrupted cuts) that affect the sig-
nal similarly to tool breakage will cause a false reading.
Another method is based upon the comparison of the actual signal with a
stored signal. The monitoring system calculates the upper and lower threshold
values from the stored signal. In the case of tool breakage, the upper threshold is
violated. When the workpiece is missing, the lower threshold is consequently
crossed. The disadvantage of this type of monitoring strategy is that a ‘teach-in’ cy-
cle is necessary. Furthermore, the fact that the signals must be stored means that
more system memory must be allocated. These methods have found applicability
to both force and AE signal-based monitoring strategies.
These strategies work well for discrete events such as tool breakage but are of-
ten more difficult to employ for continuous process changes such as tool wear.
The continuous variation of material properties, cutting conditions, etc., can mask
wear-related signal features or, at least, limit the range of applicability or require
extensive system training. A more successful technique is based on the tracking
of parameters that are extracted from signal features that have been filtered to re-
move process-related variables (eg, cutting speed), eg, using parameters of an
auto-regressive model (filter) of the AE signal to track continuous wear. The strat-
egy works over a range of machining conditions.
1.2 Principles of Sensors in Manufacturing 9
The combination of different, inexpensive sensors today is ever increasing to
overcome shortages of single sensor devices. There are two possible ways to
achieve a multi-sensor approach. Either one sensor is used that allows the mea-
surement of different variables or different sensors are attached to the machine
tool to gain different variables. The challenge in this is both electronic integration
of the sensor and integration of the information and decision making.
1.2.2
Basic Sensor Classification
We now review a basic classification of sensors based upon the principle of opera-
tion. Several excellent texts exist that offer detailed descriptions of a range of sen-
sors and these have been summarized in the material below [1–3]. We distinguish
here between a transducer and a sensor even though the terms are often used inter-
changeably.
A transducer is generally defined as a device that transmits energy from one
system to another, often with a change in form of the energy. A good example is
a piezoelectric crystal which will output a current or charge when mechanically ac-
tuated. A sensor, on the other hand, is a device which is ’sensitive‘ to (meaning re-
sponsive to or otherwise affected by) a physical stimulus (eg, light) and then trans-
mits a resulting impulse for interpretation or control [4]. Clearly there is some
overlap as in the case of a piezoelectric actuator (responding to a charge and out-
putting a motion or force) and a piezoelectric sensor (outputting a charge for a
given force or motion input). In one case, the former, the piezo device acts as a
transducer and in the other, the latter, as a sensor. The terms can often be used
interchangeably without problem in most cases.
A sensor, according to Webster’s Dictionary is ‘a device that responds to a physi-
cal (or chemical) stimulus (such as heat, light, sound, pressure, magnetism, or a
particular motion) and transmits a resulting impulse (as for measurement or op-
erating control)’. Sensors are in this way devices which first perceive an input sig-
nal and then convert that input signal or energy to another output signal or en-
ergy for further use. We generally classify signal outputs into six types:
· mechanical;
· thermal (ie, kinetic energy of atoms and molecules);
· electrical;
· magnetic;
· radiant (including electromagnetic radio waves, micro waves, etc.); and
· chemical.
Sensors now exist, and are in common use, that can be classified as either ‘sen-
sors’ on silicon as well as ‘sensors in silicon’ [1]. We shall discuss the basic charac-
teristics of both types of silicon ‘micro-sensors’ but introduce some of the unique
features of the latter which are becoming more and more utilized in manufactur-
ing. The small size, multi-signal capability, and ease of integration into signal pro-
cessing and control systems make them extremely practical. In addition, as a re-
1 Fundamentals10
sult of their relatively low cost, these are expected to be the ‘sensors of choice’ in
the future.
The six types of signal outputs listed above reflect the 10 basic forms of energy
that sensors convert from one form to another. These are listed in Table 1.2-1 [3,
5, 6]. In practice, these 10 forms of energy are condensed into the six signal types
listed as we can consider atomic and molecular energy as part of chemical energy,
gravitational and mechanical as one, mechanical, and we can ignore nuclear and
mass energy. The six signal types (hence basic sensor types for our discussion) re-
present ‘measurands’ extracted from manufacturing processes that give us insight
into the operation of the process. These measurands represent measurable ele-
ments of the process and, further, derive from the basic information conversion
technique of the sensor. That is, depending on the sensor, we will probably have
differing measurands from the process. However, the range of measurands avail-
able is obviously closely linked to the type of (operating principle) of the sensor
employed. Table 1.2-2, adapted from [7], defines the relevant measurands from a
range of sensing technologies. The ‘mapping’ of these measurand/sensing pairs
on to a manufacturing process is the basis of developing a sensing strategy for a
process or system. The measurands give us important information on the:
· process (the electrical stability of the process, in electrical discharge machining,
for example),
· effects of outputs of the process (surface finish, dimension, for example), and
· state of associated consumables (cutting fluid contamination, lubricants, tool-
ing, for example).
1.2 Principles of Sensors in Manufacturing 11
Tab. 1.2-1 Forms of energy converted by sensors
Energy form Definition
Atomic Related to the force between nuclei and electrons
Electrical Electric fields, current, voltage, etc.
Gravitational Related to the gravitation attraction between a mass and the Earth
Magnetic Magnetic fields and related effects
Mass Following relativity theory (E=mc
2
)
Mechanical Pertaining to motion, displacement/velocity, force, etc.
Molecular Binding energy in molecules
Nuclear Binding energy in electrons
Radiant Related to electromagnetic radiowaves, microwaves, infrared, visible
light, ultraviolet, x-rays and c-rays
Thermal Related to the kinetic energy of atoms and molecules
1 Fundamentals12
Tab. 1.2-2 Process measurands associated with sensor signal types (after [7])
Signal output type Associated process measurands
Mechanical (includes acoustic) Position (linear, angular)
Velocity
Acceleration
Force
Stress, pressure
Strain
Mass, density
Moment, torque
Flow velocity, rate of transport
Shape, roughness, orientation
Stiffness, compliance
Viscosity
Crystallinity, structural integrity
Wave amplitude, phase, polarization, spectrum
Wave velocity
Electrical Charge, current
Potential, potential difference
Electric field (amplitude, phase, polarization, spectrum)
Conductivity
Permittivity
Magnetic Magnetic field (amplitude, phase, polarization, spectrum)
Magnetic flux
Permeability
Chemical (includes biological) Components (identities, concentrations, states)
Biomass (identities, concentrations, states)
Radiation Type
Energy
Intensity
Emissivity
Reflectivity
Transmissivity
Wave amplitude, phase, polarization, spectrum
Wave velocity
Thermal Temperature
Flux
Specific heat
Thermal conductivity
Finally, there are a number of technical specifications of sensors that must be ad-
dressed in assessing the ability of a particular sensor/output combination to mea-
sure robustly the state of the process. These specifications relate to the operating
characteristics of the sensors and are usually the basis for selecting a particular
sensor from a specific vendor, eg [7]:
· ambient operating conditions;
· full-scale output;
· hysteresis;
· linearity;
· measuring range;
· offset;
· operating life;
· output format;
· overload characteristics;
· repeatability;
· resolution;
· selectivity;
· sensitivity;
· response speed (time constant);
· stability/drift.
It is impossible to detail the associated specifications for the six sensing technolo-
gies under discussion here. A number of references have done this for specific
sensors for manufacturing applications, eg, Shiraishi [8–10] and Allocca and
Stuart [2]. Others are referenced elsewhere in this volume or reviewed in [11].
1.2.3
Basic Sensor Types
1.2.3.1 Mechanical Sensors
Mechanical sensors are perhaps the largest and most diverse type of sensors be-
cause, as seen in Table 1.2-2, they have the largest set of potential measurands.
Force, motion, vibration, torque, flow, pressure, etc., are basic elements of most
manufacturing processes and of great interest to measure as an indication of pro-
cess state or for control. Force is a push or pull on a body that results in motion/
displacement or deformation. Force transducers, a basic mechanical sensor, are
designed to measure the applied force relative to another part of the machine
structure, tooling, or workpiece as a result of the behavior of the process. A num-
ber of mechanisms convert this applied force (or torque) into a signal, including
piezoelectric crystals, strain gages, and potentiometers (as a linear variable differ-
ential transformer (LVDT)). Displacement, as in the motion of an axis of a ma-
chine, is measurable by mechanical sensors (again the LVDT or potentiometer) as
well as by a host of other sensor types to be discussed. Accelerometer outputs, dif-
ferentiated twice, can yield a measure of displacement of a mechanism. Shiraishi
[9] relies on a number of mechanical sensing elements to measure the dimen-
1.2 Principles of Sensors in Manufacturing 13
sions of a workpiece. Flow is commonly measured by ‘flow meters’, mechanical
devices with rotameters (mechanical drag on a float in the fluid stream) as well as
venturi meters (relying on differential pressure measurement, using another me-
chanical sensor) to determine the flow of fluids. An excellent review of other me-
chanical sensing (and transducing) devices is given in [2].
Mechanical sensors have seen the most advances owing to the developments in
semiconductor fabrication technology. Piezo-resistive and capacitance-based de-
vices, basic building blocks of silicon micro-sensors, are now routinely applied to
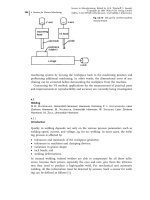
pressure, acceleration, and flow measurements in machinery. Figure 1.2-2a shows
the schematics of a capacitive sensor with applications in pressure sensing (the
silicon diaphragm deflects under the pressure of the gas/fluid and modifies the
capacitance between the diaphragm and another electrode in the device). Using a
beam with a mass on the end as one plate of the capacitor and a second electrode
(Figure 1.2-2 b), an accelerometer is constructed and the oscillation of the mass/
beam alters the capacitance in a measurable pattern allowing the determination of
the acceleration. Figure 1.2-3 shows a TRW NovaSensor
®
, a miniature, piezoresis-
tive chip batch fabricated and diced from silicon wafers. These sensor chips can
be provided as basic original equipment manufacturer (OEM) sensor elements or
can be integrated into a next-level packaging scheme. These devices are con-
1 Fundamentals14
Fig. 1.2-2 Schematic of a capacitance sensor for (a) pressure and (b) acceleration
structed using conventional semiconductor fabrication technologies based on the
semiconducting materials and miniaturization of very large scale integrated
(VLSI) patterning techniques (see, for example, Sze [1] as an excellent reference
on semiconductor sensors). The development of microelectromechanical sensing
systems (so-called MEMS) techniques has opened a wide field of design and appli-
cation of special micro-sensors (mechanical and others) for sophisticated sensing
tasks. Figure1.2-4 shows a MEMS gyroscope fabricated at UC Berkeley BSAC for
use in positioning control of shop-floor robotic devices. In fact, most of the six
1.2 Principles of Sensors in Manufacturing 15
Fig. 1.2-3 Piezoresistive micro-
machined pressure die. Courtesy
of Lucas NovaSensor, 2000
Fig. 1.2-4 Detail of MEMS gyroscope chip
(0.5 cm´ 0.5 cm) with 2 lm feature size. Cour-
tesy Wyatt Davis, BSAC, UC Berkeley, 2000
basic sensor types can be accommodated by this technology. Accelerometers are
built on these chips as already discussed. Whatever affects the frequency of oscil-
lation of the silicon beam of the sensor can be considered a measurand. Coating
the accelerometer beam with a material that absorbs certain chemical elements,
hence changing the mass of the beam and its resonant frequency, changes this
into a chemical sensor. Similar modifications yield other sensor types.
One particularly interesting type of micro-sensor for pressure applications, not
based on the capacitance principles discussed above, is silicon-on-sapphire (SOS).
This is specially applicable to pressure-sensing technology. Manufacturing an SOS
transducer begins with a sapphire wafer on which silicon is epitaxially grown on
the smooth, hard, glass-like surface of the sapphire. Since the crystal structure of
the silicon film is similar to sapphire’s, the SOS structure appears to be one crys-
tal with a strong molecular bond between the two materials. The silicon is then
etched into a Wheatstone bridge pattern using conventional photolithography
techniques. Owing to its excellent chemical resistance and mechanical properties,
the sapphire wafer itself may be used as the sensing diaphragm. An appropriate
diaphragm profile is generated in the wafer to create the desired flexure of the
diaphragm and to convey the proper levels of strain to the silicon Wheatstone
bridge. The diaphragm may be epoxied or brazed to a sensor package. A more re-
liable method of utilizing the SOS technology involves placing an SOS wafer on a
machined titanium diaphragm. In this configuration titanium becomes the pri-
mary load-bearing element and a thin (thickness under 0.01 in) SOS wafer is
used as the sensing element. The SOS wafer is bonded to titanium using a pro-
cess similar to brazing, performed under high mechanical pressure and tempera-
ture conditions in vacuum to ensure a solid, stable bond between the SOS wafer
and the titanium diaphragm. The superb corrosion resistance of titanium allows
compatibility with a wide range of chemicals that may attack epoxies, elastomers,
and even certain stainless steels. The titanium diaphragm is machined using con-
ventional machining techniques and the SOS wafer is produced using conven-
tional semiconductor processing techniques. SOS-based pressure sensors with op-
erating pressures ranging from 104 kPa to over 414 MPa are available.
Acoustic sensors have benefited from the developments in micro-sensor tech-
nology. Semiconductor acoustic sensors employ elastic waves at frequencies in the
range from megahertz to low gigahertz to measure physical and chemical (in-
cluding biological) quantities. There are a number of basic types of these sensors
based upon the mode of flexure of an elastic membrane or bulk material in the
sensor is employed. Early sensors of this type used vibrating piezoelectric crystal
plates referred to as a quartz crystal microbalance (QCM). It is also called a thick-
ness shear-mode sensor (TSM) after the mode of particle motion employed. Other
modes of acoustic wave motion employed in these devices (with appropriate de-
sign) include surface acoustic wave (SAW) for waves travelling on the surface of a
solid, and elastic flexural plate wave (FPW) for waves travelling in a thin mem-
brane. The cantilever devices described earlier are also in this class.
1 Fundamentals16
1.2.3.2 Thermal Sensors
Thermal sensors generally function by transforming thermal energy (or the ef-
fects of thermal energy) into a corresponding electrical quantity that can be
further processed or transmitted. Other techniques for sensing thermal energy (in
the infrared range) are discussed under radiant sensors below. Typically, a non-
thermal signal is first transduced into a heat flow, the heat flow is converted into
a change in temperature/temperature difference, and, finally, this temperature dif-
ference is converted into an electrical signal using a temperature sensor. Micro-
sensors employ thin membranes (floating membrane cantilever beam, for exam-
ple). There is a large thermal resistance between the tip of the beam and the base
of the beam where it is attached to the device rim. Heat dissipated at the tip of
the beam will induce a temperature difference in the beam. Thermocouples
(based on the thermoelectric Seebeck effect whereby a temperature difference at
the junction of two metals creates an electrical voltage) or transistors are em-
ployed to sense the temperature difference in the device outputting an electrical
signal proportional to the difference. Recent advances in thermal sensor applica-
tion to the ‘near surface zone’ of materials for assessing structural damage (re-
ferred to as photo-thermal inspection) were reported by Goch et al. [12]. This re-
view also covers other measurement techniques such as micromagnetic.
Thermal sensors are also employed in flow measurement following the well-
known principle of cooling of hot objects by the flow of a fluid (boundary layer
flow measurement anemometers). They can also be applied in thermal tracing
and heat capacity measurements in fluids. All three application areas are suitable
for silicon micro-sensor integration.
Thermal sensors have also found applicability traditionally in ‘true-rms conver-
ters’. Root mean square (rms) converters are used to convert the effective value of
an alternating current (AC) voltage or current to its equivalent direct current (DC)
value. This is accomplished simply by converting the electrical signal into heat
with the assistance of a resistor and measuring the temperature generated.
1.2.3.3 Electrical Sensors
Electrical sensors are intended to determine charge, current, potential, potential
difference, electric field (amplitude, phase, polarization, spectrum), conductivity
and permittivity and, as such, have some overlap with magnetic sensors. Power
measurement, an important measure of the behavior of many manufacturing pro-
cesses, is also included here. An example of the application of thermal sensors for
true rms power measurement was included with the discussion on thermal sen-
sors. The use of current sensors (perhaps employing principles of magnetic sens-
ing technology) is commonplace in machine tool monitoring [11]. Electrical resis-
tance measurement has also been widely employed in tool wear monitoring appli-
cations [8]. Most of the discussion on magnetic sensors below is applicable here
in consideration of the mechanisms of operation of electrical sensors.
1.2 Principles of Sensors in Manufacturing 17
1.2.3.4 Magnetic Sensors
A magnetic sensor converts a magnetic field into an electrical signal. Magnetic
sensors are applied directly as magnetometers (measuring magnetic fields) and
data reading (as in heads for magnetic data storage devices). They are applied in-
directly as a means for detecting nonmagnetic signals (eg, in contactless linear/
angular motion or velocity measurement) or as proximity sensors. Most magnetic
sensors utilize the Lorenz force producing a current component perpendicular to
the magnetic induction vector and original current direction (or a variation in the
current proportional to a variation in these elements). There are also Hall effect
sensors. The Hall effect is a voltage induced in a semiconductor material as it
passes through a magnetic field. Magnetic sensors are useful in nondestructive in-
spection applications where they can be employed to detect cracks or other flaws
in magnetic materials due to the perturbation of the magnetic flux lines by the
anomaly. Semiconductor-based magnetic sensors include thin-film magnetic sen-
sors (relying on the magnetoresistance of NiFe thin films), semiconductor mag-
netic sensors (Hall effect), optoelectronic magnetic sensors which use light as an
intermediate signal carrier (based on Faraday rotation of the polarization plane of
linearly polarized light due to the Lorenz force on bound electrons in insulators
[1]) and superconductor magnetic sensors (a special class).
1.2.3.5 Radiant Sensors
Radiation sensors convert the incident radiant signal energy (measurand) into
electrical output signals. The radiant signals are either electromagnetic, neutrons,
fast neutrons, fast electrons, or heavy-charge particles [1]. The range of electro-
magnetic frequencies is immense, spanning from cosmic rays on the high end
with frequencies in the 10
23
Hz range to radio waves in the low tens of thousands
of Hz. In manufacturing applications we are most familiar with infrared radiation
(10
11
–10
14
Hz) as a basis for temperature measurement or flaw/problem detec-
tion. Silicon-on-insulator photodiodes and phototransistors based on transistor ac-
tion are typical micro-sensor radiant devices [1] for use in these ranges.
1.2.3.6 Chemical Sensors
These sensors are becoming particularly more important in manufacturing pro-
cess monitoring and control. It is important to measure the identities of gases
and liquids, concentrations, and states, chemical sensors for worker safety (to in-
sure no exposure to hazardous materials or gases), process control (to monitor,
for example, the quality of fluids or gases used in production; this is especially
critical in the semiconductor industry which relies on complex process ‘recipes’
for successful production), and process state (presence or absence of a material,
eg, gas or fluid). Chemical sensors have been successfully produced as micro-sen-
sors using semiconductor technologies primarily for the detection of gaseous spe-
cies. Most of these devices rely on the interaction of chemical species at semicon-
ductor surfaces (adsorption on a layer of material, for example) and then the
1 Fundamentals18
change caused by the additional mass affecting the performance of the device.
This was discussed under mechanical sensors where the change in mass altered
the frequency of vibration of a silicon cantilever beam providing a means for mea-
suring the presence or absence of the chemical and some indication of the con-
centration. Other chemical effects are also employed such as resistance change
caused by the chemical presence, the semiconducting oxide powder- pressed pellet
(so called Taguchi sensors) and the use of field effect transistors (FETs) as sensi-
tive detectors for some gases and ions. Sze [1] gives a comprehensive review of
chemical micro-sensors and the reader is referred to this for details of this com-
plex sensing technology.
1.2.4
New Trends – Signal Processing and Decision Making
1.2.4.1 Background
Human monitoring of manufacturing processes can attribute its success to the
ability of the human to distinguish, by nature of the physical senses and experi-
ence, the ‘significant’ information in what is observed from the meaningless. In
general, humans are very capable as process monitors because of the high degree
of development of sensory abilities, essentially noise-free data (unique memory
triggers), parallel processing of information, and the knowledge acquired through
training and experience. Limitations are seen when one of the basic human sen-
sor specifications is violated; something happening too fast to see or out of range
of hearing or visual sensitivity owing to frequency content. These limitations have
always served as some of the justification for the use of sensors. Sensors, of
course, are also limited in their ability to yield an output sensitive to an important
input. Hence we need to consider the use of signal processing and along with
that feature extraction. In most cases the utilization of any signal processing
methodology has as its goal one or more of the following: the determination of a
suitable ‘process model from which the influence of certain process variables can
be discerned; the generation of features from sensor data that can be used to de-
termine process state; or the generation of data features so that the change in the
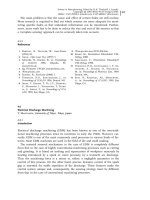
performance of the process can be ‘tracked. Figure 1.2-5 shows the path from pro-
cess (and the source of the measurants) through the sensor, extraction of a con-
trol signal, and application to process control for both heuristic and quantitative
methodologies.
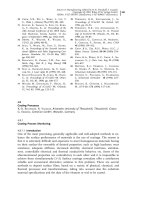
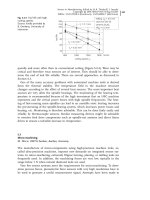
An overview of signal processing and feature extraction is summarized in Rang-
wala [13] (Figure 1.2-6). The measurement vector extracted from the signal repre-
sentation from the sensor (basic signal conditioning) is the ‘feedstock’ for the fea-
ture selection process (local conditioning) resulting in a feature vector. The charac-
teristics of the feature vector include signal elements that are sensitive to the pa-
rameters of interest in the process. The ‘decision-making’ process follows. Based
on a suitable ‘learning’ scheme which maps a teaching pattern (ie, process charac-
teristics that we desire to recognize) on to the feature vector, a pattern association
is generated. The ‘pattern association’ contains a matrix of associations between
1.2 Principles of Sensors in Manufacturing 19
the desired characteristics and features of the sensor information. In application,
the pattern association matrix operates on the feature vector and extracts correla-
tion between features and characteristics – these are taken to be ‘decisions’ on the
state of the process if the process characteristics are suitably structured (eg, tool
worn, weld penetration incomplete, material flawed, etc.). In Figure 1.2-6, the
measurement vector is the signal in the upper left corner. The feature vector in
this case consists of the mean value shown in the upper right corner. Decision
making, based on experience or ‘training’, sets the threshold at a level correspond-
ing to excessive tool wear. When the feature element ‘mean value’ crosses the
1 Fundamentals20
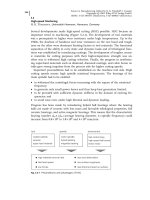
Fig. 1.2-5 Quantitative and heuristic paths for the development of in-process monitoring and
control methodologies
Fig. 1.2-6 An overview of signal
processing and feature extraction
threshold a ‘decision’ is made that the tool is worn. The success of this strategy
depends upon the degree to which the mean value of the sensor output actually
represents the state (and progress) of tool wear.
1.2.4.2 Sensor Fusion
With a specific focus for the monitoring in mind, researchers have developed over
the years a wide variety of sensors and sensing strategies, each attempting to pre-
dict or detect a specific phenomenon during the operation of the process and in
the presence of noise and other environmental contaminants. A good number of
these sensing techniques applicable to manufacturing have been reviewed in the
early part of this chapter. Although able to accomplish the task for a narrow set of
conditions, these specific techniques have almost uniformly failed to be reliable
enough to work over the range of operating conditions and environments com-
monly available in manufacturing facilities. Therefore, researchers have begun to
look at ways to collect the maximum amount of information about the state of a
process from a number of different sensors (each of which is able to provide an
output related to the phenomenon of interest although at varying reliability). The
strategy of integrating the information from a variety of sensors with the expecta-
tion that this will ‘increase the accuracy and . . . resolve ambiguities in the knowl-
edge about the environment’ (Chiu et al. [14]) is called sensor fusion.
Sensor fusion is able to provide data for the decision-making process that has a
low uncertainty owing to the inherent randomness or noise in the sensor signals,
includes significant features covering a broader range of operating conditions, and
accommodates changes in the operating characteristics of the individual sensors
(due to calibration, drift, etc.) because of redundancy. In fact, perhaps the most
advantageous aspect of sensor fusion is the richness of information available to
the signal processing/feature extraction and decision-making methodology em-
ployed as part of the sensor system. Sensor fusion is best defined in terms of the
‘intelligent’ sensor as introduced in [15] since that sensor system is structured to
utilize many of the same elements needed for sensor fusion.
The objective of sensor fusion is to increase the reliability of the information so
that a decision on the state of the process is reached. This tends to make fusion
techniques closely coupled with feature extraction methodologies and pattern rec-
ognition techniques. The problem here is to establish the relationship between
the measured parameter and the process parameter. There are two principal ways
to encode this relationship (Rangwala [13]):
· theoretical – the relationship between a phenomenon and the measured param-
eters of the process (say tool wear and the process); and
· empirical – experimental data is used to tune parameters of a proposed model.
As mentioned earlier, reliable theoretical models relating sensor output and pro-
cess characteristics are often difficult to develop because of the complexity and
variability of the process and the problems associated with incorporating large
numbers of variables in the model. As a result, empirical methods which can use
1.2 Principles of Sensors in Manufacturing 21
sensor data to tune unknown parameters of a proposed relation are very attrac-
tive. These types of approaches can be implemented by either (a) proposing a rela-
tionship between a particular process characteristic and sensor outputs and then
using experimental data to tune unknown parameters of a model, or (b) associat-
ing patterns of sensor data with an appropriate decision on the process state with-
out consideration of any model relating sensor data to the state. The second
approach is generally referred to as pattern recognition and involves three critical
stages (Ahmed and Rao [16]):
· sampling of input signal to acquire the measurement vector;
· feature selection and extraction;
· classification in the feature space to permit a decision on the process state.
The pattern recognition approach provides a framework for machine learning and
knowledge synthesis in a manufacturing environment by observation of sensor
data and with minimal human intervention. More important, such an approach
allows for integration of information from multiple sources (such as different sen-
sors) which is our principal interest here.
Sata et al. [17, 18] were among the first researchers to propose the application
of pattern recognition techniques to machine process monitoring. They attempted
to recognize chip breakage, formation of built-up edge and the presence of chatter
in a turning operation using the features of the spectrum of the cutting force in
the 0–150 Hz range. Dornfeld and Pan [19] used the event rate of the rms energy
of an acoustic emission signal along with feed rate and cutting velocity in order to
provide a decision on the chip formation produced during a turning operation.
Emel and Kannatey-Asibu [20] used spectral features of the acoustic emission sig-
nal in order to classify fresh and worn cutting tools. Balakrishnan et al. [21] use a
linear discriminant function technique to combine cutting force and acoustic
emission information for cutting tool monitoring.
The manufacturing process may be monitored by a variety of sensors and, typi-
cally, the sensor output is a digitized time-domain waveform. The signal can then
be either processed in the time domain (eg, extract the time series parameters of
the signal) or in the frequency domain (power spectrum representation). The ef-
fect of this is to convert the original time-domain record into a measurement vec-
tor. In most cases, this mapping does not preserve information in the original sig-
nal. Usually, the dimension of the measurement vector is very high and it be-
comes necessary to reduce this dimension due to computational considerations.
There are two prevalent approaches at this stage: select only those components of
the measurement vector which maximize the signal-to-noise ratio or map the
measurement vector into a lower dimensional space through a suitable transfor-
mation (feature extraction). The outcome of the feature selection/extraction stage
is a lower dimensional feature vector. These features are used in pattern recogni-
tion techniques and as inputs to sensor fusion methodologies. This was illus-
trated in Figure 1.2-6.
1 Fundamentals22
1.2.5
Summary
The subject of sensors for manufacturing processes is well covered in other chapters
of this book. The material in this chapter serves to acquaint the reader with the clas-
sification of sensor systems and some of the measurands that are associated with
these sensors. How these sensor types and measurands map on to the various man-
ufacturing processes will be the subject of the rest of the text. One important factor
in the implementation of sensors in manufacturing is clearly the rapid growth of
silicon micro-sensors based on MEMS technology. This technology already allows
the integration of traditional and novel new sensing methodologies on to miniatur-
ized platforms, providing in hardware the reality of multi-sensor systems. Further,
since these sensors are easily integrated with the electronics for signal processing
and data handling, on the same chip, sophisticated signal analysis including feature
extraction and intelligent processing will be straightforward (and inexpensive). This
bodes well for the vision of the intelligent factory with rapid feedback of vital infor-
mation to all levels of the operation from machine control to process planning.
1.2 Principles of Sensors in Manufacturing 23
1.2.6
References
1 Sze, S. M. (ed.) Semiconductor Sensors;
New York: Wiley, 1994.
2 Allocca, J. A., Stuart, A., Transducers:
Theory and Applications; Reston, VA: Re-
ston Publishing, 1984.
3 Bray, D. E., McBride, D. (eds.) Nondes-
tructive Testing Techniques; New York: Wi-
ley, 1992.
4 Webster’s Third New International Diction-
ary; Springfield, MA: G. C. Merriam, 1971.
5 Usher, M. J., Sensors and Transducers; New
Hampshire: Macmillan, 1985.
6 Middlehoek, S., Audet, S.A., Silicon
Sensors; New York: Academic Press, 1989.
7 White, R. M., IEEE Trans. Ultrason. Fero-
elect. Freq. Contr. UFFC-34 (1987) 124.
8 Shiraishi, M., Precision Eng. 10(4) (1988)
179–189.
9 Shiraishi, M., Precision Eng. 11(1) (1989)
27–37.
10 Shiraishi, M., Precision Eng. 11(1) (1989)
39–47.
11 Byrne, G., Dornfeld, D., Inasaki, I.,
Kettler, G., König, W., Teti, R., Ann.
CIRP 44(2) (1995) 541–567.
12 Goch, G., Schmitz, B., Karpuschewski,
B., Geerkins, J., Reigel, M., Sprongl,
P., Ritter, R., Precision Eng. 23 (1999) 9–33.
13 Rangwala, S., PhD Thesis; Department of
Mechanical Engineering, University of Ca-
lifornia, Berkeley, CA, 1988.
14 Chiu, S. L., Morley, D. J., Martin, J. F.,
in: Proceedings of 1987 IEEE International
Conference on Robotics and Automation; Ra-
leigh, NC: IEEE, 1987, pp. 1629–1633.
15 Dornfeld, D.A., Ann. CIRP 39 (1990)
16 Ahmed, N., Rao, K. K., Orthogonal Trans-
forms for Digital Signal Processing; New
York: Springer, 1975.
17 Sata, T., Matsushima, K., Nagakura, T.,
Kono, E., Ann. CIRP 22(1) (1973) 41–42.
18 Matsushima, K., Sata, T., J. Fac. Eng.
Univ. Tokyo (B) 35(3) (1980) 395–405.
19 Dornfeld, D.A., Pan, C. S., in: Proceedings
of 13th North American Manufacturing Re-
search Conference, University of California,
Berkeley, CA: SME, 1985, pp. 285–303.
20 Emel, E., Kannatey-Asibu, E., Jr., in: Pro-
ceedings of 14th North American Manufactur-
ing Research Conference, University of Min-
nesota, MN: SME, 1986, pp. 266–272.
21 Balakrishnan, P., Trabelsi, H., Kanna-
tey-Asibu, Jr., E., Emel, E., in: Proceedings
of 15th NSF Conference on Production Re-
search and Technology, University of Cali-
fornia, Berkeley, CA: SME, 1989, pp. 101–
108.