Nuclear Power Deployment Operation and Sustainability Part 9 docx
Bạn đang xem bản rút gọn của tài liệu. Xem và tải ngay bản đầy đủ của tài liệu tại đây (2.21 MB, 35 trang )
Effects of the Operating Nuclear Power Plant
on Marine Ecology and Environment - A Case Study of Daya Bay in China
269
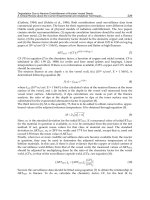
indicate there was a small decreasing trend in the dissolved oxygen (DO), the seawater of
Daya Bay was also within the First Class of National Seawater Quality Standards for China
(6.00 mg l
-1
, GB3097-1997) (Wang et al., 2003, Wang et al., 2006, 2008, 2011). Annual mean pH
variation was at 8.15 to 8.25 from 1982 to 2004, with a little change in Daya Bay (Fig.10). The
results also indicated that ocean acidification is very clear in Daya Bay (Kerr, 2010).
0
1
2
3
4
5
6
7
8
9
10
1982 1985 1991 1998 1999 2000 2001 2002 2003 2004 Mean
Year
DO, mg l-1
Spring
Summer
Autumn
Winter
Mean
Fig. 9. Dissolved oxygen of Daya Bay from 1982 to 2004 (Wang et al., 2008) (Unit: mg l
-1
).
7.7
7.8
7.9
8
8.1
8.2
8.3
8.4
8.5
1982 1986 1991 1998 1999 2000 2001 2002 2003 2004 Mean
Year
pH
Spring
Summer
Autumn
Winter
Mean
Fig. 10. pH of Daya Bay with different seasons from 1982 to 2004 (Wang et al., 2008).
Nuclear Power – Deployment, Operation and Sustainability
270
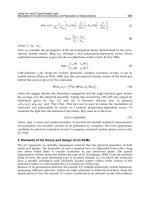
The chemical oxygen demand (COD) values were 0.63-1.18 mg l
-1
in Daya Bay from 1989 to
2004 (Fig.11, Wang et al., 2008). The mean chemical oxygen demand values were lower than
the other sea areas in China, such as the COD is between 2.90 mg dm
-3
and 7.50 mg dm
-3
in
the Pearl River Estuary (Lin & Li, 2003) and from 3.32 mg l
-1
to 4.01 mg l
-1
in Rongcheng Bay
in temperate zone (Mu et al., 1999). The chemical oxygen demand values also indicated that
the organic pollution in Daya Bay was much lower than the other sea areas in China. The
results of chemical oxygen demand in Daya Bay show that the sea water was also within the
First Class of National Seawater Quality Standards for China (≤2.00 mg l
-1
, GB3097-1997)
(Wang et al., 2003; Wang et al., 2006, 2008, 2011).
0
0.2
0.4
0.6
0.8
1
1.2
1.4
1989 1992 1998 1999 2001 2002 2003 2004 Mean
Year
COD, mg l-1
Fig. 11. Chemical oxygen demand of Daya Bay from 1989 to 2004 (Wang et al., 2008) (Unit:
mg l
-1
).
Inorganic N and P levels were low from 1.53 μmol l
-1
to 5.40 μmol l
-1
and from 0.0945 μmol l
-1
to 1.12 μmol l
-1
, and mean values were 3.68 μmol l
-1
and 0.266 μmol l
-1
from 1985 to 2004
within the National First Class Water Quality Standards for China (Wang et al., 2003; Wang
et al., 2008) (Table1). These results are similar to the inorganic N and P levels of Mirss Bay in
Hong Kong (Yin et al., 2003). NH
4
-N (about 49%) and NO
3
-N (about 43%) were the
dominant total inorganic nitrogen (TIN) form, which account for about 90% of the TIN and
8% of NO
2
-N in recent years. The NO
3
-N content was lower than the NH
4
-N, revealing a
thermodynamic imbalance between NH
4
-N, NO
2
-N and NO
3
-N. Biological activity might be
also the main factor influencing the balance (Huang et al., 2003; Wang et al., 2008), but there
were different degrees of transformation of NH
4
-N for the different bay regions. The
concentration of both N and Si were higher than inorganic P. Spatially the nutrients N
increases from 1985 to 2004 in Daya Bay, probably as results of the waste water of the people
lived along the coast, the land sources (such as Nanchong River, Longqi River and
Pengcheng River discharge into Dapeng Cove and unclear power plants waste water
Effects of the Operating Nuclear Power Plant
on Marine Ecology and Environment - A Case Study of Daya Bay in China
271
discharge into the south area of Daya Bay), seawater breed aquatics and the effect of the
water from the Preal River on Daya Bay (Han, 1991). The nutrient P decreased from 1.12
μmol l
-1
to 0.110 μmol l
-1
at 1985-2004 in Daya Bay, probably as a result of the fan-used
detergency powder contain-P in recent years. The average ratio of TIN/P increased from
1.377 in 1985 to 49.09 in 2004, and the highest value was 61.90 in 2003. The average ratio of
Si/P increased from 35.27 to 285.82 at 1985-2004 (Wang et al., 2008). The limiting nutrients in
Daya Bay has changed from N to P from 1985 to 2004 (Justice et al., 1995), and is different
from those at Jiaozhou Bay which shifted from N and/or P to Si from the 1960s to the 1990s
in temperate zone (Shen, 2001) and Sanya Bay which shifted from N in summer and autumn
to P in winter in Sanya Bay from 1998 to 2000 in tropic zone (Huang et al., 2003).
Year
4
NH
2
NO
3
NO
TIN
2
3
SiO
3
4
PO
TIN/P Si/P
1985 0.698 0.230 0.602 1.53 39.50 1.12 1.377 35.27
1989 0.607 1.10 1.52 3.23 10.85 0.377 8.560 28.78
1991 1.10 0.230 0.798 2.13 20.66 0.358 5.950 57.71
1997 1.38 0.150 2.55 4.08 14.57 0.122 33.44 119.43
1998 1.86 0.0554 0.433 2.35 5.125 0.0405 57.99 126.54
1999 1.99 0.389 2.46 4.84 9.810 0.118 40.02 76.46
2000 1.59 0.508 1.92 4.01 27.54 0.252 15.91 109.29
2001 2.28 0.134 1.93 4.33 23.21 0.229 18.91 101.35
2002 1.32 0.446 0.680 2.40 27.01 0.0945 25.40 285.82
2003
2004
2.54 0.260 3.39 6.19 23.06 0.100 61.90 230.60
3.06 0.085 2.25 5.40 12.82 0.110 49.09 116.54
Mean 1.68 0.326 1.68 3.68 19.47 0.266 28.96 117.07
*Quality Standards of Seawater from GB3097-1997, TIN: China first class (μmol l
-1
) ≤14.28, second class
(μmol l
-1
) ≤21.43; PO
4
-P: China first class (μmol l
-1
) ≤0.4839, second class (μmol l-
-1
) ≤0.9677.
Table 1. Concentrations of different forms N, SiO
3
-Si and PO
4
-P in Daya Bay at 1985-2004
(Wang et al., 2008) (Unit: mol l
-1
).
Phylum 1982 1983 1985 1987 1990 1994 1998 2002 2003 2004
Bacillario-
phyta
37/134 38/120 38/127 41/137 37/140 25/78 24/72 25/96 31/92 34/100
Pyrophyta 9/25 9/32 8/30 8/27 17/61 10/30 5/8 9/27 12/30 8/23
Cyanophyta 0 1/3 1/3 2/4 2/5 1/2 0 2/4 2/3 2/3
Total (Genera
/ Species)
46/159 48/155 49/160 51/168 56/206 36/110 29/80 36/127 46/125 44/126
Table 2. Species, genera of the phytoplankton of Daya Bay from 1982 to 2004 (Wang et al.,
2008).
About 300 species of phytoplankton have been identified in Daya Bay since 1982 (Xu, 1989;
Wang et al., 2008). They belong to Cyanophyta, Bacillariophyta, Pyrophyta, Chrysophyta and
Xanthophyta etc. Most of them are diatoms (about 70%) and chaetocero (about 20%). Of the
183 species of diatoms, chaetoceros had many more species than other genera (45 spp),
followed by Rhizosolenia (23 spp) and Coscinodiscus (22 spp) (Yang, 1990; Wang et al., 2008).
Nuclear Power – Deployment, Operation and Sustainability
272
The main dominant species of Daya Bay are Chaetoceros, Nitzschia, Rhizosolenia,
Leptocylindrus and Skeletonema, such as Chaetoceros affinis, Chaetoceros compressus, Chaetoceros
lorenzianus, Ch. Curvisetus, Ch. Pseudocurvisetus, Rhiz. alata f.grecillisma, Nitzschia delicatissima,
Leptocylindrus danicua, Skeletonema costatum and Thalassionema nitzschioide, the chaetocero is
Ceratium sp. as the dominant species. The phytoplankton species have been gradually
decreasing since 1990s as compared to those during 1980s (Table 2). In particularly, there
was only 80 species in 1998. The phytoplankton cell density has been also gradually
decreasing since 1998 compared with 1985. Annual mean values of the phytoplankton in
Daya Bay were between 8.8810
5
and 6.6310
7
cells m
-3
at 1985-2004. Phytoplankton
abundance peaked in spring at 1.0310
8
cells m
-3
in 1985 (Table 3) and was lowest in spring
at 7.3010
4
cells m
-3
(1/1411) in 1999. Although the mean annual abundances of
phytoplankton show a slight decrease trend from 1999 to 2004, species and values of the
phytoplankton of Daya Bay were increasing that might be due to high ratios of TIN to P and
Si to P occurring in recent years (Sommer et al., 2002). Annual mean values of chlorophyll a
were 1.83-3.78 mg m
-3
in different seasons from 1985 to 2004, the higher values were always
found in autumn and summer. The nutrient structure has become more balanced for
phytoplankton growth (Shen, 2001).
Season Production 1985 1998 1999 2000 2001 2002 2003 2004
Spring
Chl a (mg m
-3
) 2.06 1.46 2.00 0.979 1.49 0.830 5.88 1.94
Phytoplankton
(cells m
-3
)
1.0310
8
2.1610
7
7.3010
4
5.2710
6
6.5910
5
1.7110
6
1.5310
5
3.4310
6
Zooplankton (ind m
-3
) 109.20 28.90 – 90.00 34.97 135.29 137.58 204.67
Summer
Chl a (mg m
-3
) 2.36 1.44 3.44 4.07 1.32 6.09 1.91 3.93
Phytoplankton
(cells m
-3
)
9.6110
7
7.5910
5
6.2810
5
5.2510
7
9.3110
5
1.8710
6
2.4510
6
1.6610
7
Zooplankton (ind m
-3
) 578.90 82.70 – – 404.08 248.62 191.97 131.33
Autumn
Chl a (mg m
-3
) 1.19 3.50 4.69 3.46 2.25 2.82 1.44 1.67
Phytoplankton
(cells m
-3
)
1.5310
7
6.0010
6
1.0210
6
3.8610
5
5.6310
5
3.7010
5
1.9910
5
3.4910
5
Zooplankton (ind m
-3
) 523.90 43.65 – – 131.11 258.80 58.41 581.15
Winter
Chl a (mg m
-3
) 1.70 1.77 5.01 1.85 2.81 2.98 3.32 2.06
Phytoplankton
(cells m
-3
)
3.7710
7
6.7310
6
1.8310
6
8.4910
4
2.7410
6
6.2110
5
2.2410
6
3.6310
6
Zooplankton (ind m
-3
) 189.30 66.41 94.72 – 204.16 455.54 309.32 619.05
Mean
Chl a (mg m
-3
)
Phytoplankton
(cells m
-3
)
Zooplankton (ind m
-3
)
1.83
6.3010
7
352.70
2.04
8.7710
6
55.42
3.78
8.8810
5
94.72
2.63
1.4610
7
90.00
1.97
1.2210
6
193.58
3.18
1.1410
6
283.56
3.14
1.6010
6
174.32
2.40
6.0010
6
384.05
Table 3. Seasonal production measurements in Daya Bay from 1985 to 2004 (Wang et al.,
2008).
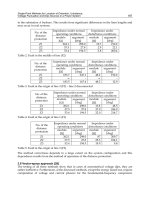
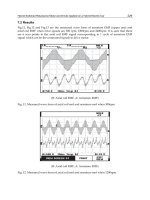
Seasonal changes of chlorophyll a near the nuclear power plant are shown in Fig.12 (Wang
et al., 2008). Annual mean values of chlorophyll a near Nuclear Power Plant were 1.37-2.45
mg m
-3
before operation and 2.46-3.34 mg m
-3
after operation the first Nuclear Power Plant
at 1991-1997. Seasonal changes of primary productivity near the nuclear power plant are
very different between before operation and after operation the first Nuclear Power Plant at
1991-1997 (Fig.13). The waste warm water can give an increase for chlorophyll a and
primary productivity near the nuclear power plants. The waster warm water can provide
extra amount of energy for phytoplankton growth (Wang et al., 2006).
Effects of the Operating Nuclear Power Plant
on Marine Ecology and Environment - A Case Study of Daya Bay in China
273
265 species of zooplankton sampled from Daya Bay have been studied since 1982 (Wang et al.,
2008). They can be divided into four ecological forms: estuary and inner bay type, warm
coastal type and warm open sea type (Lian et al., 1990). The latter two types account for most
of the species. Variations of dominant species exhibited a seasonal succession. The abundance
of zooplankton varied seasonally, the maximum number of individuals occurred in autumn.
Although main species of the zooplankton in Daya Bay had a decreasing trend from 46 of 60
familiar species in 1983 to 36 of 60 familiar species in 2004 (Fig.14), the annual mean individual
0
1
2
3
4
5
6
1991-1992 1992-1993 1994-1995 1996-1997
Year
Chlorophyll a, mg/m
3
Spring
Summer
Autumn
Winter
Mean
Fig. 12. Seasonal changes of chlorophyll a near the Nuclear Power Plant (mg/m
3
).
1
10
100
1000
1991-1992 1992-1993 1994-1995 1996-1997
Year
Primary productivity, mg•c/m
2
•d
Spring
Summer
Autumn
Winter
Mean
Fig. 13. Seasonal changes of primary productivity near the Nuclear Power Plant
(mg·c/m
2
·d).
Nuclear Power – Deployment, Operation and Sustainability
274
number of zooplankton has been gradually increasing from 55.42 ind m
-3
to 384.05 ind m
-3
since 1998, and the value in 2004 has already exceed the 352.70 ind m
-3
level in 1985 (Table
3). One reason might be the strictly enforced regulations relating to the marine environment
and fisheries from June to August in each year since 1995, and another reason might be high
levels of plant nutrients and high ratios of Si to N and P, most phytoplankton falls into the
food spectrum of herbivorous, crustacean zooplankton in recent years (Sommer et al., 2002,
2008).
0
10
20
30
40
50
60
1983 1987 1990 1994 1998 2002 2003 2004
Year
Species
Fig. 14. Main species of the familiar zooplankton of Daya Bay changed from 1983 to 2004
(Wang et al., 2008).
Individual biomass changes of the zooplankton are shown in near the Nuclear power plant
in Fig.15. Compared with the mean individual biomass of the zooplankton between 1982 to
1991 (from 392.25 ind/m
3
to 680.75 ind/m
3
) before operation, it is very lower for 341 ind/m
3
in 1994-1995 after the operation near the Nuclear power plant. The waste warm water is not
good for zooplankton growth, especially in summer and autumn of each year. The waste
warm water, which discharged to the south area of Daya Bay from the Nuclear Power
Plants, directly impacts on zooplankton growth (Zheng et al., 2001).
A total of 328 species of fish were captured from 1985 to 2004, and 304 species of fishes were
identified, including many edible species of high economic value such as Sardinella jussieu
Clupanodon punctatus, Nematalosa nasus, Thrissa setirostris, Thrissa dussumieri, Thrissa
kammalensis, Thrissa hamiltonii, Thrissa vitirostris, Harpodon nehereus, Plotosus anguillaris,
Lactarius lactarius, Caranx (atule) kalla, Pseudosciaena arocea, Leioganthus rivulatus, Pagrosomus
major, Rhabdosargus sarba, Siganus oramin, Trichiurus haumela, Stromateoides argenteus,
Stromateoides nozawae, Stromateoides sinensis and Lagocephalus lunaris spsdiceus (Wang et al.,
2008). The dominant species were perciformes including the warm-water and warm–and-
temperate-water species accounted for about 90% and 10% in Daya Bay. The main fishes
were about 20-28 species of 47 main species of fishes were captured in Daya Bay from 1985
to 2004 (Fig.16). Through the main species of fishes have a small change in Daya Bay from
Effects of the Operating Nuclear Power Plant
on Marine Ecology and Environment - A Case Study of Daya Bay in China
275
1985 to 2004, the amount of the edible fish natural resource has decreased greatly from 1985
to 2000. The mean individual weight of the fish changed from 14.60 g tail
-1
in 1985 to 10.80 g
tail
-1
in 2004 (Table 4). Although a policy to ban-fishing in the China Sea was put in practice
from July to August since 1995, the amount of the fish natural resource has recovered slowly
because of excessive catching and pollution, speciealy in 1987-2000. The investigation data
show that Daya Bay has a sandy bottom with coral reefs and an environment suitable for
growth, the fish resources are abundant as compared to those in other bays in China that
have less suitable environments. For example, there were only 91 species in Jiaozhou Bay in
the temperate zone of China (Zhou, 1984).
1
10
100
1000
10000
1982-1983 1983-1984 1990-1991 1994-1995
Year
Individual biomass of
zooplankton, ind/m
3
Spring
Winter
Summer
Autumn
Mean
Fig. 15. Individual biomass changes of the zooplankton near the Nuclear power plant
(ind/m
3
).
0
5
10
15
20
25
30
1985 1987 1991 1996 2000 2004
Year
Species
Fig. 16. Main species of fishes in Daya Bay from 1985 to 2004 (Wang et al., 2008)
Nuclear Power – Deployment, Operation and Sustainability
276
In order to evaluate the potential fishery production in the sea area around the Daya Bay
Nuclear Power Plant before and after the operation, the potential fishery productions were
270 t/a in 1992-1993 (before the operation) and 550 t/a in 1994-1995 (after the operation) in
45 km
2
sea area around the Daya Bay Nuclear Power Plant according to primary
productivity and organic carbon of the phytoplankton (Peng et al., 2001).
Year April May October December Mean
1985 9.70 6.30 27.80 14.60
1987 2.85 4.16 1.92 2.98
1996 1.08 2.51 7.39 3.66
2000
2004
2.28
10.80
2.28
10.80
Table 4. Mean individual weight of the fish (g tail
-1
) changed from 1985 to 2004 (Wang et al.,
2008).
Daya Bay has a high diversity of natural habitats, more than 700 species of benthos were
found by mud sampling and trawling since 1982 (Xu, 1989; Wang et al., 2008, 2011). Bemthic
plants were less than 10%, including about 60 species of diatoms which were the main
benthic plants. Benthic animals were more than 90%. Besides a very few species, the benthic
animals in Daya Bay were almost all warm-water species with relatively few individuals.
The annual mean biomasses of benthic animals ranged from 55.70 g m
-2
to 148.91 g m
-2
ranging from 1982 to 2004 (Table 5). The lowest mean biomass of the benthic animal in Daya
Bay was found to occur during 1990-1997, which was the largest foreign investment along
the Daya Bay coast (Zang, 1993; Wang et al., 2006, 2008, 2011; Tang et al., 2003). The annual
mean biomasses of benthic animals have increased from 1990 to 2004, and also reached the
level of 1980s in recent years. The highest biomass of 1326 g m
-2
was collected in north
region of Daya Bay in spring of 1982. Polychaeta (about 150 species account for about 21%)
and molluscs (about 148 species account for about 21%) were the dominant groups,
followed by crustacea (about 130 species account for about 18%) and echinoderms (about 52
species account for about 7%), the rest (about 13%, such as Spongia, Coelenterata, Bryozoa
and Nemertinea etc.) exhibited the lowest biomass. 73 species of ground fishes (account for
about 10%) were captured in Daya Bay at 1982-2004. Seasonal variation of biomass showed
similar trends with a maximum in winter and spring minimum in autumn or summer from
2001 to 2002 (Table 6). The maximum biomass in the year mainly occurred at the northeast
and middle parts of Daya Bay, those were living areas of the mollusca (Xu, 1989; Wang et
al., 2008, 2011). The mean biomasses of benthic animals of western Daya Bay (near Nuclear
Power Plants) have been decreasing from 317.7 g m
-2
in 1991 to 45.24 g m
-2
in 2004 (Table 7),
and the number of benthic animal species was also decreasing since 1993 (Fig. 17). These
results indicated that the warm water from the Daya Bay Nuclear Power Plant (since 1993)
and Lingao Nuclear Power Plant (since 2002) had given great effects for this area ecology
and environment, particularly for the benthos that was directly impacted marine organism
(Zheng et al., 2001; Wang et al., 2008, 2011).
Effects of the Operating Nuclear Power Plant
on Marine Ecology and Environment - A Case Study of Daya Bay in China
277
Year 1982 1987 1990 1996 1997 1998 2001 2002 2004
Biomass 1.9-1326 1.5-1210 5.5-99 0.1-1197 0.4-823 2-1122 0-1236.6 0-1152 2.6-506.9
Mean 123.1 123.6 55.70 74.20 78.60 152.80 148.91 117.71 126.68
Table 5. Mean biomasses of benthic animals in Daya Bay from 1982 to 2004 (Wang et al.,
2008) (Unit: g m
-2
).
Year Spring Summer Autumn Winter
2001 256.18 88.05 47.10 248.77
2002 96.11 14.11 64.98 279.53
Table 6. Seasonal changed biomasses of benthic animals in Daya Bay changed from 2001 to
2002(Wang et al., 2008). (Unit: g m
-2
).
Year 1991 1993 1994 1996 1996 1997 1998 2001 2002 2004
Biomass
0.4-1651 0.4-254.10.1-120.80.1-117.5 0.1-158.0 0.4-113.0 4.4-1222 0-197.7 0-115.6 20 6-76.6
Mean
317.9 82.00 26.60 25.60 28.60 25.80 21.4.3 34.15 28.84 45 24
Table 7. Mean biomasses of benthic animals of western Daya Bay from 1991 to 2004(Wang et
al., 2008) (Unit: g m
-2
).
1
10
100
1000
1987 1989 1991 1993 1997 2000 2004
Year
Species numbe
r
Polychaeta
Mollusca
Crustacea
Echinodermala
Ground fish
Others
Total number
Fig. 17. Number of benthic animal species of western Daya Bay from 1987 to 2004 (Wang et
al., 2008).
Coral reefs—the hermatypic coral are concentrated in the vicinity of Dalajia, Xiaolajia and
west in the mouth of Daya Bay located at the northern edge of the global coral reef zone.
Based on data collected in 1983-1984, there were formerly at least 19 coral species in Daya
Bay (not included the part of Haotou harbour, which area was only investigated in 1964),
accounting for 76.4% of the hermatypic coral from Dalajia and Xiaolajia to the mouth of the
Nuclear Power – Deployment, Operation and Sustainability
278
bay (Zhang & Zhou, 1987), with Acropora pruinosa (Brook) as the dominant species. Only
~12-16 species were found in 1991-2002, accounting for 32% (Wen et al., 1996) and 36% of
total cover rate for the hermatypic coral (Table 8). There has been a shift in the dominated
species since 1990s. For example the dominated species were Favites abdita (Ellis &
Solander) in 1991 and Platygyra daedalea (Ellis & Solander) in 2002, which was 7.4% of the
hermatypic coral for its total cover rate. The hermatypic coral were demolished from 1984 to
2002, some of which were destroyed by men (Wen et al., 1996; Souter & Linden, 2000;
Bellwood et al., 2004), such as bomb fishing, underwater coral reef sightseeing and
exploitation of coral reef for making money. As one kind of sensitivity marine biology for
water temperature, the coral bleaching is related to the going up of water temperature
(Souter & Linden, 2000). If the seawater temperature increases by 0.5-1.5ºC in several weeks,
about 90-95% coral will die (Zhang et al., 2001). The hermatypic coral of Daya Bay had a
little recover from 1991 to 2002 (Wang et al., 2008). The increased temperature of Daya Bay
being the global change and the warm water from the nuclear power plant may be also the
other reasons for decreasing the cover rate of the hermatypic coral in Daya Bay (Zheng et al.,
2001).
Year 1984 1991 2002
Total species/total cover rate
(%)
19/76 12/32 16/36
Table 8. Investigation results of the hermatypic coral from 1984 to 2002 (Wang et al., 2008).
Mangrove plants grow along the coast of Daya Bay, such as in Aotou, Nianshan, Dongshan,
Sanmen Island and Dalajia Island etc. There were 13 species belonged to 13 families (Chen et
al., 1999; Zhong et al., 1999; Wang et al., 2008). There were some herbaceous and the
ornamental vine in the mangrove plants of Daya Bay, such as Cyperusmalaccensis,
Derristktrifoliata, Canavliamaritima, Ipomoeapescaprae, Plucheaindica, Sporobolusirginicus
and Scavolahinanensis ect. The dominant species were Kandelia candel, Bruguiera
gymnorrhiza, Aegiceras corniiculatum and Avicennia marina; and Ceriops tagal,
Lumnitzera eacemosa, Rhizophora stylosa have gradually being deracinated (Chen et al.,
1999). It now covers only 4% in some areas (such as in Baisha Bay of the northwest part in
Daya Bay) as compared to 60-90% in 1950s, which is mainly consisted of small shrubs and
bushes. A great deal of mangrove plants was felled in order to create farmland in 1970s. The
total mangrove plants are about 850 hm2 along the Daya Bay coast at present. In recent
years, the mangrove plants were again seriously destroyed and this phenomenon is
accompanied with aquatic culture, the travel and economic development (Xue, 2002; Hens et
al., 2000; Zoriniet al., 2004).
Obviously, the coral reefs-the hermatypic coral and mangrove plants in Daya Bay have
seriously been degraded and destroyed since 1980s and 1970s. It will be need to make a
much greater effort to protect these diverse resources to maintain their ecological functions
(Wang et al., 2008).
4.2 Identification of water quality and phytoplankton, benthos characteristics
Water quality and phytoplankton data collected from 1999 to 2002 at 12 stations in Daya Bay
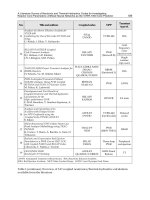
are summarized in Table 9 (Wang et al., 2006).
Effects of the Operating Nuclear Power Plant
on Marine Ecology and Environment - A Case Study of Daya Bay in China
279
Table 9. Ranges and means of major physicochemical and biological factors in 12 stations in
Daya Bay from 1999 to 2002 (Wang et al., 2006).
Nuclear Power – Deployment, Operation and Sustainability
280
Cluster analysis based on the major water quality parameters measured (first column Table
10) revealed that 12 monitoring stations could be grouped into three clusters. Flexible-Beta
Cluster Analysis method was used and the corresponding dendrogram using FLExible-beta
method between groups transforming measures with Flexible-Beta Distance is shown in
Fig.18. Cluster I consisted of stations S1, S2, S7 and S11, in the south part of Daya Bay.
Cluster II consisted of stations S5, S6, S9, S10 and S12, in the middle and northeast parts of
Daya Bay. Cluster III consisted of stations S3, S4 and S8, in the cage culture areas of the
southwest part of Daya Bay and the northwest part nearby the Aotou harbor of Daya Bay.
By the FLExible-beta’s method for cluster analysis, the results could also reflect there were
the different function areas in the sea of Daya Bay (Wang et al., 2006).
Factor analysis techniques were used to investigate the various factors that present in each
of three clusters identified by cluster analysis. Factors were identified by the principal
component method with varimax rotation (using PROC X16 of the SAS system).
Eigenvalues and cumulative proportions of correlation matrix are present in Table 10. In
each cluster, more than 60% of the data variance could be explained by the first two
principle components. In general, pH, NO
3
-N, TIN and TIN/PO
4
-P are the most important
factors in differentiating the characteristics of the three clusters as evident from the factor
loadings. Cluster I with factor 1 (positive loadings for secchi, NO
3
-N, DIN, TIN/PO
4
-P and
BOD
5
) and factor 2 (positive loadings for temperature, DO, pH and chlorophyll a) combined
accounting for 32.61 % of the data variance. Cluster II with factor 1 (positive loadings for
NO
2
-N, NO
3
-N, TIN, PO
4
-P, SiO
3
-Si, and Chlorophyll a) and factor 2 (positive loadings for
tubidity, TIN/PO4-P and chlorophyll a) combined accounting for 25.31 % of the data
variance. Cluster III with factor 1 (positive loadings for temperature, pH, secchi, NO3-N,
TIN, TIN/PO4-P, SiO3-Si/PO4-P and BOD5) and factor 2 (positive loadings for DO, pH,
tubidity, NO2-N and chlorophyll a) combined accounting for 43.10 % of the data variance
(Wang et al., 2006).
Table 10 shows the corresponding factor loading in three clusters. It should be noted that
NO3-N and TIN/PO4-P were important factors among stations in the three clusters, while
concentrations of individual nutrient factors (i.e. NO2-N, NO3-N, TIN, PO4-P and SiO3-Si)
were more important in Cluster II. These results were different to the research in Port
Shelter, Hong Kong (Yung et al., 2001), which showed that nutrient ratios (i.e. TIN to TSi
and TP to TSi) were apparently the more important factors among stations in different
clusters (Wang et al., 2006).
Water quality and benthos data collected from 2001 to 2004 at 12 stations in Daya Bay are
summarized in Table11 (Wang et al., 2011).
Bivariate correlations between benthos biomass and major physical and nutrient factors
were calculated for all stations. The density of benthos in all stations correlated positively
with temperature, DO, pH, NH
4
-N, SiO
3
-Si, SiO
3
-Si/PO
4
-P, chlorophyll a and negatively
correlated with salinity, Secchi, COD, NO
3
-N, NO
2
-N, TIN, PO
4
-P, TIN/PO
4
-P, BOD
5
. Such
relationship between nutrients and benthos was also found in the Lower Chesapeake Bay
(Dauer & Alden, 1995). The results of the correlation analysis revealed that not only
temperature, DO, pH, SiO
3
-Si, SiO
3
-Si/PO
4
-P, chlorophyll a, but also salinity, Secchi depth,
NO
3
-N, NO
2
-N, TIN, TIN/PO
4
-P, BOD
5
could play an important role in determining the
biomass of benthos in Daya Bay (Dauer & Alden, 1995). The results are different from those
using multivariate statistical analysis to study water quality and phytoplankton
characteristics in Daya Bay from 1999 to 2002 (Wang et al., 2006).
Effects of the Operating Nuclear Power Plant
on Marine Ecology and Environment - A Case Study of Daya Bay in China
281
Cluster I Cluster II Cluster III
F1 F2 F1 F2 F1 F2
Temperature (°C) 0.01249
0.99037
0.16669 0.49016
0.87157
0.49027
Salinity (ppt) 0.12846 0.02911 0.92371 -0.30711 0.26872 -0.96322
DO (mg dm
-3
) 0.19712
0.97137
-0.85093 0.25263 0.15601
0.98775
pH 0.07382
0.78155
-0.90136 -0.35794
0.62899 0.77741
Secchi (m)
0.90952
0.33258 0.23706 -0.94526
0.50374
-0.86386
Tubidity (NTU) 0.06313 -0.98470 0.29705
0.88071
0.17229
0.98505
NH
4
-N (μmol dm
-3
) -0.81998 -0.57232 -0.01719 0.28781 -0.86639 0.49936
NO
2
-N (μmol dm
-3
) -0.61670 -0.18310
0.98970
-0.09451 -0.80358
0.59520
NO
3
-N (μmol dm
-3
)
0.72416
0.01289
0.92253
0.26891
0.90624
-0.42277
TIN (μmol dm
-3
)
0.87689
-0.16412
0.73706
0.31524
0.98197
-0.18905
PO
4
-P (μmol dm
-3
) -0.99369 0.01984
0.73275
-0.22751 -0.99800 -0.06318
SiO
3
-Si (μmol dm
-3
) -0.19294 0.29027
0.81653
-0.23589 -0.98767 -0.15652
TIN/PO
4
-P
0.98732
-0.11482 0.03293
0.92628 0.99951
0.03141
SiO
3
-Si / PO
4
-P 0.45590 0.26096 -0.60317 0.19426
0.99274
-0.12029
BOD
5
(mg dm
-3
)*
0.89595
-0.36263 0.44634 -0.75797
0.64454
-0.76457
Chlorophyll a (mg m
-3
) -0.23591
0.95703
-0.33466 -0.12719 -0.12588
0.99205
Cumulative % of variance
explained
39.40 32.61 42.60 25.33 56.90 43.10
Table 10. Factor loadings (after varimax rotation) of first two factors for Cluster I, II and III
(Wang et al., 2006).
Cluster analysis based on the major water quality parameters measured (first column Table
12) revealed that the 12 monitoring stations could be grouped into three clusters. Flexible-
beta cluster analysis method was used and the corresponding dendrogram using FLExible-
beta method between groups transforming measured with Flexible-beta distance, and the
Flexible-beta cluster analysis result was shown in Fig.19. Cluster I consisted of the stations
S1, S2, and S6 in the southern part of Daya Bay, where there are more effects from the Pearl
River and South China Seas (Xu, 1989), such as the East Guangdong upwelling (Xu, 1989;
Wang et al., 2006, 2008, 2011). Cluster II consisted of stations S3, S8 and S11 in the cage
culture areas in the southwest part, the northwest part near the Aotou harbor and the
northeast part near the Fenhe harbor of Daya Bay. The fish farming in Daya Bay has
increased from an annual production of about 100 tons (440 ha cage culture area) in 1988 to
approximately 60,000 tons (14,000 ha cage culture area) in 2005, a nearly 600-fold growth
during the past 17 years (Wu et al., 2009b). Cluster III consisted of the stations S4, S5, S7, S9,
S10 and S12 in the southwest, the middle and northeast parts of Daya Bay. The results of
cluster analysis could also reflect the different functional areas of Daya Bay. These results
are different from those reported for the water quality and phytoplankton characteristics in
Daya Bay by Wang et al. (2006), and indicated also that human activities were the main
factor impacting the ecological environment in Daya Bay (Wang, et al., 2008, 2011; Wu &
Wang, 2007; Wu et al., 2009, 2010).
Nuclear Power – Deployment, Operation and Sustainability
282
Table 11. Ranges and means of major physco-chemical and biological factors of 12 stations in
Daya Bay from 2001 to 2004 (Wang et al., 2011).
(mg m
-3
)
Effects of the Operating Nuclear Power Plant
on Marine Ecology and Environment - A Case Study of Daya Bay in China
283
Fig. 19. Results of the FLExible-beta’s method for cluster analysis showing the three clusters
of all stations (Wang et al., 2011).
Factor analysis techniques were used to investigate the various factors that are present in
each of three clusters identified by cluster analysis. Factors were identified by the principal
component method with varimax rotation. Eigenvalues and cumulative proportions of
correlation matrix are present in Table 12 (Wang et al., 2011).
In each cluster, more than 50% of the data variance could be explained by the first two
principle components. In general, NO
3
-N, NH
4
-N and TIN are the most important factors in
differentiating the characteristics of the three clusters as evident from the factor loadings.
Cluster I with factor 1 (positively with COD, NH
4
-N, NO
3
-N, TIN, TIN/PO
4
-P and BOD
5
)
and factor 2 (positively with temperature, pH, Secchi and NO
2
-N) accounted for 45.54 % of
the data variance. Cluster II with factor 1 (positively with DO, COD, NO
3
-N, BOD
5
and
Chlorophyll a) and factor 2 (positively with NH
4
-N, NO
2
-N, NO
3
-N, TIN, PO
4
-P and SiO
3
-
Si/PO
4
-P) accounted for 38.36 % of the data variance. Cluster III with factor 1 (positively
with for DO, NO
3
-N, TIN, PO
4
-P and SiO
3
-Si) and factor 2 (positively with salinity, Secchi
depth, NO
3
-N and NO
2
-N) combined for 23.78 % of the data variance.
Table 12 shows the corresponding factor loading in three clusters. It should be noted that
NO
3
-N and NH
4
-N were important factors among stations in the three clusters, whereas
concentrations of individual nutrient factors (i.e. NH
4
-N, NO
2
-N, NO
3
-N, TIN and PO
4
-P)
were more important in Cluster II. These results were similar to the research for spatial
characterization of nutrient dynamics in the Bay of Tunis (Souissi et al., 2000), for long-term
changes in water quality and phytoplankton characteristics in Port Shelte (Yung et al., 2001)
and also for the water quality and phytoplankton characteristics in Daya Bay (Wang et al.,
Nuclear Power – Deployment, Operation and Sustainability
284
2006), which showed that the nutrients were apparently the more important factors among
stations in different clusters)
Cluster I Cluster II Cluster III
F1 F2 F1 F2 F1 F2
Temperature (°C) -0.07402 0.99726 -0.91594 0.17441 0.41463 -0.84822
Salinity (ppt) 0.08681 -0.99622 -0.86609 -0.23685 -0.79031 0.58854
DO (mg dm
-3
) -0.95422 0.29911 0.90756 -0.23741 0.66559 -0.56114
pH 0.10302 0.99468 0.34421 -0.88746 -0.95259 -0.18645
Secchi (m) -0.08829 0.99609 -0.97061 -0.00703 -0.81068 0.51100
COD (mg dm
-3
) 0.99806 -0.06229 0.96300 0.13467 0.30587 0.37842
NO
3
-N (μmol dm
-3
) 0.71192 -0.70226 -0.11188 0.98878 0.09577 0.63140
NO
2
-N (μmol dm
-3
) -0.34213 -0.93965 0.04398 0.88400 0.13031 0.98026
NH
4
-N (μmol dm
-3
) 0.85008 0.52665 0.50845 0.85305 0.73916 -0.65671
TIN (μmol dm
-3
) 0.96037 -0.27873 0.24975 0.96593 0.69021 0.18550
PO
4
-P(μmol dm
-3
) -0.67938 -0.73379 -0.03668 0.99788 0.90839 -0.09308
SiO
3
-Si(μmol dm
-3
)
-0.83054 -0.55696 0.32481 -0.39576 0.99190 0.01782
TIN/PO
4
-P 0.72370 0.69012 -0.11296 0.06295 -0.09709 0.01522
SiO
3
-Si/ PO
4
-P -0.92164 -0.38804 -0.01222 0.79633 0.13335 0.24584
BOD
5
(mg dm
-3
)
0.99133 0.13138 0.98990 0.09895 0.17930 0.25444
Chlorophyll a (mg
m
-3
)
-0.99963 -0.02708
0.99220
0.02532 0.33479 -0.16112
Cumulative % of
variance explained
54.46 45.54 42.63 38.56 37.04 23.78
Table 12. Factor loadings (after varimax rotation) of first two factors for Cluster I, II and III
(Wang et al., 2011).
5. Conclusions and suggestions in the future
Daya Bay as a multi-type ecosystem including coral reef, mangrove and rock reef has a rich
biodiversity. It is a good place for the reproduction and culturing of fish, shrimp, crabs and
shellfish. Due to constant interaction between land and ocean area, its ecology is more
complicated and vulnerable than that of the open seas. It is especially vulnerable to the
effects of frequent human activities and land-based pollution. Depsite the progressive
increases of human activities including more domestic sewage and industrial waste water
discharged as well as nutrient enrichment and toxins derived from the cage culture of the
fish and seashell, the concentrations of N, P, DO and COD must not be allowed to exceed
water quality standards at the risk of serious ecosystem degradation and still were within
the First Class of National Seawater Quality Standards for China. The temperatures of
seawater in Daya Bay were increasing from 1982 to 2004 probably due to global change. The
average ratio of N/P increased from 1.377 in 1985 to 49.09 in 2004, and the limiting factor of
nutrients changed from N to P. The composition of biological community has been small,
with biodiversity simplified and the biological natural resource declined. For example, the
species of phytoplankton decreased from 206 species of 56 genera in 1990 to 126 species of
44 genera in 2004, the waster warm water from the Nuclear Power Plant can provide extra
amount of energy for phytoplankton growth (Wang et al., 2006); the main species of the
zooplankton of Daya Bay had decreased from 46 species of 1983 to 36 species of 2004, the
Effects of the Operating Nuclear Power Plant
on Marine Ecology and Environment - A Case Study of Daya Bay in China
285
waste warm water is not a good environment for zooplankton growth, especially in summer
and autumn of each year, which directly impacts on zooplankton growth (Zheng et al.,
2001); the mean individual weight of the fish has changed from 14.8 g tail
-1
of 1985 to 10.80 g
tail
-1
of 2004. Assessment for the potential fishery production between before and after the
operation indicated that the potential fishery production after the operation was one time
compared with before the operation in 45 km
2
sea area around the Daya Bay Nuclear Power
Plant (Peng et al., 2001). More than 700 species of benthos were found, the annual mean
biomasses of benthic animals increased from 72.40 g m
-2
in 1996 to 126.68 g m
-2
in 2004. The
mean biomasses and species of benthic animals near the Nuclear Power Plants decreased
from 317.9 g m
-2
in 1991 to 45.24 g m
-2
in 2004 and from 250 species in 1991 to 177 species in
2004, the temperature value increased about 1ºC compared with the other sea areas in Daya
Bay (Wang et al., 2008). The waste warm water from the Nuclear Power Plants was the main
factor influencing ecology and environment in the western area of Daya Bay, particularly for
the benthos that directly impacted marine organism (Wang et al., 2008, 2011; Zheng et al.,
2001). Many changes had taken place in Daya Bay from 1982 to 2004, such as stony coral
bleaching, changed in dominate species of coral community, seriously degraded and
destroyed mangrove plants. These results indicated that the ecosystem of Daya Bay is
undergoing a rapid deterioration in some areas and in some aspects. At the same time, some
aspects of its ecological environment were recovering due to strategic protection and
management steps for protection and management of coastal marine ecosystems in China.
For example, the annual mean biomasses of benthic animals increased from 72.40 g m
-2
of
1996 to 1126.68 g m
-2
of 2004 and the nutrient P decreased from 1985 to 2004. Daya Bay is a
multi-type ecosystem mainly driven by human activities (Wang et al., 2006, 2008, 2011; Wu
& Wang, 2007).
The results of the present study indicated that the mean abundances of phytoplankton in all
stations correlated positively with temperature, salinity, DO, pH, the ratio of TIN to PO
4
-P,
NH
4
-N, NO
3
-N, TIN and PO
4
-P and negatively correlated with secchi, tubidity, SiO
3
-Si to
PO
4
-P, and SiO
3
-Si and NO
2
-N by calculation with bivariate correlations. All stations could
be groups into three clusters with Flexible-Beta Cluster Analysis method. Cluster I consisted
of stations S1, S2, S7 and S11 in the south part and the northeast part of the Daya Bay.
Cluster II consisted of stations S5, S6, S9, S10 and S12 in the middle and northeast parts of
Daya Bay. Cluster III consisted of stations S3, S4 and S8 were in the cage culture areas in the
southwest part of Daya Bay and in the northwest part near the Aotou harbor of the Daya
Bay. The results also suggest that the nutrient and phytoplankton are good environmental
indicators can rapidly image the changing water quality in Daya Bay, and this is the first
attempt to analyze the water quality and phytoplankton characteristics in Daya Bay by
multivariate statistics based on the investigated data in Daya Bay. The results of
multivariate statistical analysis revealed that the temperature, dissolved oxygen, NH
4
-N and
NO
3
-N could also play an important role in determining the density of phytoplankton in
Daya Bay (Wang et al., 2006).
The results of the present study indicated that the biomass of benthos at all stations
correlated positively with temperature, DO, pH, NH
4
-N, SiO
3
-Si, SiO
3
-Si/PO
4
-P and
chlorophyll a and negatively correlated with salinity, Secchi depth, COD, NO
3
-N, NO
2
-N,
TIN, PO
4
-P, TIN/PO
4
-P and BOD
5
by calculation with bivariate correlations between
benthos and major physical and nutrient factors. All stations could be grouped into three
clusters. Cluster I consisted of stations S1, S2, and S6 were in the south part of Daya Bay.
Nuclear Power – Deployment, Operation and Sustainability
286
Cluster II consisted of stations S3, S4, S8 and S5 in the cage culture areas in the southwest
part, the northwest part near the Aotou harbor and the northeast part near the Fenhe harbor
of Daya Bay. Cluster III consisted of stations S7, S9, S10 S11 and S12 in the southwest, the
middle and northeast parts of Daya Bay. The results also suggest that the nutrient and
benthos are good environmental indicators that can rapidly image the changing water
quality in Daya Bay. As a multi-type ecosystem Daya Bay seems to be mainly driven by
human activities (Wang et al., 2008). The results revealed that temperature and nutrients
could also play an important role in determining the biomass of benthos in Daya Bay (Wang
et al., 2011).
The warm water from the Nuclear Power Plants and waste water from the cage culture
areas had greatly influenced ecological processes and the environment in this region
according to changes in biomass of benthos and water quality at different stations in Daya
Bay (Wang et al., 2006, 2008, 2011). Particularly the benthos was directly impacted as marine
organisms, thus there is a need for more research about waste warm water from the Nuclear
Power Plants and from cage culture areas affecting the regional ecosystem of Daya Bay
(Wang et al., 2006, 2008, 2011; Wu et al., 2009, 2010). Furthermore the development of fish-
farming in Daya Bay should in future be controlled (Wu et al., 2009). According to the
research of long-term changes of Daya Bay, regional coordination in protection and
management of such vulnerable coastal marine ecosystems should be strengthened. The
following strategic protection and management steps are recommended(Wang et al., 2008):
(i) Enhance information dissemination and education to improve environmental protection
awareness for people in the region; (ii) Strengthen the long-term monitoring of the marine
environment and coastal ecosystems in Daya Bay, enhance the research of regional
environmental capacity, and use that capacity to establish large-scale control of pollutant
discharges; (iii) Promote the protection of coral reefs, mangroves, coastal ecosystem and
regional biodiversity by carrying out scientific plans for resource use based on marine
system functions; (iv) Strictly enforce regulations relating to the marine environment and
fisheries from June to August in each year; (v) More research about the waste warm water
from the Nuclear Power Plants for effecting the ecosystem of Daya Bay should be carried
out.
6. Acknowledgements
This research was supported by the project of knowledge innovation program of Chinese
Academy of Sciences (No. KZCX2-YW-Q07-02, No. KSCX2-SW-132, KSCX2-SW-214), the
National Natural Science Foundation of China (No. 41076070), the key projects in the
National Science & Technology Pillar Program in the Eleventh Five-year Plan Period (No.
2009BADB2B0606) and the National 908 project (No. 908-02-04-04).
7. References
Bellwood. D. R., Hughes.
T.P., Folke, C. & Nystrom, M., 2004. Confronting the coral reef
crisis. Nature, 429, 827-833.
Bodergat, A.M., Oki, K., Ishizaki, K., and Rio, M., 2003. Impact of volcanism, human
activities, and water mass circulation on the distribution of ostracod populations in
Kagoshima Bay (Kyushu Island, southern Japan). Comptes Rendus Geosciences,
334(14), 1053-1059.
Effects of the Operating Nuclear Power Plant
on Marine Ecology and Environment - A Case Study of Daya Bay in China
287
Burger, J., 2003. Perceptions about environmental use and future restoration of an urban
estuary. Journal of Environmental Planning and Management, 46(3), 399-416.
Buzzelli, C.P., 1998. Dynamic simulation of littoral zone habitats in lower Chesapeake Bay:
ecosystem characterization related to model development. Estuaries, 21, 659-672.
Chen, H., Miao, S., Wang, H., and Xu, Y.M., 1999. A study on syn-ecology of mangrove at
Daya Bay, China. Chinese Journal of Guangzhou Normal University, 20(2), 90-94.
Cloern, J.E., 1996. Phytoplankton bloom dynamics in coastal ecosystems: a review with some
general lessons from sustained investigation of San Francisco Bay, California.
Reviews of Geophysics, 34(2), 127-168.
Dauer, D.M., Alden, R.W., 1995. Long-term trends in the macrobenthos and water quality of
the Lower Chesapeake Bay (1985-1991). Marine Polluton Bulletin 30(12): 840-850.
Fisher, T.R., 1991. Phytoplankton, nutrient and turbiding in the Chesapeake, Delaware and
Hudson estuarine. Estuarine, Coastal and Shelf Science, 32, 187-206.
Han, W.Y., 1991. Carbon cycles of Daya Bay and the Preal River. Science Press, Beijing,
China, p12-42.
Hansom, J.D., 2001. Coastal sensitivity to environmental change: a view from the beach.
CATENA, 42(2), 291-305.
Hens, L., Nierynck, E., Van, Y T., Quyen, N.H., Hien, L.T.T., An, L.D., 2000. Land cover
changes in the extended HA long city area, North-Eastern Vietnam during the
period 1988-1998. Environment, Development and Sustainability, 2(3-4), 235-252.
Huang, L., Chen, Q., and Yuan, W., 1989. Characteristics of chlorophyll distribution and
estimation of primary productivity in Daya Bay, China. Asian Marine Biology, 6, 115-
128.
Huang, L., Tan, Y., Song, X., Huang, X., Wang, H., Zhang, S., Dong, J., and Chen, R., 2003.
The status of the ecological environment and a proposed protection strategy in
Sanya Bay, Hainan Island, China. Marine Pollution Bulletin, 47(1-6), 180-186.
Johnson, R. A., Wichern, D. W., 1998. Applied multivariate statistical analysis. Prentice Hall,
New York.
Justice, D., Rabalais, N.N., Turner, R.E., and Dortch, Q., 1995. Change in nutrient structure of
river-dominated coastal waters: stoichiometric nutrient balance and its
consequences. Estuarine, Coastal and Shelf Science, 40, 339-356.
Kerr R.A., 2010. Ocean acidification unprecedented, unsettling. Science, 328, 1500-1501.
Kont, A., Jaagus, J., Aunap, R., 2003. Climate change scenarios and the effect of sea-level rise
for Estonia. Global and Planetary Change, 36(1), 1-15.
Lian, G.S., Lin, Y.H., Cai, B.J., Lin, M., Dai, Y.Y., and Lin, J.H., 1990. Characteristics of
zooplankton community in Daya Bay. In: Third Institute of Oceanology, State
Oceanic administration (eds), Collections of papers on marine ecology in the Daya
Bay (II). China Ocean Press, Beijing, China, p274-281.
Lin, W.Q., and Li, S.Y., 2003. Three-D water quanity mathematical simulation of COD, DO,
inorganic phosphorus and organic phosphorus in the Pearl River Estuary. Acta
Oceanologica Sinica (in Chinese), 25(3), 129-137.
Mu, X.Y., Yang, Y.L., Li, C.Y., Yin, X.C., Jia, J.J., and Xue, Y.C., 1999. Eenvironmental
characteristics of seawater in the Yuehu inlet Rongcheng Bay, China.
Chinese Journal
o
f Qingdao University, 14(4), 57-59.
Mumby, P. J., Edwards, A. J., Ernesto Arias-Gonzalez, J., Lindeman, K. C., Blackwell, P. G.,
Gall, A., Gorczynska, M. I., Harborne, A. R., Pescod, C. L., Renken, H., Wabnitz, C.
Nuclear Power – Deployment, Operation and Sustainability
288
C. C., Llewellyn, G., 2004. Mangroves enhance the biomass of coral reef fish
communities in the Caribbean. Nature, 427, 533-536.
Olivieri, R.A., Chavez, F.P., 2000. A model of plankton dynamics for the coastal upwelling
system of Monterey Bay, California. Deep-Sea Research II, 47, 1077-1106.
Pearson, H., 2005. Scientists seek action to fix Asia’s ravaged ecosystems. Nature, 433, 94.
Peng, Y.H,Chen, H.R.,Pan, M.X., Huang, H.H.,Gao, H.L.2001. The primary production and
potential fishery production in the sea area around the Daya Bay Nuclear Power
Station before and after the operation of DBNPS. Journal of Fisheries China (in
Chinese), 25 (2), 161-165.
Shen, Z L., 2001. Historical changes in nutrient structure and its influences on
phytoplantkon composition in Jiaozhou Bay. Estuarine, Coastal and Shelf Science, 52,
211-224.
Sohma, A., Sekiguchi, Y., Yamada, H., Sato, T., and Nakata, K., 2001. A new coastal Marine
ecosystem model study coupled with hydrodynamics and tidal flat ecosystem
effect. Marine Pollution Bulletin, 43(7-12), 187-208.
Sommer, U., Stibor, H., Katechakis, A., Sommer, F., Hansen, T., 2002. Pelagic food web
configurations at different levels of nutrient richness and their implications for the
ratio fish production: primary production. Hydrobiologia, 484(1-3), 11-20.
Sommer, U., Lengfellner, K., 2008. Climate change and the timing, magnitude, and
composition of the phytoplankton spring bloom. Global Change Biology, 14(6), 1199-
1208.
Souissi, S., Daly Yahia-Kéfi, O., 2000. Spatial characterization of nutrient dynamics in the
Bay of Tunis (south-western Mediterranean) using multivariate analyses:
consequences for phyto- and zooplankton distribution. Journal of Plankton Research
22(11), 2039-2059.
Souter, D.W., and Linden, O., 2000. The health and future of coral reef systems. Ocean and
Coastal Management, 43(8), 657-688.
Tagliani, P.R.A., Landazuri, H., Reis, E.G., Tagliani, C,R., Asmus ML, Sanchez-Arcilla A.,
2003. Integrated coastal zone management in the Patos Lagoon estuary:
perspectives in context of developing country. Ocean and Coastal Management, 46(9),
807-822.
Tang, D.L., Kester, D.R., Wang, Z.D., Lian, J.S., Kawamura, H., 2003. AVHRR satellite
remote sensing and shipboard measurements of the thermal plume from the Daya
Bay, nuclear power station, China. Remote Sensing of Environment, 84, 506-515.
Turner, R.E., Rabalais, N.N., 1994. Coastal eutrophication near the Mississippi River delta.
Nature, 368, 619-621.
Wang, Y. S., Wang, Z.D., Huang, L.M., 2003. Changes in the ecological environment of Daya
Bay and the trends in recent 20 years, [in:] Chinese Ecosystem Research Network
(CERN), Center of Chinese Ecosystem Research Network (eds.), Proc. 11th Chinese
Ecosystem Research Network, Sanya, China, 606-614.
Wang, Y.S., Xu, J.R., Dong, J.D., Jiang, H.C., 2004. Ecological environment characteristics of
thermocline and its kinetic mechanism in Daya Bay. In: Center of Chinese
Ecosystem Research Network (eds), Collections of chinese ecosystem research. Proc
12th Chinese Ecosystem Research Network, Changsha, China, p 226-231.
Effects of the Operating Nuclear Power Plant
on Marine Ecology and Environment - A Case Study of Daya Bay in China
289
Wang, Y.S., Lou, Z.P., Sun, C.C., Wu, M.L., Han, S.H., 2006. Multivariate statistical analysis
of water quality and phytoplankton characteristics in Daya Bay, China, from 1999
to 2002. Oceanologia, 48 (2), 193-211.
Wang, Y.S., Lou, Z.P., Sun, C.C., Sun, S., 2008. Ecological environment changes in Daya Bay,
China, from 1982 to 2004. Marine Pollution Bulletin. 56(11), 1871-1879.
Wang Y.S., Sun C.C., Lou Z.P. et al. Identification of water quality and benthos
characteristics in Daya Bay, China, from 2001 to 2004. Oceanological and
Hydrobiological Studies, 2011, 40(1), 82-95.
Wei G. F., Wang Z. D., Lian J. S., 2003. Succession of the dominant phytoplankton species in
spring 2000 in at Dapeng’Ao cove, Daya Bay. Acta Ecologica Sinica (in Chinese),
32(11), 2285-2296.
Wen, W.Y., Zou, R.L., Du, W.C., Huang, X.P., Zheng, Q.H., Zhang, G.X., Liang, Z.Q., Li, T.S.,
1996. Impacts of warm effluent from the Dayawan nuclear power plant on stony
coral community I. Stony community before the operation of the nuclear power
plant. In: Pian, J.P., Cai, G.X. (eds), Annual research reports of MBRS(I). Science
Press, Beijing, China, p18-22.
Wu, M.L., Wang, Y.S., 2007. Using chemometrics to evaluate anthropogenic effects in Daya
Bay, China. Estuarine, Coastal and Shelf Science, 72, 732-742.
Wu, M.L., Wang, Y.S., Sun, C.C., Wang, H., Lou, Z.P., Dong, J.D., 2009a. Identification of
water quality by using chemometrics in Daya Bay, China, Oceanologia 51 (2), 217–
232.
Wu, M.L., Wang, Y.S., Sun, C.C., Wang, H., Dong, J.D., Han, S.H., 2009b, Identification of
anthropogenic effects and seasonality on water quality in Daya Bay, South China
Sea, Journal of Environmental Management, 90, 3082-3090.
Wu, M.L., Wang, Y.S., Sun, C.C., Wang, H., Dong, J.D., Yin, J.P., Han, S.H., 2010.
Identification of coastal water quality by statistical analysis methods in Daya Bay,
South China Sea. Marine Pollution Bulletin, 60, 852-860.
Xue, C., 2002. The impact of human activities on mangrove coast of Kosrae Island, the
federated states of Micronesia. Transaction of Oceanology and Limnology (in Chinese),
2, 17-23
Xu, G.Z., 1989. Environments and resources of Daya Bay. Anhui Scienctific and Technical
Publishers, HeFei, China, p 8-9, 10-16.
Yanez-Arancibia, A., Lara-Dominguez, A.L., Rojas Galaviz, J.L., Zarate Lomeli, D.J.,
Villalobos Zapata, G.J, Sanchez-Gil, P., 1999. Integrating science and management
on coastal marine protected areas in the Southern Gulf of Mexico. Ocean & Coastal
Management, 42,319-344.
Yang, Q.L., 1990. Ecologic characteristics of phytoplankton community in Daya Bay. In:
Third Institute of Oceanology, State Oceanic administration (eds), Collections of
papers on marine ecology in the Daya Bay (II). China Ocean Press, Beijing, China, p
266-273.
Yin, K., Qian, P.Y., Wu, M.C.S., Chen, J.C., Huang, L., Song, X., Jian, W.J., 2001. Shift from P
to N limitation of phytoplankton biomass across the Pearl River Estuarine plume
during summer. Marine Ecological Progress Series, 201, 65-79.
Yin K., 2003. Influence of monsoons and oceanographic processes on red tides in Hong
Kong waters. Marine Ecology Progress Series, 262, 27-41.
Nuclear Power – Deployment, Operation and Sustainability
290
Yung, Y. K., Wong, C.K., Yau, K., Qian, P.Y., 2001. Long-term Changes in Water Quality and
Phytoplankton Characteristics in Port Shelter, Hong Kong, from 1988-1998. Marine
Pollution Bulletin, 42(10), 981-992.
Zang, M.C., 1993. Nuclear power programs in China. Atomwirtschaft-Atometechnik (in
German), 38(6), 419-420.
Zhao, S.J., Jiao, N.Z., Wu C.W., Liang, B., Zhang, S.Y., 2005. Evolution of nutrient structure
and phytoplankton composition in the Jiaozhou Bay ecosystem. Chinese Joumal of
Environmental Sciences, 17(1), 95-l02.
Zheng, Q.H., He, Y.Q., Zhang, G.X., 2001. Impacting on the ecological environment and
marine organism by waster water discharged to the sea in Daya Bay. In Pian, J.P.,
Wang, Z.D., Wu, X.Z. (eds), Annual research reports of MBRS (III): Science Press,
Beijing, China, p10-15.
Zhang, Q.M., 2001. Status of tropical biological coasts of China: implications on ecosystem
restoration and resconstruction. Ocenaologia and Limnologia Sinica (in Chinese),
32(4), 454-464.
Zhang, Y.L., Zhou, R.L., 1987. Community structure of shallow water stony corals in Daya
Bay. Chinese Journal of Tropical Oceanography, 6(1), 12-18.
Zhong, Z.X., Huang, Y.Y., Zhang, H.D., 1999. Research on primary productivity quantitative
parameters and structure of mangrove community in Daya Bay of Guangdong
Province. Scientia Silvae Sinicae, 35(2), 26-30.
Zorini, L.O., Contini, C., Jiddawi, N., Ochiewo, J., Shunula, J., Cannicci, S., 2004.
Participatory appraisal for potential community-based mangrove management in
East Africa. Wetlands Ecology and Management, 12(2), 8 7-102
Zhou, J.K., 1984. Factor analysis of the distributive relationship of the fish numbers in the
Jiaozhou Bay. Marine Science Bulletin (in Chinese), 3(3), 58-67.
12
Microbial Leaching of Uranium Ore
Hadi Hamidian
Islamic Azad University, Qaemshahr Branch
Iran
1. Introduction
This chapter is a review of the microbiological leaching of uranium ores. Microbiological
leaching has been use as an alternative approach to conventional hydrometallurgical
methods of uranium's extraction. In the microbiological leaching process, iron-oxidizing
bacteria oxidize pyretic phase to ferric iron and sulfuric acid, and uranium is dissolved from
the ore due to sulfuric acid attack. If uranium in the ore material is reduced state and in
involves tetravalent form and a redox reaction is involved whereby uranium oxidized to the
hexavalent form. Future sustainable development requires measures to be taken to reduce
the dependence on non-renewable raw materials and the demand for primary resources.
New resources for metals must be developed with the help of novel technologies. In
addition, improvement of previously existed mining techniques can be resulted in metal
recovery by the sources that have not been of economical interest up to today. The metal-
winning processes based on the activity of microorganisms offer a possibility to obtain
metals from mineral resources which are not accessible by conventional mining. Generally
bioleaching is a process described as being “dissolution of metals from their mineral source
by certainly and naturally occurring microorganisms” or “use of microorganisms to
transform elements so that the elements could be extracted from a material when water is
filtered through it”. However, there are some slight differences in definition: Usually,
“bioleaching” is described as the conversion of solid metal values into their water soluble
forms using microorganisms. Bacterial leaching is the extraction of metals from their ores
using microorganisms. The capital costs are low compared to those for a smelter.
Environmental pollution caused by mineral processing is a serious problem and on the
other hand, microorganisms play crucial roles in biogeochemical cycling of toxic metals and
radionuclides. Recent progresses have been made to understand metal–microbe interactions
and new applications of these processes to the detoxification of metal and radionuclide
contamination have been developed. It also suggests an opportunity to reduce of
environmental and air pollution by sulphur dioxide.
2. Historical review
One of the initial reports in which leaching might have been involved in mobilization of
metals is given by the Roman writer Plinius Secundus. In his works on natural sciences,
Plinius describes how copper minerals are derived by means of utilizing a leaching process.
In cold weather during the winter the sludge freezes to the hardness of pumice. It is known
Nuclear Power– Deployment, Operation and Sustainability
292
from experience that the most wanted chrysocolla is formed in copper mines, the following
in silver mines. The Rio-Tinto mines in southwestern Spain are usually considered the
cradle of biohydrometallurgy. These mines have been exploited since pre-Roman periods
due to their copper, gold, and silver values. However, with respect to commercial
bioleaching operations on an industrial scale, biohydrometallurgical techniques had been
introduced to the Tharsis mine in Spain 10 years earlier. As a consequence of the ban of
open-air ore roasting and its resulting atmospheric sulfur emissions in 1878 in Portugal,
hydrometallurgical metal extraction has been taken into consideration in other countries
more intensely. In addition to the ban, cost savings were another incentive for development:
Heap leaching techniques were assumed to reduce transportation costs, allowing
employment of locomotives and wagons for other services. From 1900 on, no open air
roasting of low-grade ore was conducted at the Rio-Tinto mines. The researchers conducted
on microbial leaching indicate an increasing rate of recovery and solubility of metals in
direct, indirect, Thiosulfate and Polysulfide mechanism, due to microorganism activity. The
initial work on uranium bioleaching in the early 1950s was taken to prevent solubilization,
but it soon became apparent that this process could be applied for a commercial scale to
extract uranium for low-grade ores. During 1952 and 1953, the plant at Urgeirica started a
uranium heap leaching process on a commercial scale. This is an early turning point in the
microbiological leaching of uranium ores.
Harrison et al. (1966) reported the role of the iron oxidizing Acidithiobacillus ferrooxidans
in leaching of uranium. The uranium ore was stacked in heaps, similar to dump leaching of
low-grade copper ore, and leached using an acidic ferric sulfate solution at the Elliot Lake
Mine, Ontario, Canada. The presence of the bacteria in the heaps was discovered and their
role in maintaining oxidizing conditions by conversion of ferrous to ferric iron for extraction
of the uranium was defined. Guay’s (1976) investigations showed that the effectiveness and
efficiency of microorganism’s influence, such as Thiobacillus, requires the presence of
certain amount of iron. He also conducted some research on mixing level, aiersion, and
oxidation rate of iron that may affect uranium’s microbial leaching. He employed a specific
type of microbes such as Thiobacillus in his study. Amongst the various parameters
affecting the sufficiency of microbial leaching; he just focused upon the aforementioned
parameters. Brierley (1980), one of the distinguished researchers in microbial leaching, has
done a case study on uranium ore (coffinite and uraninite) in Gerantez mine in Canada .His
investigation’s outcomes demonstrated a promising and positive effect of Thiobacillus
ferrooxidans in climbing recovery rate of uranium. Cerda’s studies (1991) on Pitchblende
ore in green-grayish shiest samples, collected from Spain’s mines, revealed a close
relationship of pyrite and Chalcopyrite in reduction of acid consumption in microbial
leaching, in comparison with regular leaching. In continuous surveys carried out over on
microbial leaching by different researchers. Gonzalez (1993) utilized column leaching,
seepage and shaking table to study the effect of pyrite amount in uranium’s microbial
leaching. His investigation’s results showed an augmenting trend of uranium recovery
while there is an optimum amount of pyrite. Beyond the optimum level of pyrite, not only
the pyrite presence is not beneficiary, but also it may introduce complicity in leaching
process. He has also done some research on pH optimization, temperature, and stirred time.
In a case study conducted by Junior (1993) on uranium ore in Figopira in Brazil, potentiality
of microbial leaching in uranium recovery enhancement has been emphasized. Schipper’s
(1995) study on two mines in Germany indicated the identification of microbe variety in
Microbial Leaching of Uranium Ore
293
waste materials. The waste materials (low grade black Schist) consisted of 0.05% of uranium
and 0.5 to 7% of carbonate. Sampling showed the microorganisms aerobic and anaerobic
were present till 1.5 to 2 meter of surface depth and more than 99% of Thiobacillus
ferrooxidans were present within this depth. In this study, there was no investigation on
microbial leaching capability and identification of microbes was just concerned. Munoz
(1995), dedicated researcher in uranium’s microbial leaching in Spain, has presented his
research’s results in many published papers in Elsevier. Bioleaching process, mineralogy of
uranium ore, bearing rock type, level of toxic material, and leaching variables are among the
factors which have been probed by him. He has worked on pitchblende ore with 0.097 %
uranium content. Leduc, L.G. (1997) studied ten different isolated of Thiobacillus
ferrooxidans with regard to their degree of resistance to the metals copper, nickel, uranium,
and thorium. The miscellaneous isolates had different susceptibilities to the tested metals,
and moreover none of the metals had a stimulus effect. Uranium and thorium were 20 to 40
times more toxic to ferrous iron oxidation than either copper or nickel. Mathur A.K. (2000)
investigated the application of ferric ion as an oxidant and in combination with other anions
such as ferric sulfate or chloride as a leachant is well accepted for recovery of metals,
particularly from ores of copper, cobalt, nickel, zinc and uranium. Biogenically generated
ferric sulfate that has been in vogue for many dump and heap leaching operations, to
recover uranium and copper values. Hefnawy (2001) used fungi for Aloga uranium ore
bioleaching in Egypt. The amount of uranium solubilized by A. terreus and P. spinulosum
was increased by intensifying ore concentrations on the growth media, reaching its
maximum at 4 % (w/v). Whereas, the highest percentage of uranium released by both fungi
was obtained at 1 % (w/v), in this concentration the released uranium being 75 and 81.5%
respectively for ore and 72.8 and 77.6% respectively for the second ore. The best leaching
occurs when the final pH shifts toward acidity. The biosorption of released uranium by
fungal Mycelium was also increased by augmenting ore concentrations on the growth
media. Kalinowski and Oskarsson (2002) represented common ligand producing bacterial
species (Pseudomonas fluorescens, Shewanella putrefactions and Pseudomonas stutzeri)
were incubated in a chemically defined medium supplemented U-ore that had been exposed
to natural weathering conditions for 30 years having a content of 0.0013 % U by weight. For
comparison, non-leached uranium ore (0.61 % U by weight) from the same area were
incubated by P. fluorescens and S. putrefaciens. P. fluorescens is the only species that thrives
and manages to mobilize measurable amounts of uranium from the two ores. Despite the
extensive increase in pH from 4.7 to 9.3 P. fluorescens supplemented with ore manages to
mobilize 0.001-0.005 % of the total amount of U from both ores. The release of U was
interpreted to be attributed to the production of pyoverdine chelators, which is a typical
ligand produced by fluorescent pseudomonades, as U could not be detected in either sterile
controls or in experiments with the two other bacteria. In Sumera Saeed (2002) investigation
the bioleaching behavior of rock phosphate (Jordan imported) was studied using different
strains of Aspergillus niger. X-ray diffraction analysis revealed the presence of fluorapatite
[Ca
2
(PO
4
)
3
F] as the main source of phosphorus. Average content of phosphorus in testing
ore was 33.6% scanning electron microscope showed the presence of significant amount of
phosphorus. Decrease in pH was observed due to organic acids produced by Aspergillus
niger strains during growth on liquid media containing glucose. Akcil (2004) represented an
investigation of the potential bioleaching developments in Turkey [27]. Bene Ditto (2005) in
his study identified sulfur reduction bacteria in Brazil uranium mine water. This is basically