Advanced Radio Frequency Identification Design and Applications Part 13 docx
Bạn đang xem bản rút gọn của tài liệu. Xem và tải ngay bản đầy đủ của tài liệu tại đây (1.94 MB, 20 trang )
RFID Tags to Aid Detection of Buried Unexploded Ordnance
229
3.5 Magnetic modeling
3.5.1 Signal to the tags
Modeling did provide insight into behavior of the fields near the munition generated by the
transmitting coil.
As expected, the field amplitudes dropped significantly near the munition’s conductive
surface. The decrease in field and resulting signal to the tag can be as much as two orders of
magnitude in going from a lift-off of 2.5 mm (0.1 inch) to the munition surface. In general, a
6.3-mm (0.25-inch) gap increases the field by a factor 2.5 over a 2.5-mm separation. The exact
change depends on the munition material. As expected, lower conductivity in the metal
ordnance object results in lower eddy current amplitudes and therefore lower loss in field
level at the munition. Also, higher permeability of the material tended to increase the field
near the munition. Nonetheless, the proximity of the tag to the munition will decrease the
magnetic field near the tag. Therefore, the separation between the metallic surface and the
tag is critically important.
In order to accommodate this required separation, the idea of grooves into which the tags
would be placed was considered. Modeling indicated that groove shape has minimal
influence on the field coupled into the tag. The important parameters were groove depth
and groove length and width. Separation requirements were identical. The length and width
of the groove should be such that there is about 5 mm (0.2 inch) of clearance between the
tag’s coil and the sides of the groove. This requirement holds for both tag types. The effect of
the composition of the material potting the tag in the groove was also investigated.
Nonconducting, permeable material will aid in coupling the interrogation signal into the
tag.
Near the munition, the magnetic field lines tend to be parallel to the conductive surface. For
a surface lift-off of 2.5 mm, the magnetic field parallel to the munition surface can be as
much as five times larger than the magnetic field perpendicular to the surface. This fact
indicates that a tag with solenoid geometry will receive a much higher input signal than a
tag with the pancake geometry.
Figure 4 shows the magnetic vector equipotential lines from a transmitting coil near the
munition as it passes by. The magnetic field is parallel to these lines. Here, the metallic
munition is oriented vertically and the coil passes over its centerline. Regardless of the coil
position, the field lines tend to be parallel to the munition.
This behavior is a consequence of the electromagnetic boundary condition associated with
conductive surfaces and strongly suggests that the pancake coil tag would not be feasible for
this application because it requires magnetic fields perpendicular to the surface of the
munition to be activated. It would be helpful to orient two solenoid tags axially and
circumferentially on the munitions with circular cross-section. However, because of
practical constraints, the solenoid tags can only be oriented axially on the munition.
Therefore, the transmitting coil will have to produce sufficient axial field on the surface of
the munition for this system to be feasible. The other parameters examined focused on this
geometry.
The angular orientation of the ordnance item (vertical to horizontal) as the above-ground
coils are moved, as they would be in a large ground-area survey, were examined. For a coil
centered over the munition, the two extremes, vertical and horizontal, were modeled. In the
first case the magnetic field on the surface of the munition is vertical. In the second case, the
field is mostly circumferential, albeit larger in magnitude.
Advanced Radio Frequency Identification Design and Applications
230
Fig. 4. Two-dimensional modeling results showing the magnetic vector equipotential lines
from the transmitting coil as it passes directly over a vertically oriented munition. The
magnetic field is tangential to these equipotential lines. The coil is not shown, but it is
located one-half meter above the munition. The center of the coil is designated in the figures.
However, the orientation of the field on the munition will change as the transmitting coil
passes over the ordnance item. Figure 5 shows an example. In all cases examined, there were
at least some points along the coil motion that caused an axial field somewhere along the
surface of the munition.
The relative signal received by an axially-oriented solenoid tag, for a munition whose axis is
parallel to the surface, is shown in Figure 6. The two cases shown are for the coil passing
parallel and perpendicular to the munition’s axial axis.
In the first case, sufficient field can exist to activate the solenoid tag, although the
transmitting coil will be off-center from the munition. In the second case, sufficient field can
only exist if the tag is near the ends of the munition. In this case, a tag centered on the
munition cannot receive any activating field and the munition will not be detected.
Placement of the tag on the munition is important. It is preferable to place it near the edge of
the munition.
Notice also that the peak activating fields for a tag occur at different transmitting coil
positions depending on munition orientation and how the transmitting coil passes over the
munition. For the above example, in the first case, the tag receives its peak activating field
when the transmitting coil is roughly one-half diameter off-center from the munition; in the
second case the peak activating field occurs when it is centered.
RFID Tags to Aid Detection of Buried Unexploded Ordnance
231
Fig. 5. The direction of the magnetic field on the surface of a vertically-oriented cylindrical
munition with a one-meter diameter transmitting coil located 0.38-meters above the
munition, centered (left), 0.3-meter off-center (middle) and 0.5-meter off-center (right).
Fig. 6. Responses calculated as the interrogating coil moved past a horizontally-oriented
munition. The left curves correspond to the transmitting coil moving parallel to the axis of
the munition. The right curves correspond to the coil moving perpendicular to its axis.
For a given munition depth, the strength of the activating field varies only by about a factor
of three depending on munition orientation, tag location, and where the transmitting coil
passes. A vertical munition orientation provides the largest activating field. A horizontal
orientation is more affected by coil motion and tag location.
For any given case, the magnitude of the field levels on the munition change only slightly as
a function of the angular position. For a vertically oriented munition, the peak signal
strength is independent of angular orientation. The worst case is for a horizontally oriented
munition. In the horizontal case, the signal for a tag on the bottom of munition remains
about one-half the magnitude at the top of the munition, which was encouraging because
the munition’s tag could be on the “underneath” side of the tag and still, be detectable.
Advanced Radio Frequency Identification Design and Applications
232
The basic behavior and orientation of the magnetic fields on the surface of the munitions do
not change as a function of munition depth in the range of 0.3 to 1.5 times the transmitting
coil diameter. The only change in field is the amplitude. In general, if a solenoid tag is
mounted near the edge of the munition with at least a 6.3-mm lift-off, a signal should be
detected by the tag for all cases up to a one-meter depth. If the solenoid tag is mounted at
the center of the munition, the average maximum depth for tag activation reduces to about
0.5 meters; however, there are certain cases in which the tag will not receive any signal
regardless of depth. For the pancake coil tag, the maximum depth is about 0.1 meters.
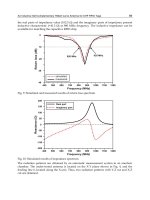
Figure 7 shows the amplitude of the peak axial field on the top surface of a horizontally-
oriented munition. Assuming 100 amp-turns for a one-meter diameter transmitting coil and
a solenoid tag, equation (8) suggests a field level of 8.5 pT is required for tag activation. For
this case, a maximum depth of more than 1 meter is possible. If the tags were located on the
bottom of the munition, field levels for the horizontal case would be roughly halved, but
still a one-meter deep tag can be activated. A vertically oriented munition would have a
somewhat larger field.
Fig. 7. The maximum field level on the surface of the munition as a function of munition
depth. The coil is centered over munition.
Frequency of the transmitting coil’s signal is also important. For practical considerations, the
frequency range between 50 and 300 kHz was examined because most commercial tags of
interest fall into this range. In all cases, the field levels near the munition slightly decreased
with increases in frequency. However, because the signals to the tags are linear with
frequency, the signal increased monotonically. Commercially available tags are set to
receive a fixed frequency. But, this information indicated that use of a higher frequency
signal has advantages.
RFID Tags to Aid Detection of Buried Unexploded Ordnance
233
Munition geometry was also studied. In general, there was no appreciable change in the
behavior of the fields for the geometries analyzed. Smaller munitions allowed larger field
levels near its surface. For a cone shaped munition, the field was slightly larger near the
smaller diameter ends.
There are other factors that can alter the field on the surface of the munition. For example,
the presence of other permeable or conductive material, such as the remnants of exploded
ordnance items nearby, can shield the tag from the input signal. Modeling indicates that if
larger pieces of ordnance items are at least 0.1 meter from the munition and each other, field
levels near the munition will not be significantly affected. Otherwise, the conductive
material will shield the munition’s tag from the field.
Soil conductivity is generally of concern for higher frequency systems but it was examined
in our study. The results indicate that if the frequencies are on the order of 150 kHz and the
munition depth is less than one coil diameter, soil conductivity does not affect the signal
transmitted to the tag much. For a 0.38-meter deep munition and a frequency of 150 kHz,
the difference between a dry soil and one saturated with salt water was a decrease in field
amplitude of less than 20 percent.
If the tag mounting is optimized, modeling suggests that an overlap for the transmit coil of a
half-coil diameter will be sufficient for ensuring that there is enough magnetic energy to
actuate a tag at a one-meter depth.
The electric field at the munition produced by the transmitting coil was also calculated.
Using these models, the current design of our one-meter diameter coil has been predicted to
be about 0.5 V/m at 100 kHz immediately below the coil, which lies well below the HERO
safety level. The HERO curves specify the maximum safe level at 100 kHz to be between 10
and 40 V/m (rms), depending on the sensitivity of the munition.
3.5.2 Signal from the tags
Once a tag has been activated, in generates its own output signal that is picked up at the
surface using a receive coil. The magnetic field generated from both the pancake and
solenoid tag geometries were examined. Figure 8 shows the magnetic vector equipotential
lines from both tag types, in air and in a groove on the munition. The magnetic field is
parallel to these lines and larger when the lines are closer together. The presence of the
conductive munition reduces the field output of the pancake coil tag significantly while
slightly boosting the output from the solenoid tag. The pancake coil tag generates a field
normal to the surface of the munition that is reduced because of the electromagnetic
boundary conditions. The effect on the solenoid is somewhat reversed, the metallic
munition repels the magnetic field, which increases the signal transmitted by the tag
boosting the effective signal output by as much as 20 percent.
Just as with receiving the signal from a transmitting coil, the solenoid tag performs better in
outputting a signal. For these reasons, the solenoid geometry was the focus of the rest of this
study. Because of practical constraints, these tags must be axially oriented on the munition
so only axially oriented tag results are presented here.
Unlike inputting a signal to the tag, the effect of munition materials examined had little
effect on solenoid tag output.
Soil conductivity has minimal effects on the tag’s output signal as with the tags input signal.
Again, the tag location on the ordnance item was found to be important with a tag position
closer to the end of the munition increasing signal at the pick-up coil a maximum of
10 percent, depending on the specific case.
Advanced Radio Frequency Identification Design and Applications
234
Fig. 8. Magnetic vector equipotential lines from the transmission of the solenoid (top row)
and the pancake coil (bottom row) tags. The left column shows the results for the tags in air.
The middle column shows the results for the tags in a grooved munition in dirt. These two
columns are the same scale. The pancake coil tag’s signal output is severely damped compared
to the solenoid tag’s signal because of the munition’s presence. The right column shows the
same results as the center column, but on a larger scale to see the impact near the surface.
When the tag is embedded in a groove, a wider and deeper groove is important but the
shape of the groove is less important. Lift-off is not as much of a factor in getting signal to
the surface as it was in getting signal to the tag. Here, a lift-off of only 2.5 mm is sufficient. A
lift-off of 6.3 mm was required to receive the signal. The permeable filler placed in a groove
to help increase input signal to the tag has little effect on tag output.
As in the case of the signal to the RFID tag, the tag’s transmitted signal frequency was
influential. As stated previously, the frequency range between 50 and 300 kHz was
examined during this work to correspond with commercial tag availability. While the
magnetic field amplitude at the ground’s surface slightly decreased as frequency increased,
the signal in the above-ground receive coil increased monotonically with frequency.
The length of the solenoid tag was also examined. The longer tags produced a larger
amplitude field at the ground surface. The commercial tags examined varied from 10 to
40 mm in axial length.
Figure 9 shows the peak amplitude of the three components of the magnetic field generated
in a plane 0.38 meters above an off-centered, axially-oriented, solenoid tag. The columns
show the axial, normal, and circumferential components, respectively. Two horizontal and
one vertical munition orientations are shown. The red color is a positive and the blue color is
a negative.
The basic field distributions depend only on munition orientation. The field amplitude
decreases in amplitude as munition depth increases and as the tag angular location
approaches the far side (bottom) of the munition.
These field distributions have significant consequences for the signal received by and the
design of the receive coil. Only the field linking the receive coil’s windings will be detected.
For a point-coil receiver, the magnetic field amplitude is linearly proportional to the signal.
However, because the coil will have a finite diameter, the average field level linking that coil
area will determine the signal.
In practice, it will be easier to position the above-ground receive coil oriented parallel to the
surface, so approach will focus on this case. In this situation, the normal component of flux
induces the signal.
RFID Tags to Aid Detection of Buried Unexploded Ordnance
235
Generally, a larger coil diameter will capture more flux and produce a larger signal for
detection. However, the unique features in the tag’s surface field distribution indicate that a
coil diameter less than one meter should be sufficient given the munition sizes and depths of
interest. Larger coil diameters would add little benefit.
Referring to Figure 9, the normal flux distributions are shown in the center column. The
following arguments can be applied to any component of the flux detected by a pick-up coil.
For a vertically oriented munition, the normal field distribution from the tag at the surface is
a monopole. However, for a munition oriented parallel to the surface, this field distribution
is a dipole.
Fig. 9. The axial (left), normal (middle), and circumferential (right) components of the peak
magnetic field transmitted by the solenoid tag at the surface. The top, middle, and bottom
rows show the munition orientation parallel to the surface with centered tag on top of
munition, same orientation rotated 90 degrees with the tag position off center on the side,
and a vertically oriented munition with the tag centered, respectively. The munition is
shown as a rectangle (parallel to surface) in the first two rows and a circle (vertical) in the
last.
A problem arises with dipole distributions. Depending on the direction of the motion of the
receive coil as it passes over the dipole field, the dipole field could tend to cancel itself as it
links the coil windings. Therefore, it is very important that the receive coil have an overlap
as it is scanning. This overlap will reduce the impact of isolated nulls inherent in the dipole
field patterns because the system will be taking data continuously at nearby locations that
are not within the null. Modeling suggests that the receive coils should have an overlap no
less than one-half the coil diameter.
The models can be calibrated to any commercial tag. For example, the Texas Instruments’
Tiris 32-mm long solenoid tag’s specifications state that it has a field output between 80.5
and 102.5 Amps/meter at 50 mm with an output frequency of 134 kHz. The calibration data
are used to determine the maximum munition depth that can be detected realistically.
The field at the receive coil is dependent on the discussed parameters. It is also dependent
on the receive coil’s electronic design. Electronics associated with the receive coils can
generally measure minimum signal strengths of about 5.0 µV. For practical purposes,
Advanced Radio Frequency Identification Design and Applications
236
assume the receiver has 20 turns, a coil area of 0.3 m
2
, and an effective core permeability of
one. For this case, equation (8) suggests an average field strength of 6 picoTesla (pT) at the
receiver is required for detection.
If the lower value for the tag output is used and the above receive coil is assumed, analysis
indicates that a signal from the tag can be detected for a munition depth of least one meter,
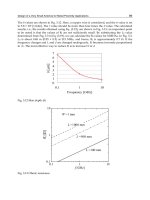
for all cases considered. The average field linking this receive coil as a function of munition
depth is shown in Figure 10.
Fig. 10. The average field as a function munition depth. The munition is oriented parallel to
the surface. For a typical receive coil, a field of 6 pT is required.
The electric field produced by the tags at the munition was also calculated. The models
indicate that the tags would produce electric field amplitudes less than 0.01 V/m at 100 kHz
on the munition, far below the HERO safety levels.
3.5.3 Q-value of the tags
The Texas Instruments’ tags specify a minimum quality factor above 60 to respond to an
interrogating signal. In free space, the Q of the transponder coils was found to be about 94.
The modeled results were calibrated with respect to these commercial tag values.
Modeling studies indicated that the metal of the munition casing had a significant impact on
the Q of the tag. As expected, the presence of the munition decreased the inductance and
increased the resistance of the tag’s circuit, thereby lowering the Q-value.
Figure 11 shows the induced eddy currents that change the resistive value of the circuit.
Modeling indicates that in general a lift-off greater than 6 mm from the munition surface is
required to keep the Q-value above 60.
If the tag is placed in a groove, not only is this lift-off still required, but the tag should be
separated from the walls of the groove by about 5 mm. The nonconducting, permeable
material used to aid in coupling the interrogation signal into the tag did not lower the
Q-value.
RFID Tags to Aid Detection of Buried Unexploded Ordnance
237
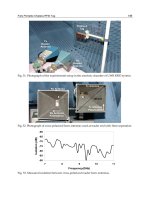
Fig. 11. The induced eddy currents from a solenoid tag on the surface of the munition. The
peak current density for a typical commercial tag is about 2500 amps per square meter.
3.6 Experimental verification
Experimental efforts involved the design, fabrication, and tuning of the custom coil circuits.
The tuning circuits for the high-voltage, one-meter diameter transmit coil and the
corresponding receive coil were built.
Munition
Receiver
Transmitter
Munition
Tag
Tag Signal
Munition
Receiver
Transmitter
Munition
Tag
Tag Signal
Fig. 12. The laboratory setup for obtaining experimental data. The left picture shows a one-
meter diameter transmitting coil centered over a munition. The top right pictures show a
close-up of this munition and the RFID tag. The lower right graphic is a spectrum analyzer
screen shot displaying the two frequencies transmitted by the tag.
Advanced Radio Frequency Identification Design and Applications
238
Lab and field testing were conducted. The basic results of the modeling were verified,
although not every parameter was examined in the lab and field. Tag proximity to the
munition surface was important not only for receiving a signal but also maintaining a high
Q-value. The separation distance of 6.3 mm (0.25 inch) for good tag performance was found
to be adequate.
The solenoid tag and the one meter diameter coil in the laboratory using the set-up shown in
Figure 12 were characterized. The solenoid Tiris tags from Texas Instruments have been
used exclusively.
Experiments were performed to determine the distance from a transmitting coil that a tag
could be activated by measuring the voltage level at the tag coil without a munition item.
Ranges greater than 2 meters were observed. These experiments were repeated with the tag
near a munition. Similar results were seen as long as the tag separation from the munition
was sufficient.
Later experiments observed the field generated by the tag at the above-ground receiving
coil. For optimized conditions, munition depths greater than one meter were detectable in
the lab.
Tagged munitions were also detectable in the experimental field trials in dry clay soils.
These findings also supported the modeling results.
3.7 Modeling conclusions
This modeling effort suggests that munition tagging, making use of current passive RFID
tag technology, as a method to improve locating UXO and discriminating UXO from clutter
is feasible.
In tagging the munition, a solenoid type tag was found to be preferable. The tag separation
from the metallic munition surface is important for ensuring acceptable operation of the tag.
A separation distance of 6.3 mm is required. If it is placed in a groove, separation of the tag
from the groove walls should be about 5 mm.
For practical reasons, the tag will be oriented axially on the munition and should be place
near the ends of the munition so that the tag can receive a signal from the transmitting coil
regardless of munition orientation. If centered on the munition, there are circumstances that
would prevent a tag from receiving a signal. The tag can still receive and transmit sufficient
signals regardless of its angular position on the munition, i.e., top or bottom.
The receive coil should be less than one meter in diameter. The transmit and receive coils
should have an overlap of about one-half coil diameter. Soil conductivity did not present a
problem.
For an optimized system, a detectable munition depth of a one meter is likely.
4. Mechanical considerations
The mechanical considerations were two-fold. First, the tag had to survive launch
acceleration and impact. Second, the tag had to be mountable on existing munitions without
significant modification to the munition.
Launch acceleration and velocity testing explored tag survivability potential. These tests
were conducted at Battelle’s West Jefferson, Ohio munitions testing facilities. A “soft catch”
was employed using a combination of Styrofoam and duct tape to reduce deceleration
forces. Tiris tags were removed from their glass containers, potted, and placed inside
polypropylene cylinders that were inserted as shotgun shell loads. Tag survival was
RFID Tags to Aid Detection of Buried Unexploded Ordnance
239
determined using a Tiris reader to monitor the tag’s digital response. Initial results were
encouraging. A single tag was fired 11 times; it survived the first 10 events. The results are
listed in Table 1. The final firing at 67,000 g’s allowed the polypropylene slug to strike a steel
plate, which did incapacitate the tag. Shot number 8 is highlighted in the table. The tag
described in this line survived accelerations up to 43,000 g’s and a maximum velocity of
247 meters per second (809 feet per second). Informal discussions with ordnance experts
indicated the highest acceleration/deceleration levels experienced by U.S. munitions were
in the low 20,000 g’s (anecdotal information did not indicate if this value was acceleration or
deceleration). Further testing and analysis would be needed to ensure tag functionality
meets acceleration/deceleration rates acceptable to the Government.
Shot
Number
In-Bore
Acceleration (g’s)
Velocity
(feet/second)
Tag
Response
1 10,000 340 Good
2 27,000 277 Good
3 33,000 681 Good
4 12,750 375 Good
5 26,900 575 Good
6 10,800 381 Good
7 15,850 438 Good
8 43,100 809 Good
9 N/A 882 Good
10 N/A 475 Good
11 67,500 1158 Bad*
* Load struck metal plate behind Styrofoam
Table 1. Summary of tag acceleration and velocity survivability testing
The initial research into the mounting feasibility and potential approaches was analytical; no
physical testing was performed during this investigation. Five candidate munitions were
considered for tagging. The candidates included munitions that were used at firing ranges
and that stayed within one meter of the surface when they entered the ground and did not
explode. These munitions were the BLU-97, MK-52 practice bomb, M720, M229, and 155 mm
projectile. Because these munitions vary considerably in physical shape and size, no
universal attachment method seemed realistic. However, mounting a tag to each munition
type was deemed feasible with minor modifications to the munition. Distinct techniques
were developed for each of these munitions. Figure 13 shows one potential approach for the
MK-52 practice bomb.
Fig. 13. One example of mechanically mounting a tag on a munition .
Advanced Radio Frequency Identification Design and Applications
240
5. Evaluation and testing
Experimental efforts involved the design, fabrication, and tuning of the custom coil circuits.
The tuning circuits for the high-voltage, one-meter diameter transmit coil and the
corresponding receive coils were built. The basic results of the modeling were verified,
although not every parameter was examined in the lab and field.
5.1 Lab evaluation
Figure 12 shows the laboratory setup for characterizing the one-meter transmit coil and the
Tiris tags. The Tiris tag was mounted on a BLU-97 munition 4.3 mm (0.17 inch) from the
steel body using a 2.8-mm thick ferrite spacer and a 1.5-mm thick circuit board spacer. The
circuit board allowed probes to be attached for monitoring voltage levels. The frequency-
domain view of the Tiris tag’s response shows the frequency shift keying between 123 kHz
and 134 kHz.
Experiments were performed to determine the distance from a transmitting coil that a tag
could be activated by measuring the voltage level at the tag coil. Ranges greater than
two meters were observed in this configuration. These lab experiments were repeated with
the tag mounted on an inert munition. Similar results were seen as long as the tag separation
from the munition was sufficient. Later experiments observed the field generated by the tag
at the above-ground receiving coil. For optimized conditions, munition/detection coil
separations greater than one meter were achieved in the lab with the tag on a munition.
Tagged munitions were also detectable at one meter in the experimental field trials in dry
clay soils. These findings supported the modeling results.
As expected and predicted by the modeling, the tag proximity to the munition surface was
important not only for receiving a signal but also maintaining a high Q-value so the tag
could respond. In the lab setting with the BLU-97 munition, a separation distance of 4.3 mm
(0.17 inch) produced acceptable results. This separation was less than the 6 mm minimum
predicted by theory because a layer of ferrite 2.8 mm thick was placed between the tag and
the ordnance item.
Even at separations greater than two meters, signal-to-noise ratios greater than 5 dB were
observed when averaging was performed. Figure 12 shows a spectrum analyzer view of the
FSK signal with a 7-dB signal-to-noise ratio. The data sets were taken with a digital
oscilloscope that measures voltage waveforms as a function of time. The digital portion of
the integrated circuit in the Tiris tag outputs a digital data stream of 64 bits that include
synchronization information and information stored in its memory. This digital waveform
then drives modulation circuitry that, in simple terms, transmits a tone at 123 kHz to
represent a logical “zero” and a tone at 134 kHz to represent a logical “one.”
This type of frequency-domain plot is useful for detecting the presence of a digital FSK
signal but it is not useful for determining the information content of the digital signal. The
ultimate detection system will demodulate the FSK signal and determine the underlying
data. Such detail was not necessary for this proof-of-concept program. In a future effort,
processing could be added to the detection circuitry that would perform the Fourier
transform to convert the data to the frequency domain and allow signal processing that
would identify low-level signals in the presence of noise and interference.
5.2 Field testing
The tagged-ordnance system was tested at the Aberdeen Test Center (ATC) located at
Aberdeen Proving Ground. Nine tagged surrogates were buried with three untagged
RFID Tags to Aid Detection of Buried Unexploded Ordnance
241
surrogates buried near the tagged surrogates to simulate the presence of buried clutter. ATC
provided the location and depth information of the buried objects
after their locations were
predicted. The detection system shown in Figure 14 was used to transmit the tag activation
signal and receive the tags’ responses. The transmit coil is one meter in diameter and the
receive coils are 30.5 cm (12 inches) in diameter.
Fig. 14. The interior of the coil module showing the one-meter diameter transmit coil and the
three separate receive coils.
The surrogates were solid steel cylinders that were 5 cm (2 inches) in diameter and 30.5 cm
(12 inches) long. The nine surrogates had grooves milled into their surface into which tags
were embedded. A photo of one of the tagged cylinders is shown in Figure 15. The tag had
5.65 mm (0.22 inch) of material between it and the surrogate munition including 2.85 mm of
plastic next to the cylinder and 2.8 mm of ferrite next to the tag.
Fig. 15. Munition surrogate later buried at Aberdeen Test Center. The tag is evident below
the red tape.
The nine targets were buried in a fairly small area because there was no need to test search
rate at this point in the development cycle. ATC buried the objects in a four-meter by
four-meter area.
The signals from the three receive coils were plotted on the oscilloscope after the scope
performed Fourier transforms on the signals. Example frequency-domain plots are shown in
Advanced Radio Frequency Identification Design and Applications
242
Figure 16. The left and right vertical yellow cursors are positioned at 120 and 130 kHz,
respectively. The left figure shows the signal from an untagged surrogate (essentially
background noise). The figure on the right represents the background noise-plus-
interference environment; signal strength is significantly higher at the two cursors. The tag
is replying to the interrogating signal by switching between 123 and 134 kHz.
Fig. 16 (Left) Example data plot with no tagged surrogate present. (Right) Example data plot
with coil module positioned above a tagged surrogate; signal strength is much higher at the
two cursor positions.
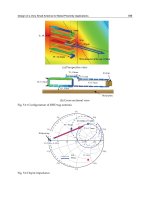
The locations of the surrogates (tagged and non-tagged), Battelle’s predicted positions, and
data acquisition points are shown in the plot of Figure 11. The square markers indicate the
positions of the tagged surrogates, the three triangles indicate where non-tagged surrogates
were placed, the large circles represent Battelle’s predicted positions of the tagged
surrogates, and the diamonds indicate the position of the center of the transmit coil when
data sets were recorded. The depth of each tagged surrogate is indicated with text. The
predicted positions are indicated with large-diameter circles because of the large “footprint”
of the coil module. The circle represents the uncertainty in the predicted position of the
buried tag, an uncertainty similar to resolution cell size in an image. The actual resolution
cell size was not determined experimentally, but modeling indicates it is a function of
munition depth and orientation. A shallow munition might be detectable when the center of
the coil module is one meter from the position of the buried tag but a one-meter-deep tag
might only be detectable when the center of the coil is within 25.4 cm (10 inches) of a
position directly over the tag.
Eight of the nine buried tagged surrogate positions were predicted. As stated previously,
nine tagged surrogates were sent to ATC but the actual number buried was unknown at the
time of the test. Figure 17 indicates the reasonable success in predicting the positions of the
eight targets.
One tagged surrogate was missed completely by the predicting process. The missed
surrogate, which was buried one meter below the surface, is shown in Figure 12 at position
(0.5, 2.5). It was described by ATC personnel as “Tagged surrogate parallel to the surface
with the tag down.” The phrase “tag down” implies the tag’s position on the surrogate is
underneath the item, as far from the surface and the coil module as possible and in the
untagged surrogate’s shadow. The untagged surrogate was 15.2 cm (6 inches) above and
parallel to the tagged surrogate. The figure shows that a data set was taken directly over the
missed surrogate. After Battelle provided its predictions and ATC supplied the actual
RFID Tags to Aid Detection of Buried Unexploded Ordnance
243
positions, the data set taken at (0.5, 2.5) was examined to see if the tag’s signal existed in the
data set. In fact, the tag’s signal was very strong in the frequency-domain plot. It was
concluded that the analysis and decision-making processes used for this test were too
simplistic. An improved algorithm was needed.
Although this tagged surrogate’s location was not predicted, it is encouraging that the tag’s
signal is very strong in the data even though it is at maximum depth at worst case position.
Improved data presentation, analysis, and interpretation will allow similar tags to be
correctly predicted in future assessment exercises.
Fig. 17. Plan view of the test grid at Aberdeen Test Center showing the actual tagged munition
positions, Battelle's predicted positions, and the positions where Battelle acquired data.
6. Summary
This study showed that the use of RFID tags to aid detection of UXO was feasible. Tags with
solenoidal geometry, similar to the TI Tiris tag, are preferred for practical signal detection
reasons. These tags show promise for being able to be mounted on munitions as well as
surviving launch and impact. Analysis provided insight into the parameter variations
necessary for optimizing the system, such as mounting the tags with some separation from
the munition surface to allow sufficient magnetic energy into the tag and to allow the tag to
operate properly. Field testing with the UXO interrogation system prototype was successful.
Efforts incorporating further optimal design and detection algorithm adjustments remain.
7. Acknowledgements
This work was conducted for the Strategic Environmental Research and Development
Program (SERDP) by Battelle Columbus Operations.
Advanced Radio Frequency Identification Design and Applications
244
8. References
Davis, R.; Shubert, K., Barnum, T. & Balaban, B. (2006). Buried Ordnance Detection:
Electromagnetic Modeling of Munition-Mounted Radio Frequency Identification
Tags, IEEE Transactions on Magnetics, Vol. 42, No. 7, (Jul. 2006) pp. 1883-1891, ISSN
0018-9464
GAO Report (2004). DoD Operational Ranges; More Reliable Cleanup Cost Estimates and a
Proactive Approach to Identifying Contamination Are Needed, General
Accounting Office Report GAO-04-601
Halman, J.; Shubert, K. & Ruck, G. (1998). SAR processing of ground-penetrating radar data
for buried UXO detection: results from a surface-based system, IEEE Transactions on
Antennas Propagation, Vol. 46, No. 7, (Jul. 1998), pp. 1023-1027, ISSN 0018-926X
Purello, M. (2002). New Maximum Allowable Environments (MAE) For HERO Unsafe
Ordnance and HERO Susceptible Ordnance, Dahlgren Division, Naval Surface
Warfare Center, Systems Electromagnetic Effects Branch (J52)
Shubert, K. ; Davis, R., Barnum, T., Balaban, B., Amdor, R., Sikorski, B., Peters, T., & Griffin,
J. (2007). Enhanced Electromagnetic Tagging For Embedded Tracking Of Munitions
And Ordnance During Future Remediation Efforts, Final Technical Report on
Project MM-1272 prepared for the Strategic Environmental Research and
Development Program
Shubert, K.; Davis, R., Barnum, T. & Balaban, B. (2008). RFID Tags to Aid Detection of
Buried Unexploded Ordnance, IEEE Antennas and Propagation Magazine, Vol. 50,
No. 5, (Oct. 2008), pp. 13-24, ISSN 1045-9243
Skilling, H (1957). Electrical Engineering Circuits, Second Edition, John Wiley and Sons, Inc.,
New York
13
Reordering of Location Identifiers for
Indexing an RFID Tag Object Database
Sungwoo Ahn and Bonghee Hong
Pusan National University
Republic of Korea
1. Introduction
Radio frequency identification (RFID) has become one of the emerging technologies for a
wide area of applications such as automated manufacturing, inventory tracking, and supply
chain management. RF technologies make it possible to identify individual items in real-
time by means of automatic and fast identification. Besides the real-time identification, RF
technologies give additional advantages for monitoring of field-based operation by tracking
and tracing the location of tags attached to items. By using queries on trajectories of RFID
tag data, RFID applications can get events about field-based situation and then respond to
them.
To store and retrieve tag data efficiently, it is important to provide an index for the
repository of tag data. The EPCglobal, being in charge of a standards management and
development for RFID related technologies, proposes EPC Information Service (EPCIS) as
the repository for tag events. The EPCIS is a standard interface for access and persistent
storage of tag information. Tag data stored in the EPCIS consists of the static attribute data
and the timestamped historical data. Historical information is continuously collected and
updated whenever each tag is identified by an RFID reader. The EPCIS usually stores them
at the base table of a database for efficient management of those data. It is necessary to
execute queries on the EPCIS whenever applications want to retrieve the location history of
specific tags. However, it is inefficient to look up all the records of the table because a large
amount of historical information for tags is to be accumulated in the base table.
For efficient query processing of tracing tags, an index structure can be constructed based on
tag events generated when a tag goes in and out a location where a reader places. Among
timestamped historical information contained in tag events, an RFID application uses the
location identifier (LID), the tag identifier (TID), and the identified time (TIME) as
predicates for tracking and tracing tags. To index those values efficiently, we can define the
tag interval by means of two tag events generated when the tag enters and leaves a specific
location, respectively. The tag interval could be represented and indexed as a time-
parameterized line segment in a three-dimensional domain which is constituted by LID,
TID, and TIME axes.
Tag intervals in a three-dimensional index are sequentially stored and accessed in one-
dimensional disk storage. Since logically adjacent tag intervals are to be retrieved together at
a query, they should not be stored far away from each other in the disk to minimize the cost
Advanced Radio Frequency Identification Design and Applications
246
of disk accesses. Logical closeness has been studied to determine the distance between
domain values representing the coordinate of those objects. A logically adjacent object to a
specific object on the data space has the shortest distance to that object by using some
distance measure. Note that the change of the order of domain values results in the variation
of distances between objects because of a different distribution of objects on the data space.
Thus, domain values should be ordered properly in each domain in order to keep logical
closeness between objects.
Most works for clustering spatial objects have used the spatial distance in the spatial domain
as the distance measure. To diminish the number of disk accesses at answering spatial
queries, they stored adjacent objects sequentially based on the spatial proximity. In addition
to the spatial proximity, moving object databases M.F. Mokbel and Y. Theodoridis have
applied the temporal proximity to the characteristic for the distance measure in the time
domain. Previous works assumed that all domains on the data space provide the proper
proximity about measuring the distance between domain values.
Since an LID represents the location where a tag stays or passes, the LID domain should
provide logical closeness for the dynamic flow of tags along locations. The problem is that
there is no rule of assigning LIDs to RFID locations in order to keep this property. If LIDs
are arbitrarily arranged in the domain without considering tag flows, tag intervals would be
scattered into the data space irrespective of logical closeness. Because this situation causes
random disk accesses for searching logically adjacent tag intervals, the cost of query
processing will be increased.
To solve this problem, we propose a reordering method for arranging LIDs in the LID
domain. The basic idea is to compute the distance between two LIDs for preserving logical
closeness of tag intervals. To do this, we define the proximity function based on a new LID
proximity between two LIDs. The proximal distance between LIDs can be computed by the
tag movements. To determine LID proximity, we need to examine the path of tag flows which
is generated by tag movements. Then, we define the LID proximity function which computes
the distance between LIDs with the dynamic flow of tags. To determine a sequence of LIDs
based on LID proximity, we construct a weighted graph and generate the ordered LID set. It
is possible to store logically adjacent tag intervals close to each other in the disk because our
reordering method can keep the correlation between the distance and logical closeness of
tag intervals. To prove this, we evaluate the performance of the index scheme using LIDs
based on LID proximity as domain values. We also compare it with the index scheme using
the numerical order of LIDs.
The reminder of this paper is organized as follows. Section 2 defines the problem of an LID
as the domain value for tag intervals and describes the needs of reordering LIDs. Section 3
examines the path of tag flows based on the characteristics of RFID locations and tag
movements, and then defines the LID proximity function. In Section 4, we propose a
reordering scheme of LIDs using a weighted graph that is constructed by LID proximity.
Section 5 presents some experimental results of performance evaluation for the proposed
reordering scheme. A summary is presented in Section 6.
2. Problem definition
2.1 Target environment
Whenever the tag attached to an item passes through an RFID reader, the reader collects the
tag’s information within its interrogation zone. In an RFID middleware system, gathered
Reordering of Location Identifiers for Indexing an RFID Tag Object Database
247
information are represented as EPCIS tag events and stored at the persistent storage in order
to answer tag related queries. Since a tag event contains several timestamped historical
information, it could represent the dynamic flow of tagged items between RFID locations
placed along tag routes. If an RFID application wants to know a history of these items, a
query processor can make an answer to the application by retrieving suitable tag events in a
repository of tag events.
In timestamped historical information, a query processor usually employs the tag identifier
(TID), the location identifier (LID), and the timestamp (TIME) as the predicates of queries
for tracing tag locations. For efficient query processing of tracing tags, the tag trajectory
should be modeled and indexed by using these predicates.
Note that RFID locations are different from the spatial locations to represent real positions
on the map. There are two types of location related to EPCIS tag events according to a
business perspective for an RFID location. One is the physical position which identifies the
tag. We denote this position as the read point (RP). The read point does not provide the
information where a tag visited or stays by itself because it designates only the place at
which a tag was detected. The other is the region where a tag stays. We denote this region as
the business location (BizLoc). The business location represents the place where a tag is
assumed to be until a subsequent tag event is generated by a different business location.
Since most of RFID applications trace a business flow of tagged items, they have an interest
in the business location instead of the read point as the location type of the tag. Therefore, it
is natural to use the business location as the LID predicate for tracing tag locations.
The EPCIS tag event could be modeled as the time parameterized interval in a three-
dimensional domain whose axes are LID, TID, and TIME. We denote this interval as the tag
interval (TI). The tag interval is a line segment that connects two coordinates in a three-
dimensional space when the tag enters and leaves a specific business location. In this
manner, the trajectory of a tag is represented as a set of tag intervals which are associated
with the tag.
Predicate
LID TID TIME
Query results Query types
point/set/
range
* point/range TID(s)
Observation Query
(OQ)
*
point/set/rang
e
point/range LID(s) Trajectory Query (TQ)
Table 1. Query classification for tracing tag locations
Queries for tracing tags are classified into two types according to a kind of restricted
predicate as shown in Table 1. An observation query (OQ) is used to retrieve the tag(s) that are
identified by the specified business location(s) in the specified time period. A trajectory query
(TQ) is used to retrieve the business location(s) that the specific tag(s) enters and leaves
within the specified period. Queries in Table 1 can be extended to a combined query by
performing two queries in the order OQ and TQ.
To support fast retrieving of desired trajectories of tags, it is necessary to store and search
tag trajectories by means of an index structure. Each leaf node of the index references
logically adjacent tag intervals on the data space by using minimum bounding box (MBB).
Then, tag intervals referenced by index nodes are sequentially stored and accessed in one-
Advanced Radio Frequency Identification Design and Applications
248
dimensional disk storage. Tag intervals on each leaf node are stored at the same disk page in
order to minimize disk seeks.
2.2 Problem of using an LID as the domain value
(a) Logical closeness between tag intervals is very important for simultaneous accessing at
the query. It gives a great influence on the performance of query processing because the cost
of disk accesses depends on the sequence of storing tag intervals on the disk. For example,
let us assume that a query, Qi, would search tag intervals by the index structure. If all tag
intervals accessed by Qi are stored in P3 as shown in Fig. 1-(a), a query processor needs to
access just one disk page, P3. If those tag intervals are dispersed to disk pages, P2, P3, and
P5 as shown in Fig. 1-(b), however, a query processor usually require the additional cost
about accessing two pages, P2 and P5. To minimize the cost of disk accesses, logical
closeness between tag intervals in the same disk page should be higher than logical
closeness to others.
(a) All tag intervals accessed by the query Q
i
are
stored in P3
(b) Tag intervals accessed by the query Q
i
are stored in P2, P3, P5
Fig. 1. An example of different access cost of the disk
Distance between two tag intervals on the data space should be computed for measuring
logical closeness between them. If the distance measure keeps logical closeness between tag
intervals, we can say that the nearest tag interval to a specific tag interval has the shortest
distance to that tag interval. The distance is normally measured based on proximity between
domain values on the data space. Thus, we need to examine the characteristic of each
domain’s proximity in order to keep correlation between the distance and the logical
closeness.
The TIME domain in 3-dimensional space should provide chronological closeness between
tag intervals. We usually achieve this closeness with assigning timestamps based on the
temporal proximity in the TIME domain. The TID is the fixed identifier, which is related to
Electronic Product Code (EPC), for a tagged item. The EPC can be composed of three parts –
Company, Product and Serial. Since the EPC scheme assign an identifier to a tag by a
hierarchical manner with three parts, the TID can imply logical closeness between grouped
tags.
A tag produces a dynamic flow while moving between business locations. Since a query for
tracing tags would give tag’s traces, the LID domain should provide the closeness of tag
intervals about tag movements. On the contrary to the TID, the LID is not the predefined
identifier. We can assign business locations to LIDs by various numbering methods. For
example, it can be some lexicographic method for measuring the distance in an RFID
applied system. It is also possible to apply spatial distance measure such as Hilbert curve, Z-
ordering, and Row-Prime curve. Figure 2 shows an example of numbering LIDs for
describing business locations and read points.
Despite the existence of various LID numbering methods, the problem is that they do not
have an inherence property of proximity for providing logical closeness related to the