Quantitative Techniques for Competition and Antitrust Analysis_16 pptx
Bạn đang xem bản rút gọn của tài liệu. Xem và tải ngay bản đầy đủ của tài liệu tại đây (269.46 KB, 35 trang )
10.1. Rationales for Vertical Restraints and Integration 513
10.1.3.1 Territorial Restrictions
Territorial restrictions are normally used to reduce intrabrand competition down-
stream. When sales and service efforts by the retailer are important to the manufac-
turer, they will want to ensure that retailers reap the rewards of their investments in
service quality. By granting exclusive rights of sale in a given territory to a single
retailer or a group of retailers, the manufacturer can ensure that retailers in different
areas do not free ride on each other’s investment. By eliminating the capacity to
attract shoppers from other territories, the horizontal pricing externality, whereby
retailers hurtthe manufacturer by lowering prices to steal customers from each other,
is also removed. It is, of course, essential for this practice to have the desired effect
that arbitrage opportunities are eliminated. That said, exclusive territories actively
prevent competition between retailers and therefore may clearly potentially have
important anticompetitive consequences. Indeed, it is exactly the “horizontal pric-
ing externality” which competition authorities usually fight very hard to protect
precisely because it results in low prices for consumers. In an extreme case, with a
monopoly manufacturer and a set of retailers who, absent the territorial restrictions,
would otherwise compete, territorial restrictions could enforce a market division
arrangement entirely equivalent to explicit collusion between the retailers. To eval-
uate such a policy we may need to evaluate the way in which consumers trade off
potentially higher prices for goods against any higher quality of service provided.
Territorial restrictions as described above have been a tradition in the car sales sec-
tor in Europe, where markets were traditionally defined as national, with a distribu-
tion system characterized by exclusive dealing and geographic restrictions, including
a restriction by manufactures of cross-border sales. In 2002, the European Commis-
sion concluded that exclusive dealing agreements between car manufacturers and
car dealers as well as the exclusive sales territories granted by the manufacturers to
the dealers were not justified on grounds of efficiency as the consumers were “not
getting a fair share of the resulting benefits.”
12
The European Commission issued
new conditions for the sale of cars in the European Union notably imposing the
right of exclusive dealers to sell to operators outside of the manufacturer’s official
network.
13
10.1.3.2 Resale Price Maintenance: Minimum Price
An alternative way to induce retailers to provide the level of services, sales effort, or
advertisement that is optimal for the manufacturer is to establish a minimum sales
price thereby restricting price competition. Firms could, for example, simply refuse
12
“Commission adopts comprehensive reform of competition rules for car sales and servicing”
IP/02/1073 of 17/07/2002 available at />1073&format=HTML&aged=0&language=EN&guiLanguage=en.
13
Commission Regulation (EC) no. 1400/2002 of July 31, 2002 on the application of Article 81(3) of
the Treaty to categories of vertical agreements and concerted practices in the motor vehicle sector.
514 10. Quantitative Assessment of Vertical Restraints and Integration
to sell to retailers who charge a retail price below an established minimum. For
instance, in the second half of the 1990s, music recording companies in the United
States allegedly notified music retailers that, if they advertised music CDs at a price
less than a stipulated amount, the recording companies would withdraw the financial
support for advertisement and sales that they usually granted to those retailers. Those
advertisement and promotion payments were an important source of revenue for
retailers and the rule was alleged as a de factoestablishment ofa pricefloor, triggering
a multidistrict class action by purchasers of prerecorded music against the music
majors.
14
Because resale price maintenance can also facilitate collusive agreements
and was, until the Leegin
15
decision, a per se offense in the United States, the
recording companies allegedly tried to circumvent the antitrust statutes by penalizing
advertised prices as opposed to sales prices. Recording companies claimed that
some electronic and mass merchant stores were setting low prices of popular CDs to
attract customers into their stores, thereby undercutting specialized music stores that
provided services such as listening stations, in store advice, and promotional events.
Those services resulted in an increase of music sales that was allegedly essential to
the music business. The case was finally settled in 2003 for $143 million and the
practice of establishing a minimum advertised price was terminated.
16
It remains a
useful illustration of an alleged attempt by manufacturers to prevent aggressive price
competition at the retail level that appears to have been dramatically decreasing the
provision of services and sales effort. Of course, the per se status of RPM during
that case meant that it was not necessary to show that consumers suffered harm as a
result of the practice. Following Leegin, that will no longer be the case in the United
States and as a result such cases will probably be far harder to prosecute in either
public or private antitrust spheres.
In Europe, in general the attitude to RPM is less permissive than the new legal
regime in the United States. Specifically, in the EU, RPM is currently treated as a
hardcore pricing restriction that is illegal unless the parties bring forward substanti-
ated claims of efficiencies, that is, there is a “rebuttable presumption of illegality.”
17
One stated reason is that RPM is often associated with increasing prices. RPM can
also be used as a facilitating device to cartelize retailers’prices because it effectively
sets final retailer prices across retailers by way of a contract. What may look like a
vertical contract may on occasion be a device for horizontal price fixing with neg-
ative consequences for final consumers. The challenge for antitrust agencies under
14
In re Compact Disc Minimum Advertised Price Antitrust Litigation, M.D.L. no. 1361 (U.S.D.C. Me).
15
Leegin Creative Products Inc. v. PSKS Inc., Supreme Court of the United States, June 28, 2007.
16
District of Maine, In re Compact Disc Minimum Advertised Price Antitrust Litigation, M.D.L.
Docket no. 1361 Litigation Decision and Order on Notice, Settlement Proposals, Class Certifications,
and Attorney Fees.
17
RPM is considered an “object” restriction under Article 81 of the EC treaty (and its U.K. embodiment,
the Competition Act, 1998). As a result RPM is viewed as harmful by object—that is, very likely to be
anticompetitive so that a harmful effect may be presumed.
10.1. Rationales for Vertical Restraints and Integration 515
a rule-of-reason approach is to tell apart the efficient use of RPM from its potential
far less benign use.
10.1.3.3 Exclusive Dealing
Exclusive dealing, also called single branding, occurs when the upstream firm
requires or induces the retailer to only sell its brand. There can be an explicit require-
ment for exclusive dealing or alternatively such an outcome can be generated via
a carefully designed pricing structure. For example, we may de facto see exclusive
dealing if advantageous rebates are granted only to those retailers who purchase all
their products from a single provider, the result will effectively enforce an exclusive
dealing arrangement. There are, of course, many entirely valid substantial reasons
that an upstream firm may want this type of contractual arrangement. One clear moti-
vation may be a desire to protect their own investment in advertisement and quality
by preventing retailers from steering consumers who arrive in the store to lower-
priced, less well-known rival products once the consumer is in the store. Retailers
might have an incentive to do so if rival products were able to provide retailers
with higher margins despite lower sales prices, for example, because few advertis-
ing costs were incurred. Thus exclusive dealing may solve a horizontal externality
across producers within the retailer. A related example may arise if a manufacturer
invests in its distribution channels to increase the level of service and promotional
activity. It is possible that a retailer might choose to use these skills or resources to
promote products from other producers. The contract in that case provides a mech-
anism for the retailer to credibly commit not to engage in such activity and thereby
provide the manufacturer with incentives for promotion to the potential benefit of
both firms and also quite probably consumers. On the other hand, exclusive dealing
may also provide a mechanism for foreclosure.
18
10.1.3.4 Tying and Bundling
Tying and bundling are also ways in which manufacturers can condition the deci-
sions of retailers downstream. These practices consist of conditioning the sale of a
good on the sale of another, usually complementary, good. This can be done, for
example, through a contractual obligation or because the pricing structure renders
it unprofitable to purchase the two goods separately. An example might be aircraft
engines and aircraft instrumentation.
There is a large body of literature analyzing the reasons for tying and bundling.
The explanations range from quality concerns to price discrimination and of course
simple transaction cost advantages. Bundling can also be motivated by potential
economies of scale and scope in production or distribution that allows the firm to
18
See, in particular, the foreclosure models discussed by Salop and Scheffman (1983), Comanor and
Frech (1985), Schwartz (1987), Mathewson and Winter (1987), Rasmusen et al. (1991), Bernheim and
Whinston (1998), Segal and Whinston (2000), and Simpson and Wickelgren (2007).
516 10. Quantitative Assessment of Vertical Restraints and Integration
lower prices and increase sales by bundling the sales of several products. In theory,
tying complementary goods can increase the incentives to lower prices since the
firm will benefit from the increase in the demand of the initial product and also the
tied product. In the case of metering and price discrimination, the outcome is less
clear and will vary across customers.
Although tying can have many nonexclusionary motivations, it can nevertheless
also lead to intended or unintended foreclosure on the market. Whinston (1990)
and Nalebuff (1999) among others analyze the incentives to tie and present conclu-
sions for stylized examples involving assumptions about the consumer valuation of
the tying product, the link between the valuations of the tied and tying products,
and the nature of competition in the tied market (see also Bakos and Brynjolfsson
1998; Carlton and Waldman 2002). Whinston (1990) illustrates that a monopolist
can, under some circumstances, profitably foreclose a market by tying and thereby
commit to a low price for the bundle. His results also show that even though tying
complementary products is less “costly” for the firm, the incentives to tie are also
less obvious unless some particular conditions are fulfilled. Nalebuff (1999) shows
that with heterogeneous preferences, bundling for complementary products can be
profitable and foreclosure can be achieved. In a dynamic market characterized by
innovation tying can also be used to weaken or foreclose potential competitors (Choi
2004; Carlton and Waldman 2002).
This literature contrasts sharply with the position taken by the Chicago school,
who heavily critiqued what they called “leverage theory.” Proponents of that view
argued that if a firm had a monopoly in one good but faced competition in a sec-
ond complementary product and consumers desired the goods in fixed proportions,
then a “one-monopoly-profit” argument holds. Specifically, the monopolist in the
first product need not monopolize the second market to extract monopoly profits.
Two recent empirical papers consider variants of this debate. Chevalier and Scott
Morton (2008) consider a horizontal version of the one-monopoly-profit argument
arising from tying casket sales and funeral services together and their results favor
the one-monopoly-profit argument. However, Genakos et al. (2006) find evidence
that incentives for foreclosure exist empirically, looking at Microsoft’s incentive to
leverage its monopoly in the “client operating system market” (aka regular Win-
dows) to the “server operating system market” (aka Windows for network servers).
In particular, they find that an incentive to leverage market power can exist provided
perfect price discrimination is not possible for a monopolist. If so, then leverage
can become a method that can help a monopolist to extract more rents from the
monopoly market.
19
19
In support of their theory the authors report that in 1997 Microsoft’s Chairman Bill Gates wrote in
an internal memo: “What we’re trying to do is to use our server control to do new protocols and lock out
Sun and Oracle specifically. . . the symmetry that we have between the client operating system and the
server operating system is a huge advantage for us.”
10.1. Rationales for Vertical Restraints and Integration 517
10.1.3.5 Refusals to Deal
There exist cases of straight refusal to deal whereby a firm upstream simply refuses
to supply a firm downstream that wants its output as an input. The legal treatment
of this type of conduct varies under different jurisdictions. Increasingly, the goal of
protecting the incentives for innovation and large upfront investments is balanced
against the benefits that an access to the input would generate through a more intense
competition downstream. In general, refusal to deal is unlikely to be regarded as
a problematic action unless the upstream firm has some degree of market power.
One important source of upstream market power may arise from the fact that a firm
operates an essential facility. A deepwater port is an example of something that may
be considered to be essential facility. A country may, for instance, have only one
or two deepwater ports suitable for handling large cargo vessels. Entry, building a
new port, is fairly obviously costly and may be impossible depending on geography,
while transport costs for goods within a country may mean a given port owner has
substantial market power. The difficulty for antitrust authorities is that there will
also be cases in which the firm stops supplying a downstream firm with which it was
previously trading for perfectly legitimate reasons. The termination of a relationship
with a firm downstream may occur because the supplier thinks the intermediate firm
is not keeping up with quality standards or otherwise not fulfilling aspects of an
explicit or implicit contract. It may also be the result of changes in market conditions
that affect the incentives of the firm upstream, for instance, changes in costs meaning
that marginal units become loss-making. Clearly, even a dominant firm should not
be forced to sell goods at a loss if economic efficiency is our aim. Thus, an antitrust
authority must attempt to distinguish “legitimate” refusals to deal from illegitimate
ones. Quantification of the effect of refusals to deal are generally quite difficult and
involve comparing the outcome of a world where a business exists with one where
the business does not exist. Perhaps as a result, to date, the assessment of refusal to
deal cases has therefore been primarily qualitative in nature.
10.1.4 Effects of Vertical Restraints on Market Outcomes
To summarize this first section of the chapter, the theoretical effect of vertical
restraints on consumer welfare is, in many cases, ambiguous. On the one hand there
are numerous potential motivations for vertical restraints that are entirely innocent
and unlikely to cause legitimate concern to antitrust authorities. On the other hand
vertical restraints may also facilitate outcomes that should be of concern to agencies
seeking to make markets work well for consumers. Vertical restraints can sometimes
be used as mechanisms to soften competition. In extreme cases the incentive to com-
pete on prices can be entirely eliminated by the existence of such restraints. In other
cases, vertical restraints may result in foreclosure of either inputs or customers.
The bottom line is that economic theory does not allow general conclusions about
whether vertical restrains are “good” or “bad” for welfare. In any given instance
518 10. Quantitative Assessment of Vertical Restraints and Integration
the question is an empirical one, which means the competition authorities must first
attempt to determine the circumstances in which a vertical practice may be cause for
concern and should therefore be the object of scrutiny. Second, they must attempt
to evaluate whether or not the vertical restraint should be banned or restricted for
the benefit of consumers.
Because theoretical predictions are not always, or even usually, clear about the
net effect of vertical contractual arrangements on either total or consumer welfare,
there have been a limited but perhaps increasing number of attempts to empirically
assess the effect of vertical practices in both the case and academic literatures. In the
next section, we present a number of different methodologies that have been used
to try to assess the effect of vertical restraints. In looking at each example we will
strive to illustrate both the benefits and limitations of such exercises.
10.2 Measuring the Effect of Vertical Restraints
In the first section of this chapter we established that the motivations for vertical
restraints are many and also that the theoretical predictions regarding the effect of
these practices on welfare are often ambiguous. Sometimes a vertical restraint will
solve an important externality problem to the benefit of both firms and consumers.
On other occasions, it is exactly the externalities that drive good outcomes for
consumers and so removing them via a vertical restraint generates poor outcomes
for consumers. An example is when a vertical restraint acts to remove the horizontal
pricing externality between firms, the one that usually means that competition leads
to low prices and high-quality goods.
Sometimes the ultimate goal of the practice is outright foreclosure and the result
may be higher prices and lower output with no concomitant efficiency gains. On
other occasions, the two effects will cumulate. Empirical analysis is a way to try
to determine the effects of vertical restraints on consumer welfare in a particular
case. Unfortunately, precisely because many of the effects we are trying to isolate
are difficult to measure, it is particularly difficult to undertake an effects-based
analysis of vertical restraints. Empirical strategies that have been used to determine
the effects of vertical arrangements include regression analysis, particularly fixed-
effects regressions, natural experiments, and event studies. Each is familiar from
elsewhere in the book. However, it is important to note that such methods can only
potentially help solve identification issues when there are data available on the
situation with and without the practice. Ex ante analysis requires the construction
and estimation of a structural model, which is very difficult to do without making
stringent and quite possibly unrealistic assumptions about firm behavior. We discuss
each of the available strategies in the rest of this chapter. Before doing so we briefly
discuss informal and semiformal quantitative methods for evaluating the incentive
for foreclosure.
10.2. Measuring the Effect of Vertical Restraints 519
10.2.1 Informal and Semiformal Analysis of Incentives
Informal quantitative analysis can sometimes be insightful for evaluating the incen-
tive for foreclosure. An example of such an analysis was provided involving a merger
between English, Welsh and Scottish Railway Holdings (EWS) and Marcroft Engi-
neering (Marcroft). EWS is a freight haulier on the railways, whereas Marcroft was
a provider of railway maintenance services mainly serving the rail freight industry.
The United Kingdom’s Office of Fair Trading (OFT) in its phase I investigation con-
sidered whether EWS would have an incentive to foreclose access to the Marcroft
maintenance depots since by doing so it could potentially harm its competitors in
the downstream rail haulage market. To evaluate this option the OFT considered
(1) the potential returns in the downstream market to foreclosure and also (2) the
cost of foreclosing access to the Marcroft maintenance facilities. The OFT decision
document notes from company accounts and information provided by third parties
that both volume and profit margin are lower in the upstream maintenance market
than they are in the downstream freight haulage market.
20
Assuming the margins
do not change, a rough calculation of the incentive to foreclose would involve an
evaluation of loss in upstream profits from maintenance
Profit
Maintenance
D Margin
M
Volume
M
against the gain from higher downstream profits from haulage
Profit
Haulage
D Margin
H
Volume
H
:
Obviously, even these simplified expressions involve changes in volume rather than
the levels of volume, but the OFT may have believed that the expected changes
in volume would be reflective of the overall levels of each activity. Thus, since
Margin
H
> Margin
M
and if
Volume
H
> Volume
M
H) Volume
H
>Volume
M
:
Then
Profit
Haulage
D Margin
H
Volume
H
>Profit
Maintenance
D Margin
M
Volume
M
:
Obviously, such a rough calculation involves some very strong assumptions as are
appropriate for an authority exploring whether there is the potential justification
for further investigation. In the end the OFT decided to refer the merger to the
U.K. Phase II merger body, the Competition Commission, but decided that since
it had also found potential horizontal problems with the merger, it did not need to
come to a final view on the potential vertical concerns. In the end the CC accepted
20
See, in particular, paragraph 43, OFT decision document available at www.oft.gov.uk/shared oft/
mergers
ea02/2006/railway.pdf.
520 10. Quantitative Assessment of Vertical Restraints and Integration
undertakings from the company involving the divestment of part of the Marcroft
maintenance business.
21
In 2008, the European Commission investigated a vertical merger involving the
upstream market for the databases that allow the construction of navigable digital
maps (NDMs) and the downstream market involving various electronic navigation
devices.
22
Specifically, TomTom, a producer of personal navigation devices (PNDs),
proposed a merger with the navigable digital map database provider TeleAtlas.
23
Public documents do not allow a complete reconstruction of the calculations per-
formed to evaluate the total foreclosure story considered by the Commission, but
nonetheless exploring the example is instructive.
The vertical arithmetic approach suggests that to evaluate the plausibility of either
a total or partial foreclosure theory of harm, the competition agency should evaluate
the loss of profit upstream and the potential gain in profit downstream. Doing so
allows an evaluation of the incentive to engage in foreclosure. Under a total fore-
closure strategy, the vertically integrated firm will lose profits upstream because it
stops selling to the “merchant market”—those firms competing with its downstream
subsidiary. That means those rivals will face higher costs because, according to the
theory of harm, they will have to buy from rival upstream suppliers who no longer
face competition in supply and so will raise prices. In the TomTom–TeleAtlas case
this total foreclosure theory of harm amounts to TeleAtlas deciding to stop compet-
ing for the custom of rival PND companies that need navigable maps to build their
navigation devices. As a result, TeleAtlas’s rival Navteq would face a reduction of
competition and be able to increase prices (or more generally follow some other
strategy such as reduce quality).
21
See www.competition-commission.org.uk/inquiries/ref2006/marcroft/index.htm for further details.
22
We willnotdivert our discussion withadetailedevaluationofthevarious marketdefinitions.However,
we do pause to note there that the Commission came to the view that: (1) Upstream there was demand-side
substitution between the navigable digital maps provided by TeleAtlas and Navteq. However, there was
no demand-side substitution between navigable maps and more “basic” digital maps which could not be
used for real-time navigation while driving your car. Moreover, the Commission received estimates that
it would take something like 1,000–2,000 people five to ten years to upgrade a basic map to the quality of
a navigable map. Thus there was neither demand nor supply substitution. Geographic markets upstream
were left ambiguous as they were judged not to affect the conclusion of the analysis. (2) Downstream,
the Commission noted that there were various forms of navigation devices: personal navigation devices
(in the form of a handheld device that you could put in your car), maps on personal digital assistants,
“in-dash” navigation devices (navigation devices built into car dashboards), and GPS enabled mobile
phones. The Commission after looking at the evidence decided that PNDs constituted a downstream
market in itself.
23
See Case no. COMP/M.4854 TomTom/TeleAtlas. At around the same time Nokia (the mobile phone
producing company) merged with TeleAtlas’s main rival navigable map producer, Navteq. (See Case no.
COMP/M.4942 Nokia/Navteq.) Both mergers were ultimately cleared. The analysis undertaken in these
mergers was widely seen as testing the European Commission’s latest vertical (nonhorizontal) merger
guidelines, which were adopted in November 2007. The new set of guidelines was developed partly in
response to criticisms from the Court of First Instance following the European Commission’s controver-
sial decision to block the proposed merger between GE and Honeywell. (See Case no. COMP/M.2220
General Electric/Honeywell.)
10.2. Measuring the Effect of Vertical Restraints 521
Downstream rivals
Merging
firm
P
TT
R
Rivals
(
p
TT
;
c
0
)
P
Rivals
R
Rivals
(
p
TT
;
c
Higher
)
R
TT
(
p
Rivals
;
c
Lower
)
R
TT
(
p
Rivals
;
c
0
)
E
1
E
2
E
1
= Start
E
2
= Finish
Figure 10.1. The impact of a vertical merger on own and rivals’ costs.
In effect, a vertical merger followed by input foreclosure by the vertically inte-
grated firm would mean that (1) TomTom’s competitors in the downstream market
would face higher input costs following the merger while (2) TomTom itself, as the
downstream division of a vertically integrated firm, would be able to reduce its costs
if vertical integration has aided the reduction or avoidance of double marginaliza-
tion. In the case of TomTom–TeleAtlas we know from the Commission’s decision
document that pre-merger upstream gross margins were high, approximately 85%.
The reason is that developing a digital map involves a great deal of essentially fixed-
cost investment while the resulting database can subsequently be duplicated at low
marginal cost. That means that if pre-merger vertical contracting was not able to
solve the double marginalization problem, then TomTom’s (TT’s) marginal costs
could decline considerably post-merger. At the same time, rival downstream firms
would, according to the theory of harm, face higher input costs as they would now
suffer from a lack of competition upstream.
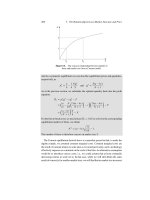
Figure 10.1 presents the impact of vertical integration when it (1) reduces dou-
ble marginalization for the merged firm and (2) increases marginal costs for rivals
because the merged firm follows a foreclosure strategy. The former effect shifts TT’s
reaction function downward while the latter effect shifts the rival’s reaction function
rightward to reflect an increase in input costs (for any given price of TT, rivals will
now choose to charge a higher price).
Figure 10.1 shows that the impact of such a change on downstream competitive
outcomes can involve lower prices for the vertically integrating firm as well as poten-
tially higher prices from its downstream rival(s). Naturally, the aggregate welfare
impact of such a change will depend on the relative magnitudes of the consequent
profit and consumer surplus gains and losses. It is this observation that induces
many agencies to choose a framework for vertical merger analysis which includes
an analysis of ability, incentive, and consumer harm. That said, those competition
agencies whose statutory framework do not immediately “net-off” consumer sur-
plus gains and losses will note that some customers have lost out under a merger
522 10. Quantitative Assessment of Vertical Restraints and Integration
P
TT
R
Rivals
(
p
TT
;
c
0
)
P
Rivals
R
Rivals
(
p
TT
;
c
Higher
)
R
TT
(
p
Rivals
;
c
Lower
)
R
TT
(
p
Rivals
;
c
0
)
E
1
= Start
E
2
= Finish
E
1
E
2
Figure 10.2. The impact of a vertical merger on own and rivals’ costs (2).
that led to this outcome, even if ultimately overall consumer welfare is higher, per-
haps because the vertically integrating firm has a far larger share of the market who
benefit from lower prices post-merger.
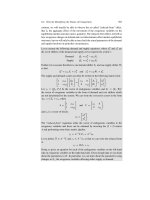
Figure 10.2 shows that when the integrating firm benefits from removing dou-
ble marginalization are small relative to the magnitude of the effect of increased
costs suffered by rivals in the downstream market, the outcome will tend to involve
the prices charged by all firms increasing. Such an outcome would clearly be
unambiguously bad for consumers, all else equal.
Taking some data from the TomTom–TeleAtlas case, according to the case docu-
ments, there were unit sales of 10.8 million NDMs for PNDs with an average selling
price of €14.6. Moreover, pre-merger TeleAtlas sold their database to TomTom and
also to other downstream producers, who accounted for between 10 and 30% of
the downstream market,
24
that is, between 10:8 0:1 D 1:1 and 10:8 0:3 D 3:2
million units. TomTom’s downstream rivals include Garmin, Mio-Tech & Navman,
Medion, and My Guide. Since the case tells us that gross margins were 85%, a
foreclosure strategy would involve sacrificing profits (or at least a “contribution”
to upstream fixed costs) of between €14:6 1:1 0:85 D €13:7 million and
€14:6 3:2 0:85 D €39:7 million.
To simulate the potential gain downstream, in principle we could analyze the
static downstream game and then make reasonable assumptions about the changes
in costs that TomTom and also rivals were likely to experience following a merger
and a decision by the vertically integrated firm to pursue a foreclosure strategy. This
was the type of calculation undertaken by the European Commission. Unfortunately,
there is not sufficient information in the public domain to repeat the Commission’s
simulation exercise, but the reader familiar with the analysis of the differentiated
product Bertrand pricing game presented in chapter 8 will be able to see exactly how
24
Only a range is available in the public decision document.
10.2. Measuring the Effect of Vertical Restraints 523
such an exercise could be performed, given the analysis presented in figures 10.1
and 10.2. Rather than present the full calculations, we present a rough back-of-
an-envelope calculation, looking directly at the change in profits associated with a
potential change in market shares and margins.
First note that if subscript “0” denotes pre-merger and subscript “1” denotes post-
merger prices, quantities, and costs, then we can write the impact on downstream
profits as
TomTom
.p
1
c
1
/q
1
.p
0
c
0
/q
0
p
1
p
1
c
1
p
1
q
1
p
0
p
0
c
0
p
0
q
0
:
Now suppose, in particular, that TomTom’s pre-merger market share was 40% and it
were to grow to 45% if TeleAtlas–TomTom followed a foreclosure strategy. Doing
so would mean its sales would grow from q
0
D 0:4 10:8 D 4:31 million to
q
1
D 0:45 10:8 D 4:85 million, a growth of 0.53 million customers per year. In
the downstream market, gross margins were reported to be between 0 and 50%, so
suppose 25% while average final price pre-merger was p
0
D €200. For simplicity,
suppose that downstream gross margins did not change pre- and post-merger while
prices did fall by some amount because some of the reduction in database input
costs was passed through to final consumers. With a gross margin of 85% upstream
and a pre-merger average selling price upstream of €14.6 per unit, the reduction in
TomTom’s marginal cost may be as large as 0:85 14:6 D €12:4. Thus final prices
would be between €200 and €187.6, depending on the extent of the pass-through
of the cost reduction to final customers. Supposing pass-though were 50%, then we
would have p
1
D €193:8 and hence the increase in downstream profits would be
TomTom
p
1
p
1
c
1
p
1
q
1
p
0
p
0
c
0
p
0
q
0
D 193:8 0:25 4:85 200 0:25 4:31
235 215:5
D 19:5 m:
This figure is within the range of estimated lost profits upstream of between €13.7
million and €39.7 million, so that the calculation does not make a clear case either
for or against the incentive for total foreclosure. However, in most jurisdictions,
the burden of proof is on the competition agency to establish the harm likely to be
caused by a merger and, if so, this calculation would suggest that burden of proof
would not be discharged.
Obviously, we have made a lot of assumptions in this rough calculation and a more
careful calculation would get closer to real numbers for the potential upstream losses
and downstream gains from foreclosure. For now we note that while our back-of-the-
envelope calculation does not make a clear case for or against the incentive for total
524 10. Quantitative Assessment of Vertical Restraints and Integration
foreclosure, such a calculation can help us to explore which alternate assumptions
(e.g., about captured market share, downstream margins and how they are likely
to change, and pass-through rates) that would provide grounds for either concern
or reassurance. Naturally, in such an evaluation it will be important to think about
the realities of the market place. For example, one downstream PND producer,
Garmin, had signed a fairly long-term contract with Navteq in 2007, due to expire
in 2015, although even then there was an option to extend until 2019. Such a contract
meant that for at least seven years Navteq would not be able to increase prices for
its database to a major downstream producer. Such a fact is clearly important in
evaluating the likely profitability of a downstream foreclosure strategy premised on
the idea that Navteq would have the incentive and ability to be able to raise the price
of its database to TomTom’s downstream rivals.
Before closing this discussion of foreclosure strategies, we make three further
comments. First, we note the important contribution from Hart and Tirole (1990).
Their paper suggests that a total foreclosure strategy may not ultimately be an equi-
librium in a static game since a firm attempting to foreclose downstream competitors
may actually be better off (given the strategies of rivals) by deviating from the fore-
closure strategy by selling into the merchant market. Thus, Hart and Tirole suggest
that the commitment not to sell to the merchant market is not a credible one. Ordover
et al. (1992) disagreed and, more generally, the role of reputation and credibility
of commitments may be best studied within a repeated game context. Whatever the
appropriate scope of these theoretical concerns, the experimental evidence appears to
suggests that the commitment problem may not always be overwhelming (Normann
et al. 2001; Normann 2007).
Second, we note that within the context of a static model, partial foreclosure
models, where the firm may find it optimal to raise prices to the merchant market
and thus partially foreclose it, are not subject to the credibility concerns. They may,
however, result in fewer occasions where the actual economic effects of foreclosure
are harmful to consumers.
And, finally, we note that in the TomTom–TeleAtlas case there were potentially
important efficiency benefits from the merger, namely that cars driving around with
TomTom PNDs could actually send information back to TeleAtlas about where
drivers could and could not drive. The parties argued that, in the future, allowing
such information transfer from cars back to the database will reduce the cost of
collecting the detailed up-to-date information required for generating navigable
maps.
10.2.2 Regression Analysis of Vertical Integration
In this section we illustrate the use of regression analysis in the vertical merger
context. We begin by looking at the kind of data set that may be available from a
“natural experiment.”
10.2. Measuring the Effect of Vertical Restraints 525
10.2.2.1 Estimating the Effects of Vertical Integration in
the Retail Gasoline Market
An empirical attempt to determine the impact of vertical arrangements on consumer
retail prices in the gasoline market in the United States can be found in Hastings
(2004). That paper looks at the sale in California of Thrifty, a chain of independent
gas stations, to ARCO, a large U.S. oil company which is vertically integrated. The
sale occurred in March 1997 after the 75-year-old owner of the Thrifty gas stations
decided to retire. There was a 60-day waiting period after which all Thrifty stations
fell under the control of ARCO. Thrifty stations were just branded as ARCO and
placed under new contracts. Some of the gas stations became company operated and
others were leased to dealers who operated them under the ARCO brand. There was
no remodeling, expansion, or other investment in the gas stations. The rebranding
process was completed in September 1997.
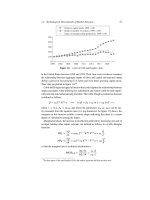
Hastings uses panel data of retail prices at the station level for four months in the
Los Angeles and San Diego Metropolitan Statistical Areas (MSAs). The data cover
the months of February, June, October, and December 1997 so that the data provide
information on a range of markets before and after the sale. Hastings (2004) assumes
that the geographic market definition is one mile along a surface street or freeway
around the petrol station. The sale of Thrifty to ARCO was arguably an event that
was largely independent of market conditions given the owner’s desire to retire, and
it generated an increase in vertical integration in some local retail gasoline markets
while in other markets the ownership structure remained unchanged. Specifically,
there were 669 stations in the price sample and 99 of them had a Thrifty within one
mile and therefore saw the structure of vertical ownership in the market as a result of
the acquisition change with an increase in the level of vertical integration of the retail
gas market. The data set appears therefore to provide a nice exogenous movement in
the extent of vertical integration in some markets whose effects on prices we should
be able to trace. Moreover, the fact that some markets were unaffected means that
we also have a “control” sample of markets which may allow us to control for any
other factors changing over the time period of the study. Doing so mean Hastings can
use a difference-in-differences approach to identification, comparing the change in
prices (before and after) the merger in markets which were affected with the change
in markets which were not.
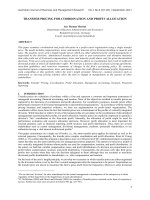
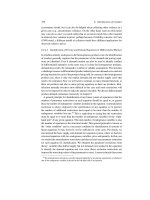
The data show that the average retail prices at gas stations that competed with
Thrifty increased after the sale relative to the retail prices at gas stations that were
not affected by the sale. This is shown in figure 10.3. Gas stations which have a
Thrifty station within one mile had prices 3 cents lower than the rest of the gas
stations before the sale. After the acquisition was completed in September 1997, the
average price for those same gas stations was 2 cents higher than the average price
of the gas stations unaffected by the sale. Hastings reports that a similar result was
obtained for the San Diego area and that she found no price difference among the
526 10. Quantitative Assessment of Vertical Restraints and Integration
December Februar
y
June October December
Competed with
a Thrifty
1.15
All other
stations
1.25
1.35
1.45
1.15
1.50
1.40
1.30
1.20
Retail price regular unleaded
Figure 10.3. Los Angeles gas prices: treatment and control. Source: Hastings (2004).
gas stations that converted to company-owned gas stations and those that became
dealer operated. These results suggest that vertical integration and the disappearance
of an independent retailer is correlated with, perhaps even causes, higher prices in
this particular market.
25
Before we conclude that the vertical merger causes higher prices, Hastings first
notes that a simple descriptive analysis such as that provided in figure 10.3 ignores
the effect of changing conditions in the market. It could be that demand or costs
increased in those areas where Thrifty was present, confounding the effect of the
change in ownership structure. To control for this, Hastings runs the following
fixed-effects regression:
p
jt
D C ˛
j
C ı
City;t
C c
jt
C Âz
jt
C "
jt
;
where is a constant, ˛
j
is a station-specific effect, ı
City;t
are a set of city/quarter
dummies, c
jt
is an indicator of whether the station becomes a company operated
station (as distinct from a dealer-operated station under lease), z
jt
is an indicator of
whether or not the station competes with an independent gas station, and "
jt
is the
error term. The fixed effects control for potential omitted variables that determine
prices and they turn out to be quite important in the regression, indicating that
there are in fact many unobserved determinants of the price at the local level. The
results of three variants of the regression are provided in table 10.1. The estimates in
column 3 suggest that there is a 5 cent increase in retail prices when there is no longer
an independent station in the market. There is no additional statistically significant
effect of becoming a fully integrated company-operated gas station compared with
becoming a dealer with a contractual relationship with the upstream company.
25
While the direction of these results is not in contention, Taylor et al. (2007) argue that in their closely
related data set the actual price difference appears to be considerably smaller, approximately 1 cent per
gallon before and after the transaction, a net effect of 2 cents per gallon rather than Hastings’s difference
of 5 cents per gallon. Since the FTC paper is a relatively new one, the reader may find that Professor
Hastings has subsequently responded to their paper. Whatever the resolution of that debate, the ideas
behind Hastings’s approach remain of substantial interest.
10.2. Measuring the Effect of Vertical Restraints 527
Table 10.1. Fixed-effects estimation of the effect of Thrifty’s acquisition.
Variable 1 2 3
Intercept 1.3465 1.3465 1.3617
(0.0421) (0.0415) (0.0287)
Company operated 0.1080 0.0033 0.0033
(0.0107) (0.0178) (0.0122)
Independent — 0.1013 0.0500
(0.0143) (0.0101)
LA
a
February — — 0.0180
(0.0065)
LA
a
June — — 0.0243
(0.0065)
LA
a
October — — 0.1390
(0.0064)
SD
a
February — — 0.0851
(0.0036)
SD
a
June — — 0.0304
(0.0036)
SD
a
October — — 0.0545
(0.0036)
Adjusted R
2
0.3772 0.3953 0.7181
F -test for no fixed effects:
Numerator DF: 668
Denominator DF: 1999
F value: 3.262 Prob. >F: 0.000
Hausman test for random effects:
Hausman’s M value: 622.296 Prob. >M: 0.000
a
Standard errors in parentheses. Source: Table II, Hastings (2004).
One area of particular concern arises from the fact that the merger results in a
change of an unbranded product into a branded product and that may explain the
price rise, once again independent of any effects of the vertical integration on prices.
The potential importance of branding is fully explored in the paper. In an attempt to
address this concern, Hastings breaks up the “treated group,” those gas stations that
were formerly competing with an independent station, into gas stations with a strong
brand presence in California (Chevron, Shell, or Unocal), gas stations with medium
brand presence (Exxon, Mobil, or Texaco), and gas stations with low brand presence
(Beakon, Circle K, or Citgo). The effect of the disappearance of an independent
competitor is stronger on those gas stations that have a lower brand presence and is
smallest on the gas stations with established brands. That suggests that the branding
effect may indeed be rather important in driving the price increase. Inasmuch as
the structure of vertical ownership is changing the degree of product differentiation
528 10. Quantitative Assessment of Vertical Restraints and Integration
downstream, we could go so far as to argue that the increase in gasoline retail prices
after the sale of Thrifty is a vertical effect. However, the empirical exercise leaves
us with a distinctly more subtle question than the one we began with. Despite the
apparently extremely clean natural experiment in the data, to evaluate the impact
of the change in vertical structure on consumer welfare, in this case, because the
vertically integrated firm already had a downstream brand we must evaluate whether
the increase in branding (probably appropriately considered an aspect of product
and/or service quality) is sufficiently valued to justify the price increase that we
identified. We examine methods capable of evaluating such trade-offs in the next
section.
10.2.2.2 Estimating the Effects of Vertical Integration in the Market for Cable TV
Another interesting attempt to empirically measure the effect of vertical integra-
tion examined the U.S. cable television industry and is provided by Chipty (2001).
The paper looks at the effect of vertical integration between programming and dis-
tribution services in cable television. However, the essence of the paper uses two
methodologies which may each generally be useful for assessing the way in which
consumers trade off the various combinations of price and quality which may arise
from vertical contracting. For example, a number of the models we examined in
the first part of the paper found that vertical contracting arrangements may result
in higher prices but also perhaps greater service provision. Such a defense would
probably be easy for any company whose vertical restriction was in fact anticom-
petitive to at least allege. Chipty (2001) provides us with two approaches to assess
this argument. First, she uses an approach which is familiar from earlier chapters,
specifically she examines a reduced-form regressions of equilibrium outcomes, in
this case a measure of quality and a measure of price, on demand and cost variables
together with variables that capture the extent of vertical integration. In doing so
she hopes to capture the independent effect of vertical integration on equilibrium
outcomes. Second, she suggests a method for at least telling whether consumers do
in fact sufficiently value the services being provided to make consumers better off
in vertically integrated markets all else equal. Each of these pieces of evidence are
provided from an industry where there was at least anecdotal evidence that verti-
cal integration of cable system companies and content providers was resulting in
refusals by cable operators to carry rival programming services.
Before discussing these two methods, it is worthwhile spending a few moments
providing a little background on the industry. To that end, the vertical structure of
the cable television industry in the United States is broadly as follows. Producer
companies such as Paramount or Universal sell their media productions (films, TV
shows) to program service providers such as HBO or AMC, which in turn sell the
program content to cable system operators. Those cable operators are typically local
10.2. Measuring the Effect of Vertical Restraints 529
monopolies in their markets.
26
They provide the final consumers with different sets
of packaged channels at given prices. Chipty considers the vertical integration of
service providers such as HBO (upstream) with cable system operators such as
Comcast or TCI (downstream).
One very nice feature of this market for empirical work is that there are lots of
distinct local markets for cable providers. Moreover, those local markets exhibit
different degrees of vertical integration between the program services and the cable
system operators.
Chipty (2001) wishes to investigate the actual effect of vertical integration on
foreclosure, a difficult problem in a context where there is no one–zero classification
for markets which have been “foreclosed.” Instead of attempting to construct such
a variable and perform a regression analysis, she proposes to study the way that
observed market outcomes at the retail level vary across vertically integrated and
nonvertically integrated markets. In doing so she hopes to consider in the round the
effect of vertical integration on outcomes and ultimately consumer welfare. She uses
1991 data from the Television and Cable Factbook. The database comprises 11,039
cable franchises in the United States that are operated by 1,919 cable systems, which
are in turn owned by 340 cable system operators, which may own more than one
cable system brand. The data provide information on the structure of ownership, the
channel capacity, the number of homes with access to cable in the franchise area, the
cable system’s program offer, the price, and the quantity of subscribers. There are
also data on 133 program services (excluding pay-per-view and satellite) including
eight premium services such as movies, one general entertainment, and two sport
programming services. Data on the demographics of the market such as population
size, fraction over 65 years old, or household size were taken from the 1988 City
and County Data Book and USA Counties 1994.
Vertical integration occurs in this context when the cable operator owns any part
of a program service that serves the franchise area. In principle, vertical integration
could lead to foreclosure and harm to consumers from increases in the prices of
the final good. On the other hand, it could increase product quality since there is a
higher incentive by the cable provider to offer premium channels as they will also
get the profits from the sale of that more expensive content.
The data used in Chipty (2001) show that, on average, a cable system provider
offers fifteen basic service channels and slightly more than three premium content
channels. Chipty uses the term “Basic system” to mean a cable system that is inte-
grated with a basic content provider. Such vertically integrated basic systems offer
twenty basic channels and four premium channels on average. Cable systems inte-
grated with premium content providers (which Chipty calls premium systems) offer
nineteen basic channels and slightly fewer than three premium channels. A sim-
ple look at these descriptive statistics therefore suggests that integration with basic
26
More recently, some companies have undertaken a process of “overbuilding” cable franchise areas
so that there are duopolies in some market areas.
530 10. Quantitative Assessment of Vertical Restraints and Integration
content providers increases the variety of the supply of both basic and premium
channels. Integration with suppliers of premium content providers increases the
supply of basic channels but slightly reduces the retail supply of premium content.
First, Chipty considers whether these results hold once we control for other fac-
tors that affect demand and supply, and that could potentially also be spuriously
correlated with the ownership structure. The approach will be familiar from earlier
chapters and involves running a reduced-form regression of the equilibrium out-
come (e.g., price or number of channels) on demand and cost factors as well as
an indicator variable for vertical integration. Variables such as the system age and
size, the size of the market, local population income, density, and age structure are
considered. Two proxies for quality are examined, so that the reduced-form regres-
sions are estimated for both the number of basic services (channels) offered and also
the number of premium services offered. In addition, Chipty considers the effect of
vertical integration on prices and penetration rates.
Chipty uses OLS so that no direct attempt is made in the specification to address
any potential endogeneity concerns that may arise due to the fact that vertical inte-
gration and the number of channels are both decisions made by the firm. Naturally,
it may be very difficult to find an appropriate instrument for vertical integration
and Chipty’s reduced-form results are therefore subject to the standard and poten-
tially important endogeneity critique that Hastings (2004) hopes to avoid with her
difference-in-differences approach.
While we do worry about endogeneity, at least such a reduced-form regression
specification could presumably be motivated by a sufficiently rich version of the
two-stage game we studied in chapter 5. Specifically, here we could motivate such
a reduced-form regression equation by making the vertical integration decision the
first stage of a game and the second stage generating the equilibrium outcomes of
shorter-run decisions including the number of basic and premium channels. In each
case it will be necessary to consider carefully the variables which are potentially
endogenous. As always, doing so involves considering the factors which, from doc-
uments, industry knowledge, and often quite “soft” information obtained during the
investigation may be determinants of the equilibrium variable being studied (e.g.,
number of channels) and which are not included through variables in the regression
model. Any such omitted or imperfectly proxied variables may be in the residual
of the model. It then remains to consider whether those omitted variables will be
uncorrelated with the explanatory variables that are included in the model.
27
Chipty finds that, vertical integration with basic content providers significantly
increases the number of basic channels (one additional channel) and does not sig-
nificantly affect premium content provision. The reduced-form regression results
suggest that integration with a premium content provider results, on average, both
27
Recall that OLS is only valid if EŒ" j x D 0, where " is the error term in the model and x is the
explanatory variables that are included in the model.
10.2. Measuring the Effect of Vertical Restraints 531
in fewer basic channels (one to two) and in one fewer premium channel (in partial
contrast to the results suggested by a raw comparison of means). By looking at the
channels actually provided, Chipty (2001) establishes that in fact premium systems
carry fewer rival premium channels and are also less likely to carry basic service
channels that may compete with premium content. This observation is consistent
with a foreclosure story, but since we have not yet examined prices, it is only one
element of such a story.
Next Chipty uses the reduced-form approach to examine the effect of vertical
integration on prices. Looking at the price effects, there appears to be an ambigu-
ous effect of vertical integration by both basic and premium systems. Integration
with premium content providers sharply decreases the price of basic services but
also sharply increases the price of premium content. Integration with basic content
providers has the opposite effect but the price effects are much smaller in magnitude.
Since both prices and the number of channels change following vertical integra-
tion, whether (and, if so, which) consumers are better off will clearly depend on
their relative value of the various price and quality of service effects that appear to
arise from vertical integration.
On other occasions reduced-form analysis may provide a clearer-cut answer. If
vertical integration, for example, led to lower service provision and higher prices,
then it seems unlikely that vertical integration (or vertical contracting) has solved an
externality problem and in doing so resulted in desirable outcomes for consumers.
In this case, however, we are faced with informative results that do not provide a
clear indication of foreclosure and simply cannot provide an outright answer as to
whether the outcomes are desirable or not. Many case teams would probably stop at
this stage and conclude that the case is unproven. However, Chipty (2001) attempts
to go further and evaluate the net consumer welfare effects by estimating a structural
model of consumer demand. Doing so moves us toward explicit modeling of the
various agents in a market, though in her case only of consumers. For that reason we
discuss the method in the next section under the general title of structural models.
10.2.3 Structural Modeling
Structural modeling requires that we specify demand and/or structural pricing equa-
tions or other supply-side decision equations. Doing so implies making assumptions
regarding the shape of consumers’ preferences and/or the nature of the competitive
environment. Where those assumptions are crucial in determining the results, one
must be sufficiently confident that they fit reality well. A particular problem with
using structural models in determining the effect of vertical contracts is that several
of the factors that determine and motivate those contracts are not well captured by
off-the-shelf models. For example, it is not easy to measure sales effort or to model
the mechanisms through which a change in price affects heterogeneous consumers.
532 10. Quantitative Assessment of Vertical Restraints and Integration
p
Basic
p
Basic
(a)
(b)
p
Premium
p
Premium
q
Premium
q
Basic
Figure 10.4. The interconnected demand equations for (a) basic
q
Basic
.p
Basic
;p
Premium
Is
Basic
;s
Premium
/ and (b) premium
q
Premium
.p
Basic
;p
Premium
Is
Basic
;s
Premium
/ cable.
Still, some attempts have been made to use structural models in order to identify the
effect of vertical arrangements.
10.2.3.1 Measuring Effects on Consumer Welfare
Evaluating the effects of market outcomes on consumer welfare generally requires
estimating demand function(s) since consumer welfare is often defined as the area
below the demand curve (see the discussion in chapter 1).
If we have information on prices and qualities with and without vertical integra-
tion, we can compare the two situations and examine the effect of vertical integration
on consumer surplus. Chipty (2001) estimates a demand system (illustrated in fig-
ure 10.4) with two demand functions, one for each of basic and premium cable.
The variable measuring quantity demanded is the penetration rate. The specification
also includes population variables affecting demand, the price of the service, and the
price of the complementary service (either premium or basic respectively). System
characteristics (system age and size) are used as identifying instruments. The results
of the estimation are presented in table 10.2.
The results produce negative own-price elasticities as predicted by the theory.
The price elasticity of basic cable is higher than that for premium cable, which
may reflect differences in the preferences between the “average” basic consumer
and the “average” basic plus premium consumer. If the latter are relatively inelastic
demanders, then this result is intuitive.
Chipty (2001) uses a particularly simple (but approximate) calculation of the
consumer surplus by adding the consumer surplus of the two different types of
customers in each case: those that buy basic and premium and those that buy basic
cable.
28
28
To calculate consumer welfare, there are various debates that must be addressed. First, whether one
should use a Hicksian demand curve, which keeps utility constant along the curve as opposed to income,
which is the variable kept constant along the most commonly used Marshallian demand curve. In this
case, because the income effect is assumed to be small, the author argues that both demands are practically
equivalent. Second, the fact that customers choose different options when faced with the same prices
10.2. Measuring the Effect of Vertical Restraints 533
Table 10.2. Demand estimates.
Panel A: with channel capacity
‚
…„ ƒ
Basic Premium
penetration rate penetration rate
‚
…„ ƒ‚…„ ƒ
Variable Coeff. t-stat. Coeff. t -stat.
Constant 2.673 1.949 0.933 1.076
Price of basic cable 0.255 4.459 0.021 0.892
Price of premium cable 0.012 0.215 0.046 1.698
Basic services offered 0.158 4.275 0.048 1.034
Basic program duplication 2.232 3.757 0.595 0.776
Offer AMC in the basic package
(1 = yes, 0 = no) 0.291 1.673
Natural log of income 0.267 2.132 0.131 3.575
Natural log of population density 0.120 3.808 0.005 0.294
Younger viewership 0.190 0.120 0.177 0.307
Older viewership 2.337 2.871 0.622 1.403
Nonwhite viewership 0.145 0.873 0.023 0.425
Household size 0.413 2.056 0.039 0.550
Natural log of television households 0.196 2.643 0.088 1.950
Area of dominant influence rank 0.289 2.422 0.108 1.763
Omnibus test for instruments 10.042
(0.123)
Source: Chipty (2001).
The penetration rate in each case gives the fraction of individuals in each group for
the markets that are vertically integrated and those that are not. Note that within each
group of consumers, consumers are assumed to be homogeneous. This is imposed
by the simple linear specification of the demand curve.
29
The results of the consumer
surplus calculation are shown in table 10.3.
In summary, Chipty (2001) finds that vertical integration increases consumer
surplus and that this increase is larger when there is vertical integration with a
and qualities since some people will have only basic services and some people will have both basic and
premium. Heterogeneous demand also may complicate the calculation of consumer welfare since there
is no longer one single demand curve. That said, in fact the issue may fairly easily be solved, at least in
principle, by (for example) estimating demand curves for the various major types of consumers. Chipty
notes that his approximate calculation requires that the utility provided by basic and premium cable is
additively separable for consumers. This means that an increase in the utility obtained from basic cable
does not affect the utility obtained from premium. This assumption would probably be wrong if, for
example, we were considering the demand for beer and pizza and consumers usually found pizza more
enjoyable with a beer. However, it seems a strong but reasonable approximation here, although those who
prefer “exact” estimates may prefer a more sophisticated approach. Chipty (2001) also uses the results
from Hausman (1981) to estimate consumer surplus exactly in this model.
29
Chapter 9 provides a discussion of the assumptions underlying particular demand specifications.
534 10. Quantitative Assessment of Vertical Restraints and Integration
Table 10.3. Consumer surplus estimates with and without vertical integration.
($ per month Integration with Integration with
per consumer) Unintegrated basic service premium service
Consumer surplus $1.47 $1.69 $1.87
Source: Chipty (2001).
premium content provider. Note that the differences across markets of the three
types appear because of differences in prices and service levels across the different
types of markets and not because the demand model suggests that consumers care
for some reason about vertical integration per se. Patterns in penetration rates appear
to suggest that they are greater in markets with the kinds of price–service trade-offs
that emerge from vertical integration. Since such factors will result in the demand
curve being further out toward the right, for any given price we will tend to generate
higher estimates of consumer surplus, although the amount of consumer surplus
could easily be reduced if consumers faced high prices in those markets.
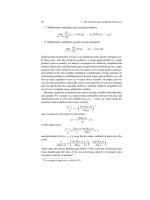
Crawford (2000) provides an alternate model of demand for basic and premium
cable using a similar data set allowing for consumer heterogeneity while Shum and
Crawford (2007) add a supply side to the model, allowing for firms to pick both price
and quality in a way designed to implement second-degree price discrimination
(see also Crawford 2005). We refer the reader to these papers to examine their
authors’ structural approach to this problem while we turn to another structural
paper examining the case for the removal of territorial restraints in the sale of cars.
10.2.3.2 Estimating the Effect of Territorial Restraints
Brenkers and Verboven (2006)
30
use a structural approach to analyze the effects of
the European car market liberalization; in particular, they want to estimate the effects
of the removal of territorial restraints
31
and exclusive dealership arrangements on
prices, consumer welfare, and profits. Until 2002, car manufacturers in Europe
were allowed to select authorized dealers and grant them territorial exclusivity.
The European Commission relaxed these exemptions in 2002 by preventing car
manufacturers from applying both selectivity and territorial exclusivity. This means
that, although manufacturers are still entitled to grant territorial exclusivity to a
network of “official” dealers, these dealers can now sell cars to non “official” dealers
or resellers within the country. They can also sell directly to customers in another
country. The intention was to promote within-brand competition (across dealerships)
both within a country and across countries in the European Union.
30
For closely related models of vertical competition, see also Dubois and Bonnet (2008), Villas-Boas
and Zhao (2005), and Villas-Boas (2007a,b).
31
For a structural analysis of exclusive dealing using similar techniques to those described in this
section, see Asker (2005).
10.2. Measuring the Effect of Vertical Restraints 535
Territorial restraints allow a manufacturer to price discriminate across countries.
If, in addition, market power is granted to the retailer at national level, double
marginalization can help soften competition among manufacturers (Rey and Stiglitz
1995). Liberalizing the car market and suppressing the price discrimination that is
possible with national market segmentation may have ambiguous welfare effects as
those consumers who had higher prices will be better off but those who benefited
from cheaper prices will be worse off. On the other hand, if exclusivity prevents
retailer competition at the national and cross-country level, then removing it will
tend to decrease prices and benefit consumers, absent other efficiency effects of the
vertical agreement.
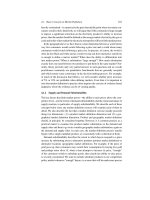
In order to empirically assess the net effect of eliminating the restrictions, Bren-
kers andVerboven estimate a full structural model for the pre- and post-liberalization
scenarios. To do so they use data including list prices, sales, and car characteristics
of all car models sold in five European markets during 1970 to 1999. They also
have national population and GDP data. They first estimate a nested multinomial
logit (NMNL) demand system for cars. For each market m, the conditional indirect
utility of individual i for car j takes the form,
u
ij
D x
j
ˇ C
j
˛
i
p
j
C "
ij
;
where x
j
are product-specific characteristics such as horsepower and size and
j
is a
product-specific error component that captures product characteristics unobserved to
the analyst such as the brand image. The price parameter ˛
i
is defined as ˛
i
D ˛=y
i
,
where y
i
is the individual’s income. The authors assume that "
ij
follow the assump-
tions of a two-level nested logit model (see chapter 9 for a discussion of the one-level
NMNL model). The two-level NMNL model allows an investigator to “group” prod-
ucts and consider the consumers’ choice problem as made up of a sequence of steps.
First, consumers are assumed to choose between groups of cars. In Brenkers andVer-
boven, the car groups are defined as subcompact, compact, intermediate, standard,
luxury, and an additional group is the outside good in case the consumer decides not
to purchase a car. Given a group, the consumer is then assumed to choose between
subgroups of domestic and imported cars. Finally, within each of the subgroups, the
demand model assumes that consumers choose which model of car to purchase, at
that stage choosing only between different members of the subgroup.
This two-level nested structure, whose assumption can be imposed by making partic-
ular choice on the distribution of "
ij
, allows an individual’s probability of choosing
car j , which is within a group of cars g and a subgroup h, to be expressed as
s
ij
D
exp x
j
ˇ C
j
˛
i
p
j
/=.1
hg
//
exp.I
ihg
=.1
hg
//
exp.I
ihg
=.1
g
//
exp.I
ig
=.1
g
//
exp.I
ig
/
exp.I
i
/
;
536 10. Quantitative Assessment of Vertical Restraints and Integration
where
I
ihg
D .1
hg
/ ln
Jhg
X
j D1
exp
Â
x
j
ˇ C
j
˛
i
p
j
1
hg
Ã
;
I
ig
D .1
g
/ ln
Hg
X
hD1
exp
Â
I
ihg
1
g
Ã
;
I
i
D ln
G
X
gD1
exp.I
ig
/;
and
hg
and
g
are the nesting parameters which are allowed to vary for the differ-
ent groups and subgroups. As always, aggregate demands for a given product are
calculated by integrating over the demands of each consumer type, here y
i
. Thus,
predicted sales for a given product are the weighted average of individual choice
probabilities where the weights are by the density of the income distribution of the
population. The parameters to be estimated are the K parameters for the product
characteristics in x
j
, the five group parameters
g
, the ten subgroup parameters
hg
,
and the price parameter, ˛. The number of parameters to be estimated is therefore
K C 5 C 10 C 1. For estimation, we need at least as many instruments as we have
parameters in the model in order for the model to be identified. For estimation, the
authors use a very slightly amended version of the BLP methodology described in
chapter 9.
To obtain the instruments necessary for identification of the demand system, the
authors first assume that the observed product characteristics x
j
are uncorrelated
with the unobserved component in demand,
j
. This assumption is familiar from
OLS-style models and provides K instruments. It is also standard in the literature
although the reason is probably because there are generally few better alternatives
rather than because the assumption is obviously an entirely valid one. In addition,
Brenkers and Verboven determine “markup shifter” variables that can be used as
additional instruments. Those are the number and characteristics of the other prod-
ucts sold by the firm in a particular subgroup, the number and characteristics of the
competing products in a particular subgroup, the number and characteristics of a
firm’s products within the same group, and the number and characteristics of com-
peting products within the same group. Those constructed variables are supposed
to capture the nature of the competitive interaction and therefore to affect margins
while being uncorrelated with the unobserved product characteristic in demand.
This approach to instrumentation is similar to that advocated by Berry et al. (1995).
Thus, so far, we have progressed from Chipty (2001) only to the extent that we
have changed the type of demand system being estimated. However, in addition to
demand, Brenkers and Verboven also estimate pricing equations using data from
10.2. Measuring the Effect of Vertical Restraints 537
the pre-liberalization situation. To do so, they assume a two-stage game in which
manufacturer f sets w
j
a wholesale price for product j and then the retailer r
sets the retail price p
j
for product j given w
j
. They solve the model by backward
induction and calculate first the retailer’s optimal pricing equation as a function of
the wholesale prices of all cars. They normalize the retailers’ operating marginal
costs to 0. Instead of writing down a particular model of retailer pricing based
on a particular model of conduct, they work with a general form of the retailer
pricing equation which encapsulates several potential models of retailer conduct
(competitive, monopoly pricing, etc.). Specifically, Brenkers and Verboven note
that each model will generate a structural retailer pricing equation of the form
p D p.w/;
where the subgame equilibrium retail prices will depend on the wholesale prices of
all cars. We give some of their specific examples of the subgame below but for now
notice that the move-order imposed on the game, where manufacturers set prices and
then retailers compete, does nonetheless subsume important assumptions about the
respective bargaining power of manufacturers and retailers. Namely this move order
endows manufacturers with a first-mover advantage and the consequent bargaining
power.
Following the process of backward induction, at the first stage of the game we
must solve for the equilibrium wholesale prices that will be chosen by manufacturers
and offered to retailers. In this model, the wholesale prices are chosen in the full
knowledge that retailers will go on to set retail prices in a fashion dependent on
the wholesale prices at stage two. We assume that each manufacturer chooses the
wholesale prices of its product range to maximize the joint profits of all its own
products =
f
taking into account retailers pricing behavior and demand:
˘
f
.w/ D
X
j 2=
f
.w
j
mc
j
/q
j
.p.w//:
Note that this structural model is in fact essentially just the model typically used
to study double marginalization (see the last section of chapter 9). Upstream man-
ufacturers set wholesale prices and downstream retailers may subsequently find it
profitable to charge markups. Thus, while the algebra may look complex, the basic
framework is just the same as our standard double marginalization problem, albeit
with two important differences: (1) product differentiation and (2) there may be an
oligopoly at each of the retailer and manufacturer stages instead of just a monopoly
manufacturer and a monopoly retailer.
32
32
One anonymous reviewer of this book noted that in many texts a treatment of vertical integration and
vertical restraints would come earlier in many competition books. The reason is probably that books often
treat such topics as largely analyzing either (i) upstream and downstream monopolies or (ii) monopoly
at one level and competition at the other. We choose to treat vertical topics last primarily because in the
real-world markets that competition agencies must analyze such settings are generically more complex