AUTOMATION & CONTROL - Theory and Practice Part 10 doc
Bạn đang xem bản rút gọn của tài liệu. Xem và tải ngay bản đầy đủ của tài liệu tại đây (766.73 KB, 25 trang )
AUTOMATION&CONTROL-TheoryandPractice216
Fig. 6. System I Output using GPC and NGPC
Fig. 7. Control Signal for System I
System II A simple first order system given below is to be controlled by GPC and NGPC.
1
( )
1 1 0
G s
s
(40)
Fig. 8 and Fig. 9 show the system output and control signal.
Fig. 8. System II Output using GPC and NGPC
Fig. 9. Control Signal for System II
System III: A second order system given below is controlled using GPC and NGPC.
1
( )
1 0 (1 2 .5 )
G s
s
s
(41)
Fig. 10 and Fig. 11 show the predicted output and control signal.
Fig. 10. System III Output using GPC and NGPC
NeuralGeneralizedPredictiveControlforIndustrialProcesses 217
Fig. 6. System I Output using GPC and NGPC
Fig. 7. Control Signal for System I
System II A simple first order system given below is to be controlled by GPC and NGPC.
1
( )
1 1 0
G s
s
(40)
Fig. 8 and Fig. 9 show the system output and control signal.
Fig. 8. System II Output using GPC and NGPC
Fig. 9. Control Signal for System II
System III: A second order system given below is controlled using GPC and NGPC.
1
( )
1 0 (1 2 .5 )
G s
s
s
(41)
Fig. 10 and Fig. 11 show the predicted output and control signal.
Fig. 10. System III Output using GPC and NGPC
AUTOMATION&CONTROL-TheoryandPractice218
Fig. 11. Control Signal for System III
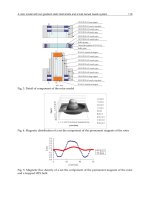
Before applying NGPC to the all above systems it is initially trained using Levenberg-
Marquardt learning algorithm. Fig. 12 (a) shows input data applied to the neural network
for offline training purpose. Fig. 12 (b) shows the corresponding neural network output.
Fig. 12. (a). Input Data for Neural Network Training
Fig. 12. (b). Neural Network Response for Random Input
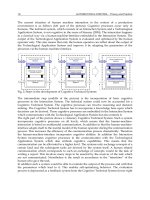
To check whether this neural network is trained to replicate it as a perfect model or not,
common input is applied to the trained neural network and plant. Fig. 13 (a) shows the
trained neural networks output and predicted output for common input. Also the error
between these two responses is shown in Fig. 13 (b).
The performance evaluation of both the controller is carried out using ISE and IAE criteria
given by the following equations:
2
0 0
; | |
t t
ISE e dt IAE e dt
(42)
Fig. 13. (b) Error between neural network and plant output
The Table 1 gives ISE and IAE values for both GPC and NGPC implementation for all the
linear systems given by equation (39) to equation (41). We can find that, for each system ISE
and IAE for NGPC is smaller or equal to GPC. So using GPC with neural network i.e. NGPC
control configuration for linear application, is also a better choice.
Systems Setpoint
GPC NGPC
ISE IAE ISE IAE
System I
0.5 1.6055 4.4107 1.827 3.6351
1 0.2567 1.4492 0.1186 1.4312
System II
0.5 1.1803 3.217 0.7896 2.6894
1 0.1311 0.767 0.063 1.017
System III
0.5 1.4639 3.7625 1.1021 3.3424
1 0.1759 0.9065 0.0957 0.7062
Table 1. ISE and IAE Performance Comparison of GPC and NGPC for Linear System
Fig. 13. (a) Neural network and plant output
NeuralGeneralizedPredictiveControlforIndustrialProcesses 219
Fig. 11. Control Signal for System III
Before applying NGPC to the all above systems it is initially trained using Levenberg-
Marquardt learning algorithm. Fig. 12 (a) shows input data applied to the neural network
for offline training purpose. Fig. 12 (b) shows the corresponding neural network output.
Fig. 12. (a). Input Data for Neural Network Training
Fig. 12. (b). Neural Network Response for Random Input
To check whether this neural network is trained to replicate it as a perfect model or not,
common input is applied to the trained neural network and plant. Fig. 13 (a) shows the
trained neural networks output and predicted output for common input. Also the error
between these two responses is shown in Fig. 13 (b).
The performance evaluation of both the controller is carried out using ISE and IAE criteria
given by the following equations:
2
0 0
; | |
t t
ISE e dt IAE e dt
(42)
Fig. 13. (b) Error between neural network and plant output
The Table 1 gives ISE and IAE values for both GPC and NGPC implementation for all the
linear systems given by equation (39) to equation (41). We can find that, for each system ISE
and IAE for NGPC is smaller or equal to GPC. So using GPC with neural network i.e. NGPC
control configuration for linear application, is also a better choice.
Systems Setpoint
GPC NGPC
ISE IAE ISE IAE
System I
0.5 1.6055 4.4107 1.827 3.6351
1 0.2567 1.4492 0.1186 1.4312
System II
0.5 1.1803 3.217 0.7896 2.6894
1 0.1311 0.767 0.063 1.017
System III
0.5 1.4639 3.7625 1.1021 3.3424
1 0.1759 0.9065 0.0957 0.7062
Table 1. ISE and IAE Performance Comparison of GPC and NGPC for Linear System
Fig. 13. (a) Neural network and plant output
AUTOMATION&CONTROL-TheoryandPractice220
7.2 GPC and NGPC for Nonlinear System
In above Section GPC and NGPC are applied to the linear systems. Fig. 6 to Fig. 11. show the
excellent behavior achieved in all cases by the GPC and NGPC algorithm. For each system
only few more steps in setpoint were required for GPC than NGPC to settle down the
output, but more importantly there is no sign of instability. In this Section, GPC and NGPC
is applied to the nonlinear systems to test its capability. A well known Duffing’s nonlinear
equation is used for simulation. It is given by,
.
3
( ) ( ) ( ) ( ) ( )y t y t y t y t u t
(43)
This differential equation is modeled in MATLAB 7.0.1 (Maths work Natic USA, 2007). Then
using linearization technique (‘linmod’ function) available in MATLAB a linear model of the
above system is obtained. This function returns a linear model in State-Space format which
is then converted in transfer function. This is given by,
2
( ) 1
( ) 1
y s
u s s s
(44)
This linear model of the system is used in GPC algorithm for prediction. In both the
controllers configuration, Prediction Horizon N
1
=1, N
2
=7 and Control Horizon (N
u
) is 2 is
set. The weighing factor λ for control signal is kept to 0.03 and δ for reference trajectory is set
to 0. The sampling period for this simulation is kept at 0.1.
In this simulation, neural network architecture considered is as follows. The inputs to this
network consists of two external inputs, u(t) and two outputs y(t-1), with their
corresponding delay nodes, u(t), u(t-1) and y(t-1), y(t-2). The network has one hidden layer
containing five hidden nodes that uses bi-polar sigmoid activation output function. There is
a single output node, which uses a linear output function, of one for scaling the output.
Fig. 14 shows the predicted and actual plant output for the system given in equation (43)
when controlled using GPC and NGPC techniques. Fig.15. shows the control efforts taken
by both the controller.
Fig. 14.Predicted Output and Actual Plant Output for Nonlinear System
The Fig.14, shows that, for set point changes the response of GPC is sluggish whereas for
NGPC it is fast. The overshoot is also less and response also settles down earlier in NGPC as
compared to GPC for nonlinear systems. This shows that performance of NGPC is better
than GPC for nonlinear system. The control effort is also smooth in NGPC as shown in Fig.
15
Fig. 15. Control Signal for Nonlinear System
Fig. 16 (a) shows input data applied to the neural network for offline training purpose. Fig.
16 (b) shows the corresponding neural network output.
Fig. 16. (b) Neural Network Response for Random Input
Fi
g
. 16. (a) Input Data for Neural Network Trainin
g
NeuralGeneralizedPredictiveControlforIndustrialProcesses 221
7.2 GPC and NGPC for Nonlinear System
In above Section GPC and NGPC are applied to the linear systems. Fig. 6 to Fig. 11. show the
excellent behavior achieved in all cases by the GPC and NGPC algorithm. For each system
only few more steps in setpoint were required for GPC than NGPC to settle down the
output, but more importantly there is no sign of instability. In this Section, GPC and NGPC
is applied to the nonlinear systems to test its capability. A well known Duffing’s nonlinear
equation is used for simulation. It is given by,
.
3
( ) ( ) ( ) ( ) ( )y t y t y t y t u t
(43)
This differential equation is modeled in MATLAB 7.0.1 (Maths work Natic USA, 2007). Then
using linearization technique (‘linmod’ function) available in MATLAB a linear model of the
above system is obtained. This function returns a linear model in State-Space format which
is then converted in transfer function. This is given by,
2
( ) 1
( ) 1
y s
u s s s
(44)
This linear model of the system is used in GPC algorithm for prediction. In both the
controllers configuration, Prediction Horizon N
1
=1, N
2
=7 and Control Horizon (N
u
) is 2 is
set. The weighing factor λ for control signal is kept to 0.03 and δ for reference trajectory is set
to 0. The sampling period for this simulation is kept at 0.1.
In this simulation, neural network architecture considered is as follows. The inputs to this
network consists of two external inputs, u(t) and two outputs y(t-1), with their
corresponding delay nodes, u(t), u(t-1) and y(t-1), y(t-2). The network has one hidden layer
containing five hidden nodes that uses bi-polar sigmoid activation output function. There is
a single output node, which uses a linear output function, of one for scaling the output.
Fig. 14 shows the predicted and actual plant output for the system given in equation (43)
when controlled using GPC and NGPC techniques. Fig.15. shows the control efforts taken
by both the controller.
Fig. 14.Predicted Output and Actual Plant Output for Nonlinear System
The Fig.14, shows that, for set point changes the response of GPC is sluggish whereas for
NGPC it is fast. The overshoot is also less and response also settles down earlier in NGPC as
compared to GPC for nonlinear systems. This shows that performance of NGPC is better
than GPC for nonlinear system. The control effort is also smooth in NGPC as shown in Fig.
15
Fig. 15. Control Signal for Nonlinear System
Fig. 16 (a) shows input data applied to the neural network for offline training purpose. Fig.
16 (b) shows the corresponding neural network output.
Fig. 16. (b) Neural Network Response for Random Input
Fi
g
. 16. (a) Input Data for Neural Network Trainin
g
AUTOMATION&CONTROL-TheoryandPractice222
The Table 2 gives ISE and IAE values for both GPC and NGPC implementation for the
nonlinear system given by equation (43). Here a cubic nonlinearity is present. The NGPC
control configuration for nonlinear application is better choice. Same results are also
observed for set point equals to 1.
Setpoint
GPC NGPC
ISE IAE ISE IAE
0.5 1.8014 5.8806 0.8066 2.5482
1 0.1199 1.4294 0.0566 0.5628
Table 2. ISE and IAE Performance Comparison of GPC and NGPC for Nonlinear System
7.3 Industrial processes
To evaluate the applicability of the proposed controller, the performance of the controller
has been studied on special industrial processes.
Example 1: NGPC for highly nonlinear process (Continues Stirred Tank Reactor)
Further to evaluate the performance of the Neural generalized predictive control (NGPC)
we consider highly nonlinear process continuous stirred tank reactor (CSTR)
(Nahas,Henson,et al.,1992) .Many aspects of nonlinearity can be found in this reactor, for
instance, strong parametric sensitivity, multiple equilibrium points and nonlinear
oscillations. The CSTR system, which can be found in many chemical industries, has evoked
a lot of interest for the control community due to its challenging theoretical aspects as well
as the crucial problem of controlling the production rate. A schematic of the CSTR system is
shown in Fig.17. A single irreversible, exothermic reaction A→B is assumed to occur in the
reactor.
Fig. 17. Continuous Stirred Tank Reactor
The objective is to control the effluent concentration by manipulating coolant flow rate in
the jacket. The process model consists of two nonlinear ordinary differential equations,
C
Af,
T
F
,
Reactant
q
c,
T
cF
Coolant In
C
A
,
T, q
Product
q
c,
T
C
Coolant Out
0
( )
E
R
T
A
Af A A
dC q
C C k C e
dt V
0
(1 )
c c p c
h A
E
q C
c p c
A
R T
f c c f
p p
C
H k C
d T q
T T e q e T T
d t V C C V
(45)
where C
Af
is feed concentration, C
A
is the effluent concentration of component A, T
F
, T and
T
c
are feed, product and coolant temperature respectively. q and q
c
are feed and coolant flow
rate. Here temperature T is controlled by manipulating coolant flow rate q
c
. The nominal
operating conditions are shown in Table 3.
1
100 minq l
3
/ 9.95 10
E
R K
1
1
Af
C mol
5 1
2 10H calmol
350
f
T K
1
, 1000
c
gl
350
cf
T K
1 1
, 1 g
p pc
C C cal K
100V l
1
103.41 min
c
q l
5 1 1
7 10 minhA cal K
440.2T K
10 1
7.2 10 min
o
k
2 1
8.36 10
A
C mol
Table 3. Nominal CSTR operating conditions
The operating point in Table 3 corresponds to the lower steady state. For these conditions,
there are three (two stable and one unstable) steady states. The objective is to control C
A
by
manipulating coolant flow rate
q
c.
The corresponding model under certain assumptions is converted into transfer function
form as,
0 . 7 5
( ) 0 .4 2
( ) (1 3 .4 1)
s
y s e
u s s
(46)
0 50 100 150
-0.2
0
0.2
0.4
0.6
0.8
1
1.2
Time
Predicted Output
Setpoint
Predicted Output
Fig. 18. System output using NGPC
NeuralGeneralizedPredictiveControlforIndustrialProcesses 223
The Table 2 gives ISE and IAE values for both GPC and NGPC implementation for the
nonlinear system given by equation (43). Here a cubic nonlinearity is present. The NGPC
control configuration for nonlinear application is better choice. Same results are also
observed for set point equals to 1.
Setpoint
GPC NGPC
ISE IAE ISE IAE
0.5 1.8014 5.8806 0.8066 2.5482
1 0.1199 1.4294 0.0566 0.5628
Table 2. ISE and IAE Performance Comparison of GPC and NGPC for Nonlinear System
7.3 Industrial processes
To evaluate the applicability of the proposed controller, the performance of the controller
has been studied on special industrial processes.
Example 1: NGPC for highly nonlinear process (Continues Stirred Tank Reactor)
Further to evaluate the performance of the Neural generalized predictive control (NGPC)
we consider highly nonlinear process continuous stirred tank reactor (CSTR)
(Nahas,Henson,et al.,1992) .Many aspects of nonlinearity can be found in this reactor, for
instance, strong parametric sensitivity, multiple equilibrium points and nonlinear
oscillations. The CSTR system, which can be found in many chemical industries, has evoked
a lot of interest for the control community due to its challenging theoretical aspects as well
as the crucial problem of controlling the production rate. A schematic of the CSTR system is
shown in Fig.17. A single irreversible, exothermic reaction A→B is assumed to occur in the
reactor.
Fig. 17. Continuous Stirred Tank Reactor
The objective is to control the effluent concentration by manipulating coolant flow rate in
the jacket. The process model consists of two nonlinear ordinary differential equations,
C
Af,
T
F
,
Reactant
q
c,
T
cF
Coolant In
C
A
,
T, q
Product
q
c,
T
C
Coolant Out
0
( )
E
R
T
A
Af A A
dC q
C C k C e
dt V
0
(1 )
c c p c
h A
E
q C
c p c
A
R T
f c c f
p p
C
H k C
d T q
T T e q e T T
d t V C C V
(45)
where C
Af
is feed concentration, C
A
is the effluent concentration of component A, T
F
, T and
T
c
are feed, product and coolant temperature respectively. q and q
c
are feed and coolant flow
rate. Here temperature T is controlled by manipulating coolant flow rate q
c
. The nominal
operating conditions are shown in Table 3.
1
100 minq l
3
/ 9.95 10
E
R K
1
1
Af
C mol
5 1
2 10H calmol
350
f
T K
1
, 1000
c
gl
350
cf
T K
1 1
, 1 g
p pc
C C cal K
100V l
1
103.41 min
c
q l
5 1 1
7 10 minhA cal K
440.2T K
10 1
7.2 10 min
o
k
2 1
8.36 10
A
C mol
Table 3. Nominal CSTR operating conditions
The operating point in Table 3 corresponds to the lower steady state. For these conditions,
there are three (two stable and one unstable) steady states. The objective is to control C
A
by
manipulating coolant flow rate
q
c.
The corresponding model under certain assumptions is converted into transfer function
form as,
0 . 7 5
( ) 0 .4 2
( ) (1 3 .4 1)
s
y s e
u s s
(46)
0 50 100 150
-0.2
0
0.2
0.4
0.6
0.8
1
1.2
Time
Predicted Output
Setpoint
Predicted Output
Fig. 18. System output using NGPC
AUTOMATION&CONTROL-TheoryandPractice224
0 50 100 150
0
0.5
1
1.5
2
2.5
3
3.5
4
Time
Control Sgnal
Control Signal
Fig. 19.Control signal for system
Fig. 18 shows the plant output for NGPC and Fig.19 shows the control efforts taken by
controller. Performance evaluation of the controller is carried out using ISE and IAE criteria.
Table 4 gives ISE and IAE values for NGPC implementation for nonlinear systems given by
equation (46).
Systems Setpoint
NGPC
ISE IAE
System I
0.5 1.827 3.6351
1 0.1186 1.4312
Table 4. ISE and IAE Performance Comparison of NGPC for CSTR
Example 2: NGPC for highly linear system (dc motor)
Here a DC motor is considered as a linear system from (Dorf & Bishop,1998). A simple
model of a DC motor driving an inertial load shows the angular rate of the load, ω (t), as the
output and applied voltage, V
app
, as the input. The ultimate goal of this example is to control
the angular rate by varying the applied voltage. Fig. 20 shows a simple model of the DC
motor driving an inertial load J.
Fig. 20. DC motor driving inertial load
In this model, the dynamics of the motor itself are idealized; for instance, the magnetic field
is assumed to be constant. The resistance of the circuit is denoted by R and the self-
inductance of the armature by L. The important thing here is that with this simple model
and basic laws of physics, it is possible to develop differential equations that describe the
behavior of this electromechanical system. In this example, the relationships between
electric potential and mechanical force are Faraday's law of induction and Ampere’s law for
the force on a conductor moving through a magnetic field.
A set of two differential equations describes the behavior of the motor. The first for the
induced current, and the second for the angular rate,
1
( ) ( )
b
a p p
K
d i R
i t t V
d t L L L
( ) ( )
m
F
K
K
d
t i t
d t J J
(47)
The objective is to control angular velocity ω by manipulating applied voltage, V
app.
The
nominal operating conditions are shown in Table 5.
0.015
b
K (emf constant) 0.015
m
K
(torque constant)
0.2
f
K Nms
2 2
0.2 / secJ Kgm
2
R
0.5L H
Table 5. Nominal dc motor operating conditions
The corresponding model under certain assumptions is converted into transfer function
form as,
( ) 1 .5
( ) (6 0.3 1 * ^ 2 )
y s
u s s s
(48)
0 50 100 150
0
0.2
0.4
0.6
0.8
1
1.2
1.4
Time
Predicted Output
Setpoint
Predicted Output
Fig. 21. System output using NGPC
NeuralGeneralizedPredictiveControlforIndustrialProcesses 225
0 50 100 150
0
0.5
1
1.5
2
2.5
3
3.5
4
Time
Control Sgnal
Control Signal
Fig. 19.Control signal for system
Fig. 18 shows the plant output for NGPC and Fig.19 shows the control efforts taken by
controller. Performance evaluation of the controller is carried out using ISE and IAE criteria.
Table 4 gives ISE and IAE values for NGPC implementation for nonlinear systems given by
equation (46).
Systems Setpoint
NGPC
ISE IAE
System I
0.5 1.827 3.6351
1 0.1186 1.4312
Table 4. ISE and IAE Performance Comparison of NGPC for CSTR
Example 2: NGPC for highly linear system (dc motor)
Here a DC motor is considered as a linear system from (Dorf & Bishop,1998). A simple
model of a DC motor driving an inertial load shows the angular rate of the load, ω (t), as the
output and applied voltage, V
app
, as the input. The ultimate goal of this example is to control
the angular rate by varying the applied voltage. Fig. 20 shows a simple model of the DC
motor driving an inertial load J.
Fig. 20. DC motor driving inertial load
In this model, the dynamics of the motor itself are idealized; for instance, the magnetic field
is assumed to be constant. The resistance of the circuit is denoted by R and the self-
inductance of the armature by L. The important thing here is that with this simple model
and basic laws of physics, it is possible to develop differential equations that describe the
behavior of this electromechanical system. In this example, the relationships between
electric potential and mechanical force are Faraday's law of induction and Ampere’s law for
the force on a conductor moving through a magnetic field.
A set of two differential equations describes the behavior of the motor. The first for the
induced current, and the second for the angular rate,
1
( ) ( )
b
a p p
K
d i R
i t t V
d t L L L
( ) ( )
m
F
K
K
d
t i t
d t J J
(47)
The objective is to control angular velocity ω by manipulating applied voltage, V
app.
The
nominal operating conditions are shown in Table 5.
0.015
b
K (emf constant) 0.015
m
K (torque constant)
0.2
f
K Nms
2 2
0.2 / secJ Kgm
2
R
0.5L H
Table 5. Nominal dc motor operating conditions
The corresponding model under certain assumptions is converted into transfer function
form as,
( ) 1 .5
( ) (6 0.3 1 * ^ 2 )
y s
u s s s
(48)
0 50 100 150
0
0.2
0.4
0.6
0.8
1
1.2
1.4
Time
Predicted Output
Setpoint
Predicted Output
Fig. 21. System output using NGPC
AUTOMATION&CONTROL-TheoryandPractice226
0 50 100 150
-0.2
0
0.2
0.4
0.6
0.8
1
1.2
1.4
1.6
Time
Control Sgnal
Control Signal
Fig. 22. Control signal for system
Fig. 21 shows the plant output for NGPC and Fig. 22 shows the control efforts taken by
controller. Performance evaluation of the controller is carried out using ISE and IAE criteria.
Table 6 gives ISE and IAE values for NGPC implementation for linear systems given by
equation (48).
Systems Setpoint
NGPC
ISE IAE
System I
0.5 1.505 212.5
1 1.249 202.7
Table 6. ISE and IAE Performance Comparison of NGPC for dc motor
8. Implementation of Quasi Newton Algorithm and Levenberg Marquardt
Algorithm for Nonlinear System
To evaluate the performance of system two algorithms i.e. Newton Raphson and Levenberg
Marquardt algorithm are implemented and their results are compared. The details about
this implementation are given. The utility of each algorithm is outlined in the conclusion. In
using Levenberg Marquardt algorithm, the number of iteration needed for convergence is
significantly reduced from other techniques. The main cost of the Newton Raphson
algorithm is in the calculation of Hessain, but with this overhead low iteration numbers
make Levenberg Marquardt algorithm faster than other techniques and a viable algorithm
for real time control. The simulation result of Newton Raphson and Levenberg Marquardt
algorithm are compared. Levenberg Marquardt algorithm shows a convergence to a good
solution. The performance comparison of these two algorithms also given in terms of ISE
and IAE.
8.1 Simulation Results
Many physical plants exhibit nonlinear behavior. Linear models may approximate these
relationships, but often a nonlinear model is desirable. This Section presents training a
neural network to model a nonlinear plant and then using this model for NGPC. The
Duffing’s equation is well-studied nonlinear system as given in equation (43). The Newton
Raphson algorithm and Levenberg Marquardt algorithm has been implemented for the
system in equation (43) and results are compared. Fig.23 shows Newton Raphson
implementation and Fig. 24 shows implementation of LM algorithm. Fig. 25. Shows the
control efforts taken by controller.
0 5 0 1 0 0 1 5 0 2 0 0 2 5 0 3 0 0 3 5 0
0
0 . 5
1
1 . 5
2
2 . 5
3
P r e d ic t e d a n d A c t u a l O u tp u t
R e fe re n c e S ig n a l
P r e d ic t e d O u t p u t
P l a n t O u tp u t
Fig. 23. Predicted Output and Actual Plant Output for Newton Raphson implementation
0 5 0 1 0 0 1 5 0 2 0 0 2 5 0 3 0 0 3 5 0
0
0 . 5
1
1 . 5
2
2 . 5
3
P re d ic t e d a n d A c t u a l O u t p u t
R e fe re n c e S i g n a l
P re d ic t e d O u t p u t
P la n t O u t p u t
Fig. 24. Predicted Output and Actual Plant Output for Levenberg Marquardt
implementation
NeuralGeneralizedPredictiveControlforIndustrialProcesses 227
0 50 100 150
-0.2
0
0.2
0.4
0.6
0.8
1
1.2
1.4
1.6
Time
Control Sgnal
Control Signal
Fig. 22. Control signal for system
Fig. 21 shows the plant output for NGPC and Fig. 22 shows the control efforts taken by
controller. Performance evaluation of the controller is carried out using ISE and IAE criteria.
Table 6 gives ISE and IAE values for NGPC implementation for linear systems given by
equation (48).
Systems Setpoint
NGPC
ISE IAE
System I
0.5 1.505 212.5
1 1.249 202.7
Table 6. ISE and IAE Performance Comparison of NGPC for dc motor
8. Implementation of Quasi Newton Algorithm and Levenberg Marquardt
Algorithm for Nonlinear System
To evaluate the performance of system two algorithms i.e. Newton Raphson and Levenberg
Marquardt algorithm are implemented and their results are compared. The details about
this implementation are given. The utility of each algorithm is outlined in the conclusion. In
using Levenberg Marquardt algorithm, the number of iteration needed for convergence is
significantly reduced from other techniques. The main cost of the Newton Raphson
algorithm is in the calculation of Hessain, but with this overhead low iteration numbers
make Levenberg Marquardt algorithm faster than other techniques and a viable algorithm
for real time control. The simulation result of Newton Raphson and Levenberg Marquardt
algorithm are compared. Levenberg Marquardt algorithm shows a convergence to a good
solution. The performance comparison of these two algorithms also given in terms of ISE
and IAE.
8.1 Simulation Results
Many physical plants exhibit nonlinear behavior. Linear models may approximate these
relationships, but often a nonlinear model is desirable. This Section presents training a
neural network to model a nonlinear plant and then using this model for NGPC. The
Duffing’s equation is well-studied nonlinear system as given in equation (43). The Newton
Raphson algorithm and Levenberg Marquardt algorithm has been implemented for the
system in equation (43) and results are compared. Fig.23 shows Newton Raphson
implementation and Fig. 24 shows implementation of LM algorithm. Fig. 25. Shows the
control efforts taken by controller.
0 5 0 1 0 0 1 5 0 2 0 0 2 5 0 3 0 0 3 5 0
0
0 . 5
1
1 . 5
2
2 . 5
3
P r e d ic t e d a n d A c t u a l O u tp u t
R e fe re n c e S ig n a l
P r e d ic t e d O u t p u t
P l a n t O u tp u t
Fig. 23. Predicted Output and Actual Plant Output for Newton Raphson implementation
0 5 0 1 0 0 1 5 0 2 0 0 2 5 0 3 0 0 3 5 0
0
0 . 5
1
1 . 5
2
2 . 5
3
P re d ic t e d a n d A c t u a l O u t p u t
R e fe re n c e S i g n a l
P re d ic t e d O u t p u t
P la n t O u t p u t
Fig. 24. Predicted Output and Actual Plant Output for Levenberg Marquardt
implementation
AUTOMATION&CONTROL-TheoryandPractice228
0 5 0 1 0 0 1 50 20 0 25 0 3 0 0 3 5 0
2
4
6
8
1 0
1 2
1 4
1 6
1 8
C o n t ro l s ig n a l
C o n t ro l s ig n al
Fig. 25. Control signal for system
Set point Newton Raphson Levenberg Marquardt
ISE
IAE ISE IAE
0.5
0.8135 2.7950 0.8084 2.5537
1
0.1363 1.2961 0.1283 1.0315
1.5
0.1292 1.2635 0.1193 0.9931
2
0.1448 2.1251 0.1026 0.8791
2.5
0.0986 2.0367 0.0382 0.5326
Table 7. ISE and IAE Performance Comparison of Newton Raphson and Levenberg
Marquardt algorithm
9. Conclusion
In this chapter we have combined predictive control and neural network to form a control
strategy known as Neural Generalized Predictive Control (NGPC) The NGPC algorithm
operates in two modes, i.e. prediction and control. It generates a sequence of future control
signals within each sampling interval to optimize control effort of the controlled systems.
The GPC and NGPC are applied to the variety of systems to test its capability. The output of
trained neural network is used as the predicted output of the plant. This predicted output is
used in the cost function minimization algorithm. GPC criterion is minimized using two
different schemes: a Quasi Newton algorithm and Levenberg Marquardt algorithm. The
performance comparison of these configurations has been given in terms of Integral square
error (ISE) and Integral absolute error (IAE). The simulation result also reveals that,
Levenberg Marquardt gives improved control performance over Newton Raphson
optimization algorithm.The performance of NGPC is also tested on a highly nonlinear and
linear industrial process such as continues stirred tank reactor (CSTR) and DC Motor. The
simulation results show the efficacy of NGPC over GPC for controlling linear as well as
nonlinear plants.
10. References
Chen, Z. ;Yuan, Z. & Yan, Z.(2002). “A survey on neural network based nonlinear predictive
control”, Engineering of Control China, Vol. 9, No. 4, pp. 7-11.
Clarke, D. W.; Mohtadi, C.& Tuffs, P. C.(1987). Generalized predictive control-part-I and
Part-II the basic algorithms, Automatica, Vol. 23, pp. 137-163.
Dorf, R. C. and Bishop, R. H. (1998). Modern control systems, Addison-Wesley, Menlo Park,
CA, USA.
Hashimoto, S. ; Goka, S.; Kondo, T. & Nakajima, K., (2008). Model predictive control of
precision stages with nonlinear friction, Advanced Intelligent
Mechatronics,.International Conference IEEE/ASME., Gunma Univ., Kiryu.
Kim J. H.; Ansung,D. & Gyonggi, D.(1998).Fuzzy model based predictive control, IEEE
Transactions on Fuzzy Systems, pp. 405-409.
Mathworks USA,(2007) ,MATLAB 7.0.1 Software, Mathworks Natic, USA.
Nahas, E. P.; Henson, M. A. & Seborg, D. E. (1992). Nonlinear internal model control
strategy for neural network models, Computers Chemical Engineering, Vol. 16, pp.
1039-1057.
Norgaard, M. (2000). Neural network based control system design toolkit Ver. 2.0” Technical
Report, 00-E -892, Department of Automation, Technical University of Denmark.
Nørgaard,M.(2004),Neural Network Based System Identification Toolbox,” Tech Report. 00-E-
891, Department of Automation, Technical University of Denmark.
Piche, S.; Sayyar-Rodsari,B.; Johnson,D.; Gerules, M.; Technol, P. & Austin, T. X(2000).
Nonlinear model predictive control using neural network , IEEE Control Systems
Magazine, Vol. 20, No. 3, pp. 53-62.
Qin, S. J. and. Badgwell, T.(2003).A Survey of Industrial model predictive control
technology”, Control Engineering Practice, Vol. 11, No. 7, pp. 733-764.
Raff, T. ; Sinz, D. & Allgower, F. (2008). Model predictive control of uncertain continuous-
time systems with piecewise constant control input: A convex approach, American
Control conference: Inst. for Syst. Theor. & Autom. Control, Univ. of Stuttgart, Stuttgart;
Rao, D. N.;Murthy, . M. R. K,; Rao, . S. R. M. & Harshal D. N. ,(2006). Neural generalized
predictive control for real time application, International Journal of Information and
Systems Sciences, Vol. 3, No. 1, pp. 1-15.
Rao, D. N. ; Murthy, M. R. K. ; Rao, S. R. M. &. Harshal, D. N (2007). Computational
comparisons of GPC and NGPC schemes”, Engineering Letters, Vol. 14.
Rossiter, A.( 2006 ).Recent Developments in predictive control, UKACC Control, Mini
symposia, pp. 3-26.
Sorensen, P. H.; Norgaard, O. Ravn, & N. K. Poulsen,(1999). Implementation of neural
network based nonlinear predictive control, Neurocomputing, Vol. 28, 1999, pp. 37-
51.
Soloway, D. & Haley, P. J. (1997). Neural generalized predictive control- A Newton-Raphson
implementation”, NASA Technical Report (110244).
NeuralGeneralizedPredictiveControlforIndustrialProcesses 229
0 5 0 1 0 0 1 5 0 20 0 2 5 0 3 0 0 3 5 0
2
4
6
8
1 0
1 2
1 4
1 6
1 8
C o n t ro l s ig n a l
C o n t ro l s ig n al
Fig. 25. Control signal for system
Set point Newton Raphson Levenberg Marquardt
ISE
IAE ISE IAE
0.5
0.8135 2.7950 0.8084 2.5537
1
0.1363 1.2961 0.1283 1.0315
1.5
0.1292 1.2635 0.1193 0.9931
2
0.1448 2.1251 0.1026 0.8791
2.5
0.0986 2.0367 0.0382 0.5326
Table 7. ISE and IAE Performance Comparison of Newton Raphson and Levenberg
Marquardt algorithm
9. Conclusion
In this chapter we have combined predictive control and neural network to form a control
strategy known as Neural Generalized Predictive Control (NGPC) The NGPC algorithm
operates in two modes, i.e. prediction and control. It generates a sequence of future control
signals within each sampling interval to optimize control effort of the controlled systems.
The GPC and NGPC are applied to the variety of systems to test its capability. The output of
trained neural network is used as the predicted output of the plant. This predicted output is
used in the cost function minimization algorithm. GPC criterion is minimized using two
different schemes: a Quasi Newton algorithm and Levenberg Marquardt algorithm. The
performance comparison of these configurations has been given in terms of Integral square
error (ISE) and Integral absolute error (IAE). The simulation result also reveals that,
Levenberg Marquardt gives improved control performance over Newton Raphson
optimization algorithm.The performance of NGPC is also tested on a highly nonlinear and
linear industrial process such as continues stirred tank reactor (CSTR) and DC Motor. The
simulation results show the efficacy of NGPC over GPC for controlling linear as well as
nonlinear plants.
10. References
Chen, Z. ;Yuan, Z. & Yan, Z.(2002). “A survey on neural network based nonlinear predictive
control”, Engineering of Control China, Vol. 9, No. 4, pp. 7-11.
Clarke, D. W.; Mohtadi, C.& Tuffs, P. C.(1987). Generalized predictive control-part-I and
Part-II the basic algorithms, Automatica, Vol. 23, pp. 137-163.
Dorf, R. C. and Bishop, R. H. (1998). Modern control systems, Addison-Wesley, Menlo Park,
CA, USA.
Hashimoto, S. ; Goka, S.; Kondo, T. & Nakajima, K., (2008). Model predictive control of
precision stages with nonlinear friction, Advanced Intelligent
Mechatronics,.International Conference IEEE/ASME., Gunma Univ., Kiryu.
Kim J. H.; Ansung,D. & Gyonggi, D.(1998).Fuzzy model based predictive control, IEEE
Transactions on Fuzzy Systems, pp. 405-409.
Mathworks USA,(2007) ,MATLAB 7.0.1 Software, Mathworks Natic, USA.
Nahas, E. P.; Henson, M. A. & Seborg, D. E. (1992). Nonlinear internal model control
strategy for neural network models, Computers Chemical Engineering, Vol. 16, pp.
1039-1057.
Norgaard, M. (2000). Neural network based control system design toolkit Ver. 2.0” Technical
Report, 00-E -892, Department of Automation, Technical University of Denmark.
Nørgaard,M.(2004),Neural Network Based System Identification Toolbox,” Tech Report. 00-E-
891, Department of Automation, Technical University of Denmark.
Piche, S.; Sayyar-Rodsari,B.; Johnson,D.; Gerules, M.; Technol, P. & Austin, T. X(2000).
Nonlinear model predictive control using neural network , IEEE Control Systems
Magazine, Vol. 20, No. 3, pp. 53-62.
Qin, S. J. and. Badgwell, T.(2003).A Survey of Industrial model predictive control
technology”, Control Engineering Practice, Vol. 11, No. 7, pp. 733-764.
Raff, T. ; Sinz, D. & Allgower, F. (2008). Model predictive control of uncertain continuous-
time systems with piecewise constant control input: A convex approach, American
Control conference: Inst. for Syst. Theor. & Autom. Control, Univ. of Stuttgart, Stuttgart;
Rao, D. N.;Murthy, . M. R. K,; Rao, . S. R. M. & Harshal D. N. ,(2006). Neural generalized
predictive control for real time application, International Journal of Information and
Systems Sciences, Vol. 3, No. 1, pp. 1-15.
Rao, D. N. ; Murthy, M. R. K. ; Rao, S. R. M. &. Harshal, D. N (2007). Computational
comparisons of GPC and NGPC schemes”, Engineering Letters, Vol. 14.
Rossiter, A.( 2006 ).Recent Developments in predictive control, UKACC Control, Mini
symposia, pp. 3-26.
Sorensen, P. H.; Norgaard, O. Ravn, & N. K. Poulsen,(1999). Implementation of neural
network based nonlinear predictive control, Neurocomputing, Vol. 28, 1999, pp. 37-
51.
Soloway, D. & Haley, P. J. (1997). Neural generalized predictive control- A Newton-Raphson
implementation”, NASA Technical Report (110244).
AUTOMATION&CONTROL-TheoryandPractice230
Sun, X.; Chang, R.; He, P. & Fan,Y.(2002). Predictive control based on neural network for
nonlinear system with time delays, IEEE Transactions on Neural Network, pp. 319-
322.
Forecasting,DiagnosisandDecisionMakingwithNeuralNetworksandSelf-OrganizingMaps 231
Forecasting,DiagnosisandDecisionMakingwithNeuralNetworksand
Self-OrganizingMaps
KazuhiroKohara,KatsuyoshiAokiandMamoruIsomae
X
Forecasting, Diagnosis and Decision Making
with Neural Networks and Self-Organizing Maps
Kazuhiro Kohara, Katsuyoshi Aoki and Mamoru Isomae
Chiba Institute of Technology
Japan
1. Introduction
Intelligent techniques such as back-propagation neural networks (BPNN) (Rumelhart et al.,
1986), self-organizing maps (SOM) (Kohonen, 1995) , decision trees (Quinlan, 1993) and
Bayesian networks (Jensen, 2001) have been extensively investigated, and various attempts
have been made to apply them to identification, prediction and control (e.g., (Bishop, 1995);
(Kil & Shin, 1996); (Pham & Liu, 1995)). This chapter describes three topics: (1) forecasting
with BPNN and selective learning, (2) diagnosis with SOM and ensemble learning, and (3)
decision making with SOM and Analytic Hierarchy Process (AHP) (Saaty, 1980).
The first section describes stock market prediction with BPNN and selective learning
techniques for improving the ability of BPNN to predict large changes. Selective-presentation
approach, in which the training data corresponding to large changes in the prediction-target
time series are presented more often, selective-learning-rate approach, in which the learning
rate for training data corresponding to small changes is reduced, and combining two
approaches are described. The prediction of daily stock prices is used as a noisy real-world
problem. The results of several experiments on stock-price prediction showed that the
performances of these two approaches were similar and both better than the usual
presentation approach, and combining them further improved the performance.
The second section shows an experimental study on medical diagnosis with SOM and
ensemble learning. We apply SOM to medical diagnosis such as breast cancer, heart disease
and hypothyroid diagnosis, comparing with decision trees and Bayesian networks. We used
the UCI data sets as medical diagnosis problem. The accuracy for breast cancer and
hypothyroid diagnosis was comparatively high and the accuracy for heart disease diagnosis
was comparatively low. Therefore, we apply ensemble learning such as bagging and boosting
of SOM to heart disease diagnosis. The accuracy with ensemble learning of SOM was much
improved.
The third section describes purchase decision making with SOM and AHP. We proposed a
purchase decision making method using SOM and AHP. First, we divide many products
into several clusters using SOM. Secondly, we select some alternatives using the product
maps. Finally, we make a final choice from the alternatives using AHP. As an example of
real-world applications, we apply our method to a buying personal computer (PC) problem.
13
AUTOMATION&CONTROL-TheoryandPractice232
We considered one hundred and twenty kinds of notebook PCs. We evaluated our method
through experiments conducted by 117 people and confirmed its effectiveness.
2. Forecasting with Neural Networks and Selective Learning
Prediction using back-propagation neural networks has been extensively investigated (e.g.,
(Weigend et al., 1990) ; (Vemuri & Rogers, 1994) ; (Mandic & Chambers, 2001)), and various
attempts have been made to apply neural networks to financial market prediction (e.g.,
(Azoff, 1994) ; (Refenes & Azema-Barac, 1994) ; (White, 1988) ; (Baba & Kozaki, 1992) ;
(Freisleben, 1992) ; (Tang et al., 1991) ; (Kohara, 2002)), electricity load forecasting (e.g., (Park
et al., 1991)) and other areas. In the usual approach, all training data are equally presented to
a neural network (i.e., presented in each cycle) and the learning rates are equal for all the
training data independently of the size of the changes in the prediction-target time series.
Also, network learning is usually stopped at the point of minimal mean squared error
between the network’s outputs and the desired outputs.
Generally, the ability to predict large changes is more important than the ability to predict
small changes, as we mentioned in the previous paper (Kohara, 1995). When all training
data are presented equally with an equal learning rate, the BPNN will learn the small and
large changes equally well, so it cannot learn the large changes more effectively. We have
investigated selective learning techniques for improving the ability of neural networks to
predict large changes. We previously proposed the selective-presentation (Kohara, 1995) and
selective-learning-rate (Kohara, 1996) approaches and applied them into stock market
prediction. In the selective-presentation approach, the training data corresponding to large
changes in the prediction-target time series are presented more often. In the selective-
learning-rate approach, the learning rate for training data corresponding to small changes is
reduced. The previous paper (Kohara, 1995) also investigated another stopping criterion for
financial predictions. Network learning is stopped at the point having the maximum profit
through experimental stock-trading.
We also previously proposed combining the selective-presentation and selective-learning-rate
approaches (Kohara, 2008). By combining these two approaches, we can easily achieved
fine-tuned and step-by-step selective learning of neural networks according to the degree of
change. Daily stock prices were predicted as a noisy real-world problem.
2.1 Selective-Presentation and Selective-Learning-Rate Approaches
To allow neural networks to learn about large changes in prediction-target time series more
effectively, we separate the training data into large-change data (L-data) and small-change
data (S-data). L-data (S-data) have next-day changes that are larger (smaller) than a preset
value. In the selective-presentation approach, the L-data are presented to neural networks
more often than S-data. For example, all training data are presented every fifth learning
cycle, while the L-data are presented every cycle. In the selective-learning-rate approach, all
training data are presented in every cycle; however, the learning rate of the back-
propagation training algorithm for S-data is reduced compared with that for L-data. These
two approaches are outlined as follows.
Selective-Presentation Approach
1. Separate the training data into L-data and S-data.
2. Train back-propagation networks with more presentations of L-data than of S-data.
3. Stop network learning at the point satisfying a certain stopping criterion (e.g., stop
at the point having the maximum profit).
Selective-Learning-Rate Approach
1. Separate the training data into L-data and S-data.
2. Train back-propagation networks with a lower learning rate for the S-data than for
the L-data.
3. Stop network learning at the point satisfying a certain stopping criterion (e.g., stop
at the point having the maximum profit).
We combined these two approaches to achieve fine-tuned and step-by-step learning of
neural networks according to the degree of change. The outline is as follows.
Combining Selective-Presentation and Selective-Learning-Rate Approaches
1. Separate the training data into L-data and S-data.
2. Separate L-data into two subsets: L1-data and L2-data, where changes in L2- data are
larger than those in L1-data.
3. Separate S-data into two subsets: S1-data and S2-data, where changes in S2-data are larger
than those in S1-data.
4. Train back-propagation networks with more presentations of L1- and L2-data than of S1-
and S2-data, and with a lower learning rate for L1- and S1-data than for L2 and S2-data.
5. Stop network learning at the point satisfying a certain stopping criterion (e.g., stop
at the point having the maximum profit).
2.2 Evaluation through Experimental Stock-Price Prediction
We considered the following types of knowledge for predicting Tokyo stock prices. These
types of knowledge involve numerical economic indicators (Kohara, 1995).
1. If interest rates decrease, stock prices tend to increase, and vice versa.
2. If the dollar-to-yen exchange rate decreases, stock prices tend to decrease, and vice versa.
3. If the price of crude oil increases, stock prices tend to decrease, and vice versa.
We used the following five indicators as inputs to the neural network.
TOPIX: the chief Tokyo stock exchange price index
EXCHANGE: the dollar-to-yen exchange rate (yen/dollar)
INTEREST: an interest rate (3-month CD, new issue, offered rates) (%)
OIL: the price of crude oil (dollars/barrel)
NY: New York Dow-Jones average of the closing prices of 30 industrial stocks (dollars)
TOPIX was the prediction target. EXCHANGE, INTEREST and OIL were chosen based on
the knowledge of numerical economic indicators. The Dow-Jones average was used because
Tokyo stock market prices are often influenced by New York exchange prices. We assume
that tomorrow’s change in TOPIX is determined by today’s changes in the five indicators
according to the knowledge. Therefore, the daily changes in these five indicators (e.g.
TOPIX(t) = TOPIX(t) - TOPIX(t-1)) were input into neural networks, and the next-day’s
change in TOPIX was presented to the neural network as the desired output (Fig. 1). The
back-propagation algorithm was used to train the network. All the data of the daily changes
were scaled to the interval [0.1, 0.9]. A 5-5-1 multi-layered neural network was used (five
neurons in the input layer, five in the hidden layer, and one in the output layer).
Forecasting,DiagnosisandDecisionMakingwithNeuralNetworksandSelf-OrganizingMaps 233
We considered one hundred and twenty kinds of notebook PCs. We evaluated our method
through experiments conducted by 117 people and confirmed its effectiveness.
2. Forecasting with Neural Networks and Selective Learning
Prediction using back-propagation neural networks has been extensively investigated (e.g.,
(Weigend et al., 1990) ; (Vemuri & Rogers, 1994) ; (Mandic & Chambers, 2001)), and various
attempts have been made to apply neural networks to financial market prediction (e.g.,
(Azoff, 1994) ; (Refenes & Azema-Barac, 1994) ; (White, 1988) ; (Baba & Kozaki, 1992) ;
(Freisleben, 1992) ; (Tang et al., 1991) ; (Kohara, 2002)), electricity load forecasting (e.g., (Park
et al., 1991)) and other areas. In the usual approach, all training data are equally presented to
a neural network (i.e., presented in each cycle) and the learning rates are equal for all the
training data independently of the size of the changes in the prediction-target time series.
Also, network learning is usually stopped at the point of minimal mean squared error
between the network’s outputs and the desired outputs.
Generally, the ability to predict large changes is more important than the ability to predict
small changes, as we mentioned in the previous paper (Kohara, 1995). When all training
data are presented equally with an equal learning rate, the BPNN will learn the small and
large changes equally well, so it cannot learn the large changes more effectively. We have
investigated selective learning techniques for improving the ability of neural networks to
predict large changes. We previously proposed the selective-presentation (Kohara, 1995) and
selective-learning-rate (Kohara, 1996) approaches and applied them into stock market
prediction. In the selective-presentation approach, the training data corresponding to large
changes in the prediction-target time series are presented more often. In the selective-
learning-rate approach, the learning rate for training data corresponding to small changes is
reduced. The previous paper (Kohara, 1995) also investigated another stopping criterion for
financial predictions. Network learning is stopped at the point having the maximum profit
through experimental stock-trading.
We also previously proposed combining the selective-presentation and selective-learning-rate
approaches (Kohara, 2008). By combining these two approaches, we can easily achieved
fine-tuned and step-by-step selective learning of neural networks according to the degree of
change. Daily stock prices were predicted as a noisy real-world problem.
2.1 Selective-Presentation and Selective-Learning-Rate Approaches
To allow neural networks to learn about large changes in prediction-target time series more
effectively, we separate the training data into large-change data (L-data) and small-change
data (S-data). L-data (S-data) have next-day changes that are larger (smaller) than a preset
value. In the selective-presentation approach, the L-data are presented to neural networks
more often than S-data. For example, all training data are presented every fifth learning
cycle, while the L-data are presented every cycle. In the selective-learning-rate approach, all
training data are presented in every cycle; however, the learning rate of the back-
propagation training algorithm for S-data is reduced compared with that for L-data. These
two approaches are outlined as follows.
Selective-Presentation Approach
1. Separate the training data into L-data and S-data.
2. Train back-propagation networks with more presentations of L-data than of S-data.
3. Stop network learning at the point satisfying a certain stopping criterion (e.g., stop
at the point having the maximum profit).
Selective-Learning-Rate Approach
1. Separate the training data into L-data and S-data.
2. Train back-propagation networks with a lower learning rate for the S-data than for
the L-data.
3. Stop network learning at the point satisfying a certain stopping criterion (e.g., stop
at the point having the maximum profit).
We combined these two approaches to achieve fine-tuned and step-by-step learning of
neural networks according to the degree of change. The outline is as follows.
Combining Selective-Presentation and Selective-Learning-Rate Approaches
1. Separate the training data into L-data and S-data.
2. Separate L-data into two subsets: L1-data and L2-data, where changes in L2- data are
larger than those in L1-data.
3. Separate S-data into two subsets: S1-data and S2-data, where changes in S2-data are larger
than those in S1-data.
4. Train back-propagation networks with more presentations of L1- and L2-data than of S1-
and S2-data, and with a lower learning rate for L1- and S1-data than for L2 and S2-data.
5. Stop network learning at the point satisfying a certain stopping criterion (e.g., stop
at the point having the maximum profit).
2.2 Evaluation through Experimental Stock-Price Prediction
We considered the following types of knowledge for predicting Tokyo stock prices. These
types of knowledge involve numerical economic indicators (Kohara, 1995).
1. If interest rates decrease, stock prices tend to increase, and vice versa.
2. If the dollar-to-yen exchange rate decreases, stock prices tend to decrease, and vice versa.
3. If the price of crude oil increases, stock prices tend to decrease, and vice versa.
We used the following five indicators as inputs to the neural network.
TOPIX: the chief Tokyo stock exchange price index
EXCHANGE: the dollar-to-yen exchange rate (yen/dollar)
INTEREST: an interest rate (3-month CD, new issue, offered rates) (%)
OIL: the price of crude oil (dollars/barrel)
NY: New York Dow-Jones average of the closing prices of 30 industrial stocks (dollars)
TOPIX was the prediction target. EXCHANGE, INTEREST and OIL were chosen based on
the knowledge of numerical economic indicators. The Dow-Jones average was used because
Tokyo stock market prices are often influenced by New York exchange prices. We assume
that tomorrow’s change in TOPIX is determined by today’s changes in the five indicators
according to the knowledge. Therefore, the daily changes in these five indicators (e.g.
TOPIX(t) = TOPIX(t) - TOPIX(t-1)) were input into neural networks, and the next-day’s
change in TOPIX was presented to the neural network as the desired output (Fig. 1). The
back-propagation algorithm was used to train the network. All the data of the daily changes
were scaled to the interval [0.1, 0.9]. A 5-5-1 multi-layered neural network was used (five
neurons in the input layer, five in the hidden layer, and one in the output layer).
AUTOMATION&CONTROL-TheoryandPractice234
Fig. 1. Neural prediction model
2.3 Evaluation Experiments
We used data from a total of 409 days (from August 1, 1989 to March 31, 1991): 300 days for
training, 30 days for validation (making decisions on stopping the network learning), and 79
days for making predictions. In Experiment 1, all training data were presented in each cycle
with an equal learning rate (
= 0.7). In Experiment 2, L-data were presented five times as
often as S-data. Here, the large-change threshold was 14.78 points (about US$ 1.40), which
was the median of absolute value of TOPIX daily changes in the training data. In
Experiment 3, the learning rate for the S-data was reduced up to 20% (i.e.,
= 0.7 for the L-
data and
= 0.14 for the S-data). In each experiment, network learning was stopped at the
point having the maximum profit (the learning was stopped at the point having the
maximum profit for the validation data during 8000 learning cycles). The prediction error
and profit were monitored after every hundred learning cycles.
When a large change in TOPIX was predicted, we tried to calculate “Profit” as follows:
when the predicted direction was the same as the actual direction, the daily change in
TOPIX was earned, and when it was different, the daily change in TOPIX was lost. This
calculation of profit corresponds to the following experimental TOPIX trading system. A
buy (sell) order is issued when the predicted next-day's up (down) in TOPIX is larger than a
preset value which corresponds to a large change. When a buy (sell) order is issued, the
system buys (sells) TOPIX shares at the current price and subsequently sells (buys) them
back at the next-day price. Transaction costs on the trades were ignored in calculating the
profit. The more accurately a large change is predicted, the larger the profit is.
In each experiment, the momentum parameter
was 0.7. All the weights and biases in the
neural network were initialized randomly between -0.3 and 0.3. In each experiment the
neural network was run four times for the same training data with different initial weights
and the average was taken.
The experimental results are shown in Table 1. Multiple regression analysis (MR) was also
used in the experiments. The “prediction error on large-change test data” is the mean
absolute value of the prediction error for the test L-data. Applying our selective-presentation
approach (Experiment 2) reduced the prediction error for test L-data and improved profits:
the prediction-error on L-data was reduced by 7% (1- (21.3/22.9)) and the network’s ability
to make profits through experimental TOPIX-trading was improved by 30% (550/422)
compared with the results obtained with the usual presentation approach (Experiment 1).
The prediction error and profits in Experiment 3 (selective-learning-rate approach) were
comparable to those in Experiment 2 (selective-presentation approach). Combining selective-
presentation with selective-learning-rate approaches further reduced the prediction error for
)(
)(
)(
)(
)(
tNY
tOIL
tINTEREST
tEXCHANGE
tTOPIX
Neural network
)1( tTOPIX
test L-data and improved profits: the prediction-error was reduced by 10% and the
network’s ability to make profits was improved by 38% (Kohara, 2008).
MR Experiment 1
Experiment 2 Experiment 3
Presentation method equal equal
selective
equal
Learning rate equal equal
selective
Prediction error for
large-change data
(relative value)
24.3
(1.06)
22.9
(1)
21.3
(0.93)
21.3
(0.93)
Profit on test data
(relative value)
265
(0.62)
422
(1)
550
(1.30)
563
(1.33)
Table 1. Experimental results on daily stock price prediction
2.4 Summary of Section 2
We described selective learning techniques for forecasting. In the first approach, training
data corresponding to large changes in the prediction-target time series are presented more
often, in the second approach, the learning rate for training data corresponding to small
changes is reduced, and in the third approach, these two techniques are combined. The
results of several experiments on stock-price prediction showed that the performances of
these two approaches were similar and both better than the usual presentation approach,
and combining them further improved the performance. Next, we will apply these
techniques today’s stock market and other real-world forecasting problems. We also plan to
develop a forecasting method that integrates statistical analysis with neural networks.
3. Diagnosis with Self-Organizing Maps and Ensemble Learning
We applied decision trees, Bayesian networks and SOM to medical diagnosis such as breast
cancer, heart disease and hypothyroid diagnosis. The UCI data sets (Merz et al., 1997) were
used as medical diagnosis problem. The accuracy of breast cancer and hypothyroid
diagnosis was comparatively high and the accuracy of heart disease diagnosis was
comparatively low. Therefore, we applied ensemble learning such as bagging (Breiman,
1994) and boosting (Schapire, 1990) of SOM to heart disease diagnosis. The accuracy with
ensemble learning of SOM was much improved.
3.1 Medical Diagnosis with Decision Trees, Self-Organizing Maps, and Bayesian
Networks
Viscovery SOMine 4.0 was used as SOM software and See5 release 1.19 was used as decision
tree software with default parameter values. We used BayoNet 3.0.7 as Bayesian network
software and constructed Bayesian networks semi-automatically. All problems were
evaluated with 10-fold cross-validation. Experimental results on accuracy for medical
diagnosis are shown in Table 2. Accuracy for breast cancer diagnosis (breast-w) was
comparatively high and accuracy for heart disease diagnosis (heart-c) was comparatively
low. In these problems, the accuracy with SOM was comparatively high and the accuracy
with decision trees was comparatively low.
Forecasting,DiagnosisandDecisionMakingwithNeuralNetworksandSelf-OrganizingMaps 235
Fig. 1. Neural prediction model
2.3 Evaluation Experiments
We used data from a total of 409 days (from August 1, 1989 to March 31, 1991): 300 days for
training, 30 days for validation (making decisions on stopping the network learning), and 79
days for making predictions. In Experiment 1, all training data were presented in each cycle
with an equal learning rate (
= 0.7). In Experiment 2, L-data were presented five times as
often as S-data. Here, the large-change threshold was 14.78 points (about US$ 1.40), which
was the median of absolute value of TOPIX daily changes in the training data. In
Experiment 3, the learning rate for the S-data was reduced up to 20% (i.e.,
= 0.7 for the L-
data and
= 0.14 for the S-data). In each experiment, network learning was stopped at the
point having the maximum profit (the learning was stopped at the point having the
maximum profit for the validation data during 8000 learning cycles). The prediction error
and profit were monitored after every hundred learning cycles.
When a large change in TOPIX was predicted, we tried to calculate “Profit” as follows:
when the predicted direction was the same as the actual direction, the daily change in
TOPIX was earned, and when it was different, the daily change in TOPIX was lost. This
calculation of profit corresponds to the following experimental TOPIX trading system. A
buy (sell) order is issued when the predicted next-day's up (down) in TOPIX is larger than a
preset value which corresponds to a large change. When a buy (sell) order is issued, the
system buys (sells) TOPIX shares at the current price and subsequently sells (buys) them
back at the next-day price. Transaction costs on the trades were ignored in calculating the
profit. The more accurately a large change is predicted, the larger the profit is.
In each experiment, the momentum parameter
was 0.7. All the weights and biases in the
neural network were initialized randomly between -0.3 and 0.3. In each experiment the
neural network was run four times for the same training data with different initial weights
and the average was taken.
The experimental results are shown in Table 1. Multiple regression analysis (MR) was also
used in the experiments. The “prediction error on large-change test data” is the mean
absolute value of the prediction error for the test L-data. Applying our selective-presentation
approach (Experiment 2) reduced the prediction error for test L-data and improved profits:
the prediction-error on L-data was reduced by 7% (1- (21.3/22.9)) and the network’s ability
to make profits through experimental TOPIX-trading was improved by 30% (550/422)
compared with the results obtained with the usual presentation approach (Experiment 1).
The prediction error and profits in Experiment 3 (selective-learning-rate approach) were
comparable to those in Experiment 2 (selective-presentation approach). Combining selective-
presentation with selective-learning-rate approaches further reduced the prediction error for
)(
)(
)(
)(
)(
tNY
tOIL
tINTEREST
tEXCHANGE
tTOPIX
Neural network
)1(
tTOPIX
test L-data and improved profits: the prediction-error was reduced by 10% and the
network’s ability to make profits was improved by 38% (Kohara, 2008).
MR Experiment 1
Experiment 2 Experiment 3
Presentation method equal equal
selective
equal
Learning rate equal equal
selective
Prediction error for
large-change data
(relative value)
24.3
(1.06)
22.9
(1)
21.3
(0.93)
21.3
(0.93)
Profit on test data
(relative value)
265
(0.62)
422
(1)
550
(1.30)
563
(1.33)
Table 1. Experimental results on daily stock price prediction
2.4 Summary of Section 2
We described selective learning techniques for forecasting. In the first approach, training
data corresponding to large changes in the prediction-target time series are presented more
often, in the second approach, the learning rate for training data corresponding to small
changes is reduced, and in the third approach, these two techniques are combined. The
results of several experiments on stock-price prediction showed that the performances of
these two approaches were similar and both better than the usual presentation approach,
and combining them further improved the performance. Next, we will apply these
techniques today’s stock market and other real-world forecasting problems. We also plan to
develop a forecasting method that integrates statistical analysis with neural networks.
3. Diagnosis with Self-Organizing Maps and Ensemble Learning
We applied decision trees, Bayesian networks and SOM to medical diagnosis such as breast
cancer, heart disease and hypothyroid diagnosis. The UCI data sets (Merz et al., 1997) were
used as medical diagnosis problem. The accuracy of breast cancer and hypothyroid
diagnosis was comparatively high and the accuracy of heart disease diagnosis was
comparatively low. Therefore, we applied ensemble learning such as bagging (Breiman,
1994) and boosting (Schapire, 1990) of SOM to heart disease diagnosis. The accuracy with
ensemble learning of SOM was much improved.
3.1 Medical Diagnosis with Decision Trees, Self-Organizing Maps, and Bayesian
Networks
Viscovery SOMine 4.0 was used as SOM software and See5 release 1.19 was used as decision
tree software with default parameter values. We used BayoNet 3.0.7 as Bayesian network
software and constructed Bayesian networks semi-automatically. All problems were
evaluated with 10-fold cross-validation. Experimental results on accuracy for medical
diagnosis are shown in Table 2. Accuracy for breast cancer diagnosis (breast-w) was
comparatively high and accuracy for heart disease diagnosis (heart-c) was comparatively
low. In these problems, the accuracy with SOM was comparatively high and the accuracy
with decision trees was comparatively low.
AUTOMATION&CONTROL-TheoryandPractice236
Decision trees SOM Bayesian networks
Software See5 release 1.19 Viscovery SOMine 4.0 BayoNet 3.0.7
Breast-w 95.3% 99.1% 96.0%
Heart-c 72.7% 89.4% 80.6%
Table 2. Experimental results on accuracy for medical diagnosis (1)
Therefore, we apply SOM and decision trees to hypothyroid data. All problems were
evaluated with 10-fold cross-validation. Experimental results on accuracy are shown in
Table 3. The accuracy for hypothyroid diagnosis was comparatively high. In this problem,
the accuracy with decision trees was better than that with SOM.
Decision trees SOM
Software See5 release 1.19 Viscovery SOMine 4.0
Hypothyroid 99.5% 96.8%
Table 3. Experimental results on accuracy for medical diagnosis (2)
3.2 Related Work
Tsoumakas et al. dealt with the combination of classification models that have been derived
from running different (heterogeneous) learning algorithm on the same data set (Tsoumakas
et al., 2004). They used WEKA implementations of the 10 base-level classification
algorithms: decision tree (C4.5), support vector machine (SVM), naïve Bayes, k nearest
neighbor, radial basis function and so on. Experimental results on accuracy for the same
medical data as we used are shown in Table 4. Both worst and best results stated in the
reference are shown.
Zhang & Su extended decision trees to represent a joint distribution and conditional
independence, called conditional independence trees (CITrees) and reported that the CITree
algorithm outperforms C4.5 and naïve Bayes significantly in classification accuracy (Zhang
& Su, 2004). Their experimental results on accuracy for the same medical data as we used
are also shown in Table 4.
Garcia-Pedrajas et al. presented a new approach to crossover operator in genetic evolution
of neural networks and reported that their approach was compared to a classical crossover
with an excellent performance (Garcia-Pedrajas et al., 2006). Their experimental results on
accuracy for the same medical data as we used are also shown in Table 4.
Radivojac et al. investigated the problem of supervised feature selection within the filtering
framework (Radivojac et al., 2004). In their approach, applicable to the two-class problems,
the feature strength is inversely proportional to the p-value of the null hypothesis. Their
experimental results for accuracy of heart disease data performed using naïve Bayes and
SVM are shown in Table 4.
Robnik-Sikonja improved random forests (Breiman, 2001) and the experimental results on
accuracy for breast cancer data are shown in Table 4 (Robnik-Sikonja, 2004). As mentioned
above, the accuracy for breast cancer was high up to 99.5% (Garcia-Pedrajas et al., 2006) and
the accuracy for hypothyroid was also high up to 99.7% (Tsoumakas et al., 2004). On the
other hand, the accuracy for heart disease was comparatively low. The accuracy was 89.4%
at most which was attained by SOM.
Reference Tsoumakas et al., 2004 Zhang & Su, 2004 Garcia-Pedrajas et al., 2006
Classifier Voting DT, NB NN, GA
Breast-w 97.0% to 98.0% 94.3% to 97.1% 93.8% to 99.5%
Heart-c 81.8% to 88.4% 78.1% to 84.4% 86.7% to 89.1%
Hypothyroid 97.2% to 99.7% 93.1% to 93.2% 94.4% to 94.9%
Reference Radivojac et al., 2004 Robnik-Sikonja, 2004 This chapter
Classifier NB, SVM RF SOM
Breast-w Not available 96.6% to 96.7% 99.1%
Heart-c 83.5% to 83.9% Not available 89.4%
Hypothyroid Not available Not available 96.8%
Voting: voting of heterogeneous classifiers including DT, NB, SVM etc.,
DT: decision trees, NB: naïve Bayes, SVM: support vector machine,
NN: neural networks, GA: genetic algorithm, RF: random forest.
Table 4. Experimental results on accuracy for medical diagnosis (3)
Quinlan investigated ensemble learning such as bagging and boosting of C4.5 (Quinlan,
1996). Experimental results on accuracy for the same medical data as we used are shown in
Table 5. Bagging and boosting improved average of accuracy by about 1%. Therefore, we
have decided to apply ensemble learning of SOM to heart disease data.
C4.5 Bagged C4.5 Boosted C4.5
Breast-w 94.7% 95.8% 95.9%
Heart-c 77.0% 78.5% 78.6%
Hypothyroid
99.5% 99.6% 99.6%
Average 90.4% 91.3% 91.4%
Table 5. Experimental results on accuracy for medical diagnosis (4)
3.3 Ensemble Learning of Self-Organizing Maps
The steps of bagging and boosting for 10-fold cross-validation we used are as follows.
Bagging
Step 1: Divide all data into ten sets.
Step 2: Select one set for test data and use the remains for training set.
Step 3: Resample training subset from the training set mentioned in Step 2.
Step 4: Train SOM using the training subset resampled in Step 3.
Step 5: Repeat Step 3 to Step 4 nine times more and train the other nine SOM.
Step 6: Input test data to ten SOM and obtain results with mean summed outputs by
ten SOM.
Step 7: Repeat Step 2 to Step 6 nine times more and obtain average accuracy for test
data.
Boosting
Step 1: Divide all data into ten sets.
Step 2: Select one set for test data and use the remains for training set.
Step 3: Train SOM using training set, input test data to the SOM and obtain results
with outputs by the SOM.
Forecasting,DiagnosisandDecisionMakingwithNeuralNetworksandSelf-OrganizingMaps 237
Decision trees SOM Bayesian networks
Software See5 release 1.19 Viscovery SOMine 4.0 BayoNet 3.0.7
Breast-w 95.3% 99.1% 96.0%
Heart-c 72.7% 89.4% 80.6%
Table 2. Experimental results on accuracy for medical diagnosis (1)
Therefore, we apply SOM and decision trees to hypothyroid data. All problems were
evaluated with 10-fold cross-validation. Experimental results on accuracy are shown in
Table 3. The accuracy for hypothyroid diagnosis was comparatively high. In this problem,
the accuracy with decision trees was better than that with SOM.
Decision trees SOM
Software See5 release 1.19 Viscovery SOMine 4.0
Hypothyroid 99.5% 96.8%
Table 3. Experimental results on accuracy for medical diagnosis (2)
3.2 Related Work
Tsoumakas et al. dealt with the combination of classification models that have been derived
from running different (heterogeneous) learning algorithm on the same data set (Tsoumakas
et al., 2004). They used WEKA implementations of the 10 base-level classification
algorithms: decision tree (C4.5), support vector machine (SVM), naïve Bayes, k nearest
neighbor, radial basis function and so on. Experimental results on accuracy for the same
medical data as we used are shown in Table 4. Both worst and best results stated in the
reference are shown.
Zhang & Su extended decision trees to represent a joint distribution and conditional
independence, called conditional independence trees (CITrees) and reported that the CITree
algorithm outperforms C4.5 and naïve Bayes significantly in classification accuracy (Zhang
& Su, 2004). Their experimental results on accuracy for the same medical data as we used
are also shown in Table 4.
Garcia-Pedrajas et al. presented a new approach to crossover operator in genetic evolution
of neural networks and reported that their approach was compared to a classical crossover
with an excellent performance (Garcia-Pedrajas et al., 2006). Their experimental results on
accuracy for the same medical data as we used are also shown in Table 4.
Radivojac et al. investigated the problem of supervised feature selection within the filtering
framework (Radivojac et al., 2004). In their approach, applicable to the two-class problems,
the feature strength is inversely proportional to the p-value of the null hypothesis. Their
experimental results for accuracy of heart disease data performed using naïve Bayes and
SVM are shown in Table 4.
Robnik-Sikonja improved random forests (Breiman, 2001) and the experimental results on
accuracy for breast cancer data are shown in Table 4 (Robnik-Sikonja, 2004). As mentioned
above, the accuracy for breast cancer was high up to 99.5% (Garcia-Pedrajas et al., 2006) and
the accuracy for hypothyroid was also high up to 99.7% (Tsoumakas et al., 2004). On the
other hand, the accuracy for heart disease was comparatively low. The accuracy was 89.4%
at most which was attained by SOM.
Reference Tsoumakas et al., 2004 Zhang & Su, 2004 Garcia-Pedrajas et al., 2006
Classifier Voting DT, NB NN, GA
Breast-w 97.0% to 98.0% 94.3% to 97.1% 93.8% to 99.5%
Heart-c 81.8% to 88.4% 78.1% to 84.4% 86.7% to 89.1%
Hypothyroid 97.2% to 99.7% 93.1% to 93.2% 94.4% to 94.9%
Reference Radivojac et al., 2004 Robnik-Sikonja, 2004 This chapter
Classifier NB, SVM RF SOM
Breast-w Not available 96.6% to 96.7% 99.1%
Heart-c 83.5% to 83.9% Not available 89.4%
Hypothyroid Not available Not available 96.8%
Voting: voting of heterogeneous classifiers including DT, NB, SVM etc.,
DT: decision trees, NB: naïve Bayes, SVM: support vector machine,
NN: neural networks, GA: genetic algorithm, RF: random forest.
Table 4. Experimental results on accuracy for medical diagnosis (3)
Quinlan investigated ensemble learning such as bagging and boosting of C4.5 (Quinlan,
1996). Experimental results on accuracy for the same medical data as we used are shown in
Table 5. Bagging and boosting improved average of accuracy by about 1%. Therefore, we
have decided to apply ensemble learning of SOM to heart disease data.
C4.5 Bagged C4.5 Boosted C4.5
Breast-w 94.7% 95.8% 95.9%
Heart-c 77.0% 78.5% 78.6%
Hypothyroid
99.5% 99.6% 99.6%
Average 90.4% 91.3% 91.4%
Table 5. Experimental results on accuracy for medical diagnosis (4)
3.3 Ensemble Learning of Self-Organizing Maps
The steps of bagging and boosting for 10-fold cross-validation we used are as follows.
Bagging
Step 1: Divide all data into ten sets.
Step 2: Select one set for test data and use the remains for training set.
Step 3: Resample training subset from the training set mentioned in Step 2.
Step 4: Train SOM using the training subset resampled in Step 3.
Step 5: Repeat Step 3 to Step 4 nine times more and train the other nine SOM.
Step 6: Input test data to ten SOM and obtain results with mean summed outputs by
ten SOM.
Step 7: Repeat Step 2 to Step 6 nine times more and obtain average accuracy for test
data.
Boosting
Step 1: Divide all data into ten sets.
Step 2: Select one set for test data and use the remains for training set.
Step 3: Train SOM using training set, input test data to the SOM and obtain results
with outputs by the SOM.
AUTOMATION&CONTROL-TheoryandPractice238
Step 4: Duplicate the misclassified data in Step 3 to the training set used in Step 3 and
obtain modified training set.
Step 5: Repeat Step 3 to Step 4 nine times more to the other nine SOM.
Step 6: Input test data to ten SOM and obtain results with mean summed outputs by
ten SOM.
Step 7: Repeat Step 2 to Step 6 nine times more and obtain average accuracy for test
data.
We resampled 60% data of the training set in the Step 3 of bagging. When there were not
misclassified data in the Step 5 of boosting, we didn’t repeat Step 3 to Step 4 and the number
of SOM in the Step 6 of boosting was not always ten.
Experimental results on accuracy for heart disease data with ensemble learning of SOM are
shown in Table 6. Bagging and boosting improved accuracy by 1.7% and 5.0%, respectively.
Especially, boosted SOM was very effective in heart disease data and its accuracy reached
94.4% which was better than that described in references mentioned above by about 5 to
10%.
SOM Bagged SOM Boosted SOM
Heart-c 89.4% 91.1% 94.4%
Table 6. Experimental results on accuracy for medical diagnosis (5)
3.4 Summary of Section 3
We applied SOM to medical diagnosis such as breast cancer, heart disease and hypothyroid
diagnosis, comparing with decision trees and Bayesian networks. We found that their
accuracy of breast cancer and hypothyroid diagnosis was comparatively high and their
accuracy of heart disease diagnosis was comparatively low. Then, we applied ensemble
learning such as bagging and boosting of SOM to heart disease diagnosis. We found that
their accuracy was much improved. Next, we will apply SOM and ensemble learning to the
other medical diagnosis of the UCI data sets such as lung cancer and diabetes. We also plan
to develop a diagnosis method that integrates decision trees and Bayesian networks with
SOM.
4. Decision Making with Self-Organizing Maps and Analytic Hierarchy
Process
According to Kotler (Kotler, 2002), marketing scholars have developed a stages model of the
buying decision process. The consumer passes through five stages: problem recognition,
information search, evaluation of alternatives, purchase decision, and postpurchase
behavior. Five successive sets are involved in consumer decision making. The first set is the
total set of brands available to the consumer. The individual consumer will come to know
only a subset of these brands (awareness set). Some brands will meet initial buying criteria
(consideration set). As the person gathers more information, only a few will remain as strong
contenders (choice set). The brands in the choice set might all be acceptable. The person
makes a final choice from this set.
Several intelligent decision support systems (DSS) have been proposed to aid in a variety of
problems (see Table 7). We proposed a purchase decision support method using SOM and
AHP (Kohara & Isomae, 2006). First, we divide many products (total set) into several clusters
using SOM. Secondly, we select some alternatives (choice set) using the product maps.
Finally, we make a final choice from the alternatives using AHP. As an example of real-
world applications, we apply our method to a buying personal computer (PC) problem. We
considered one hundred and twenty kinds of notebook PCs. We evaluated our method
through experiments conducted by 117 people and confirmed its effectiveness.
Application Approach Reference
Bankruptcy prediction CBR and AHP Park & Han, 2002
Weather prediction Fuzzy reasoning Riordan & Hansen, 2002
Economic prediction Neural networks Kohara, 2002
Electricity business planning Knowledge-based system Ha et al., 2003
Economic market model Multi-agent system Walle & Moldovan, 2003
Clinical decision support AHP Suka et al., 2003
Purchase decision support SOM and AHP Kohara & Isomae, 2006
Table 7. Examples of intelligent decision support systems
4.1 Self-Organizing Maps of Personal Computers
The SOM algorithm is based on unsupervised, competitive learning. It provides a topology
preserving mapping from the high dimensional space to map units. Map units, or neurons,
usually form a two-dimensional lattice and thus the mapping is a mapping from high
dimensional space onto a plane. The property of topology preserving means that the
mapping preserves the relative distance between the points. Points that are near each other
in the input space are mapped to nearby map units in the SOM. The SOM can thus serve as
a cluster analyzing tool of high-dimensional data. We considered one hundred and twenty
kinds of notebook PCs which were sold in Japan on June 2004. We clustered these PCs using
the following features: CPU speed (GHz), main memory capacity (MB), HDD storage
capacity (GB), weight (kg), price (yen), battery life (hours), and so on.
We used the above features in two ways: continuous and classified data input. For classified
data of CPU speed, we divide into three classes: under 1, 1 to 2, and over 2 GHz. For
classified data of main memory capacity, we divide into two classes: 256 and 512 MB. For
classified data of HDD storage capacity, we divide into three classes: under 40, 40 to 60, and
over 60 GB. For classified data of weight, we divide into five classes: under 1, 1 to 2, 2 to 3, 3
to 4, and over 4 Kg. For classified data of price, we divide into six classes: under 100, 100 to
150, 150 to 200, 200 to 250, 250 to 300, and over 300 thousand yen. For classified data of
battery life, we divide into six classes: under 1, 1 to 2, 2 to 3, 3 to 4, 4 to 5, and over 5 hours.
Viscovery SOMine 4.0 was used as SOM software. Fig. 2 and Fig. 3 show self-organizing map
and an example of component map of PCs with classified data inputs, respectively. Fig. 4
and Fig. 5 show self-organizing map and an example of component map of PCs with
continuous data inputs, respectively. There were five clusters in Fig. 2. When inspecting
component maps, the feature of each cluster is clear. For example, when inspecting “under 1
GHz (1-GHz)” component map (see Fig. 3), we understand that one of the features of
Cluster 5 is that CPU speed is under 1 GHz. In Fig. 3, originally red color (here, black)
neurons correspond to under 1 GHz class and originally blue color (here, dark grey)
neurons correspond to the other class.
Forecasting,DiagnosisandDecisionMakingwithNeuralNetworksandSelf-OrganizingMaps 239
Step 4: Duplicate the misclassified data in Step 3 to the training set used in Step 3 and
obtain modified training set.
Step 5: Repeat Step 3 to Step 4 nine times more to the other nine SOM.
Step 6: Input test data to ten SOM and obtain results with mean summed outputs by
ten SOM.
Step 7: Repeat Step 2 to Step 6 nine times more and obtain average accuracy for test
data.
We resampled 60% data of the training set in the Step 3 of bagging. When there were not
misclassified data in the Step 5 of boosting, we didn’t repeat Step 3 to Step 4 and the number
of SOM in the Step 6 of boosting was not always ten.
Experimental results on accuracy for heart disease data with ensemble learning of SOM are
shown in Table 6. Bagging and boosting improved accuracy by 1.7% and 5.0%, respectively.
Especially, boosted SOM was very effective in heart disease data and its accuracy reached
94.4% which was better than that described in references mentioned above by about 5 to
10%.
SOM Bagged SOM Boosted SOM
Heart-c 89.4% 91.1% 94.4%
Table 6. Experimental results on accuracy for medical diagnosis (5)
3.4 Summary of Section 3
We applied SOM to medical diagnosis such as breast cancer, heart disease and hypothyroid
diagnosis, comparing with decision trees and Bayesian networks. We found that their
accuracy of breast cancer and hypothyroid diagnosis was comparatively high and their
accuracy of heart disease diagnosis was comparatively low. Then, we applied ensemble
learning such as bagging and boosting of SOM to heart disease diagnosis. We found that
their accuracy was much improved. Next, we will apply SOM and ensemble learning to the
other medical diagnosis of the UCI data sets such as lung cancer and diabetes. We also plan
to develop a diagnosis method that integrates decision trees and Bayesian networks with
SOM.
4. Decision Making with Self-Organizing Maps and Analytic Hierarchy
Process
According to Kotler (Kotler, 2002), marketing scholars have developed a stages model of the
buying decision process. The consumer passes through five stages: problem recognition,
information search, evaluation of alternatives, purchase decision, and postpurchase
behavior. Five successive sets are involved in consumer decision making. The first set is the
total set of brands available to the consumer. The individual consumer will come to know
only a subset of these brands (awareness set). Some brands will meet initial buying criteria
(consideration set). As the person gathers more information, only a few will remain as strong
contenders (choice set). The brands in the choice set might all be acceptable. The person
makes a final choice from this set.
Several intelligent decision support systems (DSS) have been proposed to aid in a variety of
problems (see Table 7). We proposed a purchase decision support method using SOM and
AHP (Kohara & Isomae, 2006). First, we divide many products (total set) into several clusters
using SOM. Secondly, we select some alternatives (choice set) using the product maps.
Finally, we make a final choice from the alternatives using AHP. As an example of real-
world applications, we apply our method to a buying personal computer (PC) problem. We
considered one hundred and twenty kinds of notebook PCs. We evaluated our method
through experiments conducted by 117 people and confirmed its effectiveness.
Application Approach Reference
Bankruptcy prediction CBR and AHP Park & Han, 2002
Weather prediction Fuzzy reasoning Riordan & Hansen, 2002
Economic prediction Neural networks Kohara, 2002
Electricity business planning Knowledge-based system Ha et al., 2003
Economic market model Multi-agent system Walle & Moldovan, 2003
Clinical decision support AHP Suka et al., 2003
Purchase decision support SOM and AHP Kohara & Isomae, 2006
Table 7. Examples of intelligent decision support systems
4.1 Self-Organizing Maps of Personal Computers
The SOM algorithm is based on unsupervised, competitive learning. It provides a topology
preserving mapping from the high dimensional space to map units. Map units, or neurons,
usually form a two-dimensional lattice and thus the mapping is a mapping from high
dimensional space onto a plane. The property of topology preserving means that the
mapping preserves the relative distance between the points. Points that are near each other
in the input space are mapped to nearby map units in the SOM. The SOM can thus serve as
a cluster analyzing tool of high-dimensional data. We considered one hundred and twenty
kinds of notebook PCs which were sold in Japan on June 2004. We clustered these PCs using
the following features: CPU speed (GHz), main memory capacity (MB), HDD storage
capacity (GB), weight (kg), price (yen), battery life (hours), and so on.
We used the above features in two ways: continuous and classified data input. For classified
data of CPU speed, we divide into three classes: under 1, 1 to 2, and over 2 GHz. For
classified data of main memory capacity, we divide into two classes: 256 and 512 MB. For
classified data of HDD storage capacity, we divide into three classes: under 40, 40 to 60, and
over 60 GB. For classified data of weight, we divide into five classes: under 1, 1 to 2, 2 to 3, 3
to 4, and over 4 Kg. For classified data of price, we divide into six classes: under 100, 100 to
150, 150 to 200, 200 to 250, 250 to 300, and over 300 thousand yen. For classified data of
battery life, we divide into six classes: under 1, 1 to 2, 2 to 3, 3 to 4, 4 to 5, and over 5 hours.
Viscovery SOMine 4.0 was used as SOM software. Fig. 2 and Fig. 3 show self-organizing map
and an example of component map of PCs with classified data inputs, respectively. Fig. 4
and Fig. 5 show self-organizing map and an example of component map of PCs with
continuous data inputs, respectively. There were five clusters in Fig. 2. When inspecting
component maps, the feature of each cluster is clear. For example, when inspecting “under 1
GHz (1-GHz)” component map (see Fig. 3), we understand that one of the features of
Cluster 5 is that CPU speed is under 1 GHz. In Fig. 3, originally red color (here, black)
neurons correspond to under 1 GHz class and originally blue color (here, dark grey)
neurons correspond to the other class.
AUTOMATION&CONTROL-TheoryandPractice240
Fig. 2. Self-organizing map of PCs with classified data inputs
Fig. 3. Component maps of PCs with classified data inputs
There were four clusters in Fig. 4. In CPU (GHz) component map of Fig. 5, originally red
(here, black) neurons correspond to 2.6 and more GHz and originally blue (here, dark grey)
neurons correspond to 0.9 GHz CPU speed. Originally green and yellow (here, light grey)
neurons correspond to intermediate values of CPU speed. When inspecting CPU component
map of Fig. 5, the feature of each cluster is not clear. So, classified data input is better than
continuous data input for clustering PCs. From now, we used classified data input only. We
inspected every component map and understand that features of Cluster 1 to Cluster 5 are
as in Table 8.
Fig. 4. Self-organizing map of PCs with continuous data inputs
Fig. 5. Component maps of PCs with continuous data inputs
Features Main feature
Cluster 1 1 to 2 GHz (CPU), 40 to 60 GB (HDD),
3 to 4 Kg (weight), 150 to 200 thousand yen (price)
High performance
Cluster 2 under 40 GB (HDD), 256 MB (main memory),
100 to 150 thousand yen (price)
Low performance
and low price
Cluster 3 over 60 GB (HDD), 512 MB (main memory),
over 200 thousand yen (price)
Highest performance and
high price
Cluster 4 1 to 2 Kg (weight), over 4 hours (battery life) High mobility
Cluster 5 under 1 GHz (CPU), under 1 Kg (weight),
150 to 200 thousand yen (price)
Small size
Table 8. Features of clusters with classified data inputs