Advances in Gas Turbine Technology Part 9 doc
Bạn đang xem bản rút gọn của tài liệu. Xem và tải ngay bản đầy đủ của tài liệu tại đây (1.09 MB, 30 trang )
Advances in Gas Turbine Technology
230
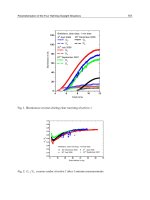
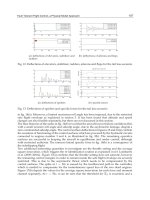
Figures 13 and 14 give the modeling results. Figure 13 shows the evolution of the heat
exchange surface versus the inlet radius. The greater the volute, the smaller the surface to
volume ratio. Small turbomachines therefore have a higher surface to volume ratio.
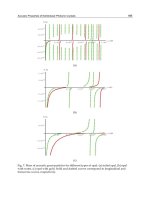
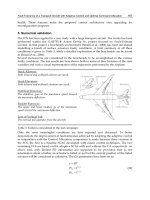
The necessity of taking into account heat transfer in small turbomachines is largely
confirmed by Figure 14: the heat losses in the volute are relatively greater.
In this study, when the inlet radius is halved, the surface to volume ratio doubles and the
heat losses are multiplied by about 2.5
Fig. 13. Ratio of heat exchange surface (S) and the volume (V) of the volute versus the inlet
radius
Influence of Heat Transfer on Gas Turbine Performance
231
Fig. 14. Heat transfer in the volute versus the size of the machine
4. Conclusion
Internal and external heat transfer induces a drop in the performance of gas turbines. This
study shows that the performance of small turbomachines evaluated with the assumption of
adiabaticity is not accurate.
For a given operating point, the mass flow and the compression ratio recorded on the maps
and the calculated performance do not correspond to the actual characteristics when the
machine operates with heat transfer.
The assumption that heat losses represent 15% of the work of adiabatic turbines, of which
60% is received by the compressor (non-insulated), leads to overestimating the power by
35% and the energy efficiency by 23%
Insulation of the turbine, although it seems to be a solution to maintain the operating
characteristics of adiabatic turbines, leads in fact to increasing the drop in performance.
For the insulated version, the net power is overestimated by 51% and efficiency by 26.6%. In
the absence of an adiabatic gas turbine (ideal machine), which provides the best
performance, we must avoid insulating the turbine in order not to decrease performance
still further.
To maintain the level of performance, and in particular the net power produced by the gas
turbines, despite heat transfer, adjustments are needed. They consist mainly in increasing
the fuel flow, resulting in an increase in the turbine inlet temperature. In the case of our
study, the fuel flow increase is 3.5% in the non-insulated version and 8.5% in the insulated
version. The turbine inlet temperature increase is 6.4% in the insulated version and 11.8% in
the non-insulated version.
Advances in Gas Turbine Technology
232
Finally, this study confirms that the assumption of adiabaticity is not valid in turbochargers,
micro and ultra-micro gas turbines. Compared to the available thermal energy at the turbine
inlet, heat losses increase with the surface to volume ratio which decreases in small-sized
machines. The quality of operation of small turbomachinery cannot be characterized with
isentropic efficiency which has no physical meaning because of the relative importance of
heat transfer.
The proposal of a new performance indicator and the development of new maps available
for any type of thermal turbomachines will therefore be the subject of our forthcoming
investigations.
5. Acknowledgment
The authors would like to acknowledge the French Cooperation EGIDE for funding this
study.
6. Appendix: Energy balance calculations
1. Adiabatic gas turbine:
Data: (see page 6)
Power of the gas turbine: P
GT
Compressor power : Pc
2i1Cmpi
PqcTT
;
γ-1
0,4
γ
i2 i1
1,4
i2 i1
i1 C
p T 288
T =T + -1 =288+ 7 -1 =555.71K
p η 0,8
Cpi2i1
=q c T -T =20 1 555.71-288 =5354.2
m
PkW
Turbine power P
T
:
T p i4 i3
=q c T -T
m
P ;
γ-1
0.33
γ
1.33
i4
i4 i3 i3 T
i3
p1
T=T+ -1T×η =973+ -1 ×973×0.85=665.64K
p6.42
Tpi4i3
= q c T -T = 20 1.13× 665.64-973 =6946.4kW
m
P
GT
= =6946.4-5354.2-66=1526.2 kW
TCml
PPPP
Thermal power supplied by combustion chamber: Q
cc
The fuel flow is neglected
pi3i2
=q c T -T =20 1.13× 973-555.71 =9430.7kW
cc m
Q
Influence of Heat Transfer on Gas Turbine Performance
233
Thermal power lost in the exhaust gas: Q
exh
=Q -P -P =9430.7-66-1526.2=7838.5kW
exh CC ml GT
Q
2. Non insulated gas turbine:
Data:
c
= 7.17 (Figure 6); q
m
= 19.8 kg.s
-1
(From the adiabatic compressor map). T
i2
= 604.20
K; Q
12
= 625.2 kW (thermal power received by the compressor).
Power of the gas turbine: P
GT
Thermal power received by the compressor: Q
12
12 Tad
Q = 0.15×0.6×P =0.15×0.6 6946.4=625.2 kW
P
Tad
: adiabatic turbine power
Compressor power: Pc
-1
2 1 i2 i1
γr
0.287×1.4
h -h = T -T = × 604.20-288 =317.62kJ.k
g
γ-1 0.4
12 m 12
ΔH=q Δh =317.62×19.8=6288.9 kW
12 12
P=ΔH -Q =6288.9-625.2=5663.7 kW
C
Turbine power P
T
:
GT
TGTCml
P =1526.2 kW
P =P +P +P =1526.4+5663.7+66=7256.1kW
Search for new turbine inlet temperature
The variation in the expansion ratio of the turbine versus the reduced mass flow (Figure 3)
shows that when the expansion ratio is greater than two (2), the reduced mass flow remains
constant (Pluviose M., 2005). This reduced flow constant calculated in adiabatic conditions
enables the new turbine inlet temperature (T
i3
) corresponding to the new pressure (p
i3
) to be
determined by the following equations.
33
5
5
33
973
20 92.55 10
6.42 1.05 10
ii
mm
m reduced
ii
ad nonins
TT
qq q
pp
ad: adiabatic
Non ins: non insulated
31
0.95 0.95 7.17 1.01325 6.902
i nonins Cnonins i
pp
bars
2
2
55
3
3
92.55 10 6.902 10
1040.6
19.8
inonins
m reduced
inonins
mnonins
qp
TK
q
Advances in Gas Turbine Technology
234
γ-1
0.33
γ
1.33
i4isentropic i3
T
11
T =T =1041.6× =652.90K
π 6.57
i4nonins
T =671.23K
Thermal power supplied by the combustion chamber: Q
cc
The fuel flow is neglected
pi3i2
=q c T -T =19.8 1.13× 1040.6-604.2 =9764kW
cc m
Q
Thermal power lost in the exhaust gas
=Q -P -P -P =9764-66-625.2/0.6-1526.4=7129.56kW
exh CC ml thl GT
Q
P
thl
: power of thermal losses .
3. Insulated gas turbine:
Data:
c
= 7.22 (Figure 6); q
m
= 19.5 kg.s
-1
(from the adiabatic compressor map). T
i2
= 622.68
K, Q
12
= 1042 kW (thermal power received by the compressor)
Power of the gas turbine: P
GT
Thermal power received by the compressor: Q
12
12 Tad
Q =0.15×P =0.15×6946.4=1042 kW
P
Tad
: Adiabatic turbine power
Compressor power: P
C
-1
2 1 i2 i1
γ
r
0.287×1.4
h -h = T -T = × 622.68-288 =336.19kJ.k
g
γ-1 0.4
12 m 12
ΔH=q Δh =317.62×19.5=6555.6 kW
12 12
P=ΔH -Q =6555.6-1042=5513.6 kW
C
Turbine power P
T
:
TAG T
TTAGCml
P =P =1526.2 kW
P =P +P +P =1526.4+5513.6+66=7105.8kW
Search for new turbine inlet temperature
33
5
5
33
973
20 92.55 10
6.42 1.05 10
ii
mm
m reduced
ii
ad ins
TT
qqq
pp
ad : adiabatic
31
0,95 0.95 7.22 1.01325 6.95
i ins Cins i
p
pbars
Influence of Heat Transfer on Gas Turbine Performance
235
2
2
55
3
3
92.55 10 6.95 10
1088
19.5
i insulated
m reduced
iinsulated
minsulated
qp
TK
q
γ-1
0.33
γ
1.33
i4isentropic i3
T
11
T =T =1088× =680.70K
π 6.62
i4
T =690K
Thermal power supplied by the combustion chamber: Q
CC
The fuel flow is neglected
pi3i2
=q c T -T =19.5 1.13× 1088-622.68 =10253kW
CC m
Q
Thermal power lost in the exhaust Q
exh
=Q -P -P -P =10253-66-1042-1526.2=7618.8kW
ech CC ml thl TAG
Q
7. References
Berger, M., Gostiaux, B., 1992, Géométrie différentielle: variétés, courbes et surfaces France
Presses universitaires de Paris,
ISBN : 2-13-044708-2.
Cormerais, M. 2007, Caractérisation expérimentale et modélisation des transferts thermiques
au sein d'un turbocompresseur d’automobile,
Thèse de doctorat de l’école centrale de
NANTES,
pp. 1-243.
Diango, A., 2010, Influence des pertes thermiques sur les performances des turbomachines.
Thèse de doctorat du Conservatoire national des arts et métiers, Paris, pp. 1-244.
Kreith, F., 1967,
Principles of heat transfer, Masson, [trad.] Kodja Badr-El-Dine, Université
d'ALEP (Syrie), Colorado, International textbook Company Scranton,
Pennsylvania, 1967. pp. 1-654.
Moreno, N., 2006, Modélisation des échanges thermiques dans une turbine radiale,
Thèse de
doctorat de l'École nationale supérieure d'arts et métiers, pp. 158.
Padet, J., 2005, Convection thermique et massique,
Techniques de l'ingénieur, BE 8206.
Pluviose, M., 2005. Conversion d'énergie par turbomachines,
Ellipses, pp. 1.277.ISBN 2-7298-
2320-4.
Pluviose, M., 2002, Machines à fluides, Ellipses, pp. 1-276, ISBN 2-7298-1175-3.
Pluviose, M., 2005, Similitude des turbomachines à fluide compressible,
Techniques de
l'ingénieur,
BM 468007.2005.
Pluviose, M. & Perilhon, C.(2002). Mécanismes de conversion de l'énergie,
echniques de
l'ingénieur.
BM 4281, 10-2002
Pluviose , M., Perilhon, C., 2002, Bilan énergétique et applications,
Techniques de l'ingénieur,
BM 4283, 04.2003.
Rautenberg & Al., 1981, Influence of heat transfer between turbine and compressor on the
performance of small turbocharger,
International Gas Turbine Congress, Tokyo, Asme
paper, 1981.
Advances in Gas Turbine Technology
236
Ribaud, Y., 2004, Overall Thermodynamics Model of an Ultra Micro turbine, Journal of
Thermal Science.
2004, Vol. 13, 4, pp. 297-301.
Sacadura, J. F., 1993, Initiation aux transferts thermiques,
Lavoisier Tec & Doc, Vol. 4
ème
tirage
1993, pp. 1-439, ISBN. 2-85206-618-1.
Verstraete, T. & al., 2007, Numerical Study of the Heat Transfer in Micro Gas Turbines,
Journal of Turbomachinery. ASME, Octobre 2007, Vol.129, DOI: 10.1115/1.2720874,
pp 835-841.
Part 4
Combustion
11
Developments of Gas Turbine
Combustors for Air-Blown and
Oxygen-Blown IGCC
Takeharu Hasegawa
Central Research Institute of Electric Power Industry
Japan
1. Introduction
From the viewpoints of securing a stable supply of energy and protecting our global
environment in the future, the integrated gasification combined cycle (IGCC) power
generation of various gasifying methods has been introduced in the world. Gasified fuels
are chiefly characterized by the gasifying agents and the synthetic gas cleanup methods and
can be divided into four types. The calorific value of the gasified fuel varies according to the
gasifying agents and feedstocks of various resources, and ammonia originating from
nitrogenous compounds in the feedstocks depends on the synthetic gas clean-up methods.
In particular, air-blown gasified fuels provide low calorific fuel of 4 MJ/m
3
and it is
necessary to stabilize combustion. In contrast, the flame temperature of oxygen-blown
gasified fuel of medium calorie between approximately 9–13 MJ/m
3
is much higher, so
control of thermal-NOx emissions is necessary. Moreover, to improve the thermal efficiency
of IGCC, hot/dry type synthetic gas clean-up is needed. However, ammonia in the fuel is
not removed and is supplied into the gas turbine where fuel-NOx is formed in the
combustor. For these reasons, suitable combustion technology for each gasified fuel is
important. In this paper, I will review our developments of the gas turbine combustors for
the three type gasified fuels produced from the following gasification methods through
experiments using a small diffusion burner and the designed combustors’ tests of the
simulated gasified fuels.
Air-blown gasifier + Hot/Dry type synthetic gas clean-up method.
Oxygen-blown gasifier + Wet type synthetic gas clean-up method.
Oxygen-blown gasifier + Hot/Dry type synthetic gas clean-up method.
Figure 1 provides an outline of a typical oxygen-blown IGCC system. In this system, raw
materials such as coal and crude are fed into the gasifier by slurry feed or dry feed with
nitrogen. The synthetic gas is cleaned through a dust removing and desulfurizing process.
The cleaned synthetic gas is then fed into the high-efficiency gas turbine topping cycle, and
the steam cycle is equipped to recover heat from the gas turbine exhaust. This IGCC system
is similar to LNG fired gas turbine combined cycle generation, except for the gasification
and the synthetic gas cleanup process, primarily. IGCC requires slightly more station service
power than an LNG gas turbine power generation.
Advances in Gas Turbine Technology
240
Coal
Pulverizer
Slag hopper
Gasification agent
Char
Char recovery
equipment
Gasifi er
Heat
exchanger
(Desulfurizing/
Char collecting)
Air
Compressor
Cooling water
Gen-
erator
Steam turbine
Gas turbine
Heat recovery
steam generator
Stack
Trans-
former
Gen-
erator
GAS TURBINE
HOT GAS CLEANUP
COAL GASIFIER
Fig. 1. Schematic diagram of typical IGCC system
1.1 Background of IGCC development in the world
The development of the gas turbine combustor for IGCC power generation received
considerable attention in the 1970s. Brown (1982), summarized the overall progress of IGCC
technology worldwide up until 1980. The history and application of gasification was also
mentioned by Littlewood (1977). Concerning fixed-bed type gasification processes, Hobbs et
al. (1993) extensively reviewed the technical and scientific aspects of the various systems.
Other developments concerning the IGCC system and gas turbine combustor using oxygen-
blown gasified coal fuel include: The Cool Water Coal Gasification Project (Savelli &
Touchton, 1985), the flagship demonstration plant of gasification and gasified fueled gas
turbine generation; the Shell process (Bush et al., 1991) in Buggenum, the first commercial
plant, which started test operation in 1994 and commercial operation in 1998; the Wabash
River Coal Gasification Repowering Plant (Roll, 1995) in the United States, in operation since
1995; the Texaco process at the Tampa power station (Jenkins, 1995), in commercial
operation since 1996; and an integrated coal gasification fuel cell combined cycle pilot plant,
consisting of a gasifier, fuel cell generating unit and gas turbine, in test operation since 2002
by Electric Power Development Co. Ltd. in Japan. Every plant adopted the oxygen-blown
gasification method. With regard to fossil-based gasification technology as described above,
commercially-based power plants have been developed, and new development challenges
toward global carbon capture storage (Isles, 2007; Beer, 2007) are being addressed.
Meanwhile, from 1986 to 1996, the Japanese government and electric power companies
undertook an experimental research project for the air-blown gasification combined cycle
system using a 200-ton-daily pilot plant. Recently, the government and electric power
companies have also been promoting a demonstration IGCC project with a capacity of 1700
tons per day (Nagano, 2009). For the future commercializing stage, the transmission-end
thermal efficiency of air-blown IGCC, adopting the 1773 K (1500°C)-class (average
combustor exhaust gas temperature at about 1773 K) gas turbine, is expected to exceed
48%(on HHV basis), while the thermal efficiency of the demonstration plant using a 1473 K
(1200°C)-class gas turbine is only 40.5%. IGCC technologies would improve thermal
efficiency by five points or higher compared to the latest pulverized coal-firing, steam
power generation. The Central Research Institute of Electric Power Industry (CRIEPI),
developed an air-blown two-stage entrained-flow coal gasifier (Kurimura et al., 1995), a
hot/dry synthetic gas cleanup system (Nakayama et al., 1990), and 150MW, 1773K(1500°C)-
class gas turbine combustor technologies for low-Btu fuel (Hasegawa et al., 1998a). In order
Developments of Gas Turbine Combustors for Air-Blown and Oxygen-Blown IGCC
241
to accept the various IGCC systems, 1773K-class gas turbine combustors of medium-Btu
fuels by wet-type or hot/dry-type synthetic gas cleanup methods have undergone study
(Hasegawa et al., 2003, 2007).
The energy resources and geographical conditions of each country, along with the
diversification of fuels used for the electric power industry (such as biomass, poor quality
coal and residual oil), are most significant issues for IGCC gas turbine development, as has
been previously described: The development of biomass-fueled gasification received
considerable attention in the United States and northern Europe in the early 1980s (Kelleher,
1985), and the prospects for commercialization technology (Consonni, 1997) appear
considerably improved at present. Paisley and Anson (1997) performed a comprehensive
economical evaluation of the Battele biomass gasification process, which utilizes a hot-gas
conditioning catalyst for dry synthetic gas cleanup. In northern Europe, fixed-bed
gasification heating plants built in the 1980s had been in commercial operation; the available
technical and economical operation data convinced small district heating companies that
biomass or peat-fueled gasification heating plants in the size class of 5 MW were the most
profitable (Haavisto, 1996). However, during the period of stable global economy and oil
prices, non-fossil-fueled gasification received little interest. Then, in the early 2000s when
the Third Conference of Parties to the United Nations Framework Convention on Climate
Change (COP3) invoked mandatory carbon dioxide emissions reductions on countries,
biomass-fueled gasification technology began to receive considerable attention as one
alternative. With the exception of Japanese national research and development project,
almost all of the systems using the oxygen-blown gasification are in their final stages for
commencing commercial operations overseas.
1.2 Progress in gas turbine combustion technologies for IGCCs
The plant thermal efficiency has been improved by enhancing the turbine inlet temperature,
or combustor exhaust temperature. The thermal-NOx emissions from the gas turbines
increase, however, along with a rise in exhaust temperature. In addition, gasified fuel
containing NH
3
emits fuel-NOx when hot/dry gas cleanup equipment is employed. It is
therefore viewed as necessary to adopt a suitable combustion technology for each IGCC in
the development of a gas turbine for each gasification method.
Dixon-Lewis and Williams (1969), expounded on the oxidation characteristics of hydrogen
and carbon monoxide in 1969. The body of research into the basic combustion characteristics
of gasified fuel includes studies on the flammability limits of mixed gas, consisting of CH
4
or H
2
diluted with N
2
, Ar or He (Ishizuka & Tsuji, 1980); a review of the flammability and
explosion limits of H
2
and H
2
/CO fuels (Cohen, 1992); the impact of N
2
on burning velocity
(Morgan & Kane, 1952); the effect of N
2
and CO
2
on flammability limits (Coward & Jones,
1952; Ishibasi et al, 1978); and the combustion characteristics of low calorific fuel (Folsom,
1980; Drake, 1984); studies by Merryman et al. (1997), on NOx formation in CO flame;
studies by Miller et al. (1984), on the conversion characteristics of HCN in H
2
-O
2
-HCN-Ar
flames; studies by Song et al. (1980), on the effects of fuel-rich combustion on the conversion
of the fixed nitrogen to N
2
; studies by White et al. (1983), on a rich-lean combustor for low-
Btu and medium-Btu gaseous fuels; and research of the CRIEPI into fuel-NOx emission
characteristics of low-calorific fuel, including NH
3
through experiments using a small
diffusion burner and analyses based on reaction kinetics (Hasegawa et al, 2001). It is widely
Advances in Gas Turbine Technology
242
accepted that two-stage combustion, as typified by rich-lean combustion, is effective in
reducing fuel-NOx emissions (Martin & Dederick, 1976; Yamagishi et al, 1974).
On the other hand, with respect to the combustion emission characteristics of oxygen-blown
medium calorific fuel, Pillsbury et al. (1976) and Clark et al. (1982) investigated low-NOx
combustion technologies using model combustors. In the 1970s, Battista and Farrell (1979)
and Beebe et al. (1982) attempted one of the earliest tests using medium-Btu fuel in a gas
turbine combustor. Concerning research into low-NOx combustion technology using
oxygen-blown medium calorific fuel, other studies include: Hasegawa et al. (1997),
investigation of NOx reduction technology using a small burner; and studies by Döbbeling
et al. (1994), on low NOx combustion technology (which quickly mixed fuel with air using
the double cone burner from Alstom Power, called an EV burner); Cook et al. (1994), on
effective methods for returning nitrogen to the cycle, where nitrogen is injected from the
head end of the combustor for NOx control; and Zanello and Tasselli (1996), on the effects of
steam content in medium-Btu gaseous fuel on combustion characteristics. In almost all
systems, surplus nitrogen was produced from the oxygen production unit and premixed
with a gasified medium-Btu fuel (Becker & Shetter, 1992), for recovering power used in
oxygen production and suppressing NOx emissions. Since the power to premix the surplus
nitrogen with the medium-Btu fuel is great, Hasegawa et al. studied low-NOx combustion
technologies using surplus nitrogen injected from the burner (Hasegawa et al, 1998b) and
with the lean combustion of instantaneous mixing (Hasegawa et al, 2003). Furthermore,
Hasegawa and Tamaru(2007) developed a low-NOx combustion technology for reducing
both fuel-NOx and thermal-NOx emissions, in the case of employing hot/dry synthetic gas
cleanup with an oxygen-blown IGCC.
1.3 Subjects of gas turbine combustors for IGCCs
The typical compositions of gasified fuels produced in air-blown or oxygen-blown gasifiers,
and in blast furnaces, are shown in Tables 1. Each type of gaseous mixture fuel consists of
CO and H
2
as the main combustible components, and small percentages of CH
4
. Fuel
calorific values vary widely (2–13 MJ/m
3
), from about 1/20 to 1/3 those of natural gas,
depending upon the raw materials of feedstock, the gasification agent and the gasifier type.
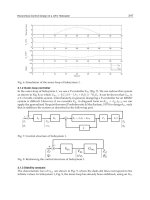
Figure 2 shows the theoretical adiabatic flame temperature of fuels which were: (1) gasified
fuels with fuel calorific values (HHV) of 12.7, 10.5, 8.4, 6.3, 4.2 MJ/m
3
; and (2) fuels in which
methane is the main component of natural gas. Flame temperatures were calculated using a
CO and H
2
mixture fuel (CO/H
2
molar ratio of 2.33:1), which contained no CH
4
under any
conditions, and the fuel calorific value was adjusted with nitrogen. In the case of gasified fuel,
as the fuel calorific value increased, the theoretical adiabatic flame temperature also increased.
Fuel calorific values of 4.2 MJ/m
3
and 12.7 MJ/m
3
produced maximum flame temperatures of
2050 K and 2530 K, respectively. At fuel calorific values of 8.4 MJ/m
3
or higher, the maximum
flame temperature of the gasified fuel exceeded that of methane, while the fuel calorific value
was as low as one-fifth of methane. Furthermore, each quantity of CO and H
2
constituent in
the gasified fuels differed, chiefly according to the gasification methods of gasifying agents,
raw materials of feedstock, and water-gas-shift reaction as an optional extra for carbon capture
system. However, it could be said that the theoretical adiabatic flame temperature was only a
little bit affected by the CO/H
2
molar ratio in the case of each fuel shown in Tables 1. That is to
say, in air-blown gasified fuels, fuel calorific values are so low that flame stabilization is a
problem confronting development of the combustor.
Developments of Gas Turbine Combustors for Air-Blown and Oxygen-Blown IGCC
243
BFG:Blast furnace gas, COG:Coke-oven gas, RDF:Refuse derived fuel, Waste:Municipal solid waste,
(a):No description, (b):Dry
base
Table 1. Various gasified fuels
Fig. 2. Relationship between equivalence ratio and adiabatic flame temperature for gasified
fuels and CH
4
.
On the other hand, in the case of oxygen-blown gasified fuels, flame temperature is so high
that thermal-NOx emissions must be reduced. Therefore, in oxygen-blown IGCC, N
2
produced by the air separation unit is used to recover power to increase the thermal
efficiency of the plant, and to reduce NOx emissions from the gas turbine combustor by
reducing the flame temperature. Furthermore, when hot/dry synthetic gas cleanup is
employed, ammonia contained in the gasified fuels is not removed, but converted into fuel-
NOx in the combustor. It is therefore necessary to reduce the fuel-NOx emissions in each
case of air-blown or oxygen-blown gasifiers.
Because fuel conditions vary depending on the gasification method, many subjects arose in
the development of the gasified fueled combustor. Table 2 summarizes the main subjects of
combustor development for each IGCC method.
Equivalence ratio
Advances in Gas Turbine Technology
244
Synthetic gas cleanup
Wet type Hot/Dry type
Gasification
agent
Air
・Combustion stability of
low-calorific fuel
・Combustion stability of low-
calorific fuel
・Reduction of fuel-NOx
O
2
・Surplus nitrogen supply
・Reduction of thermal-NOx
・Surplus nitrogen supply
・Reduction of thermal- and fuel-
NOx emissions
Table 2. Subjects for combustors of various gasified fuels
2. Test facilities and method for gasified fueled combustors
This chapter indicates a typical example of a test facility and method for a single-can
combustion test using simulated gasified fuels.
2.1 Test facilities
The schematic diagram of the test facilities is shown in Figure 3. The raw fuel obtained by
mixing CO
2
and steam with gaseous propane was decomposed to CO and H
2
inside the
fuel-reforming device. A hydrogen separation membrane was used to adjust the CO/H
2
molar ratio. N
2
was added to adjust the fuel calorific value to the prescribed calorie, and
then simulated gases derived from gasifiers were produced.
This facility had another nitrogen supply line, by which nitrogen was directly injected into
the combustor. Air supplied to the combustor was provided by using a four-stage
centrifugal compressor. Both fuel and air were supplied to the gas turbine combustor after
being heated separately with a preheater to the prescribed temperature.
Fuel
Reformer
H2 Separater
Max flow rate: 6.0 kg/s
Max pressure: 2.0 MPa
Temperature: 373~693K
Compressor
Max flow rate: 2.0 kg/s
Heating value: 2.5~11.0 MJ/m
CO/H
2
ratio: 1~3
Temperature: 373~773K
3
C
3
H
8
CO
2
Steam
N
2
NH
3
Heater
Atmospheric
Pressure
Combustion
Test Rig
High Pressure
Combustion
Test Rig
Heater
Stack
Fig. 3. Schematic diagram and specifications of test facility
The combustion test facility had two test rigs, each of which was capable of performing full-
scale atmospheric pressure combustion tests of a single-can for a “several”-hundreds MW-
class, multican-type combustor as well as half-scale high-pressure combustion tests, or full-
scale high-pressure tests for around a 100MW-class, multican-type combustor. Figure 4 shows
a cross-sectional view of the combustor test rig under pressurized conditions. After passing
Developments of Gas Turbine Combustors for Air-Blown and Oxygen-Blown IGCC
245
through the transition piece, the exhaust gas from the combustor was introduced into the
measuring section where gas components and temperatures were measured. An automatic gas
analyzer analyzed the components of the combustion gases. After that, the gas temperature
was lowered through a quenching pot, using a water spray injection system.
Igniter
Transition piece
Combustion
gas
Measurement duct
Liner
Swirler
Fuel
gas
Nitrogen
Air
Kerosene
Measurement position
of Air temperature
and pressure
Measurement position
of Exhaust temperature,
composition,
and pressure
Fig. 4. Combustion test rig
2.2 Measurement system
Exhaust gases were sampled from the exit of the combustor through water-cooled stainless
steel probes located on the centerline of a height-wise cross section of the measuring duct.
The sample lines of exhaust gases were thermally insulated with heat tape to maintain the
sampling system above the dew point of the exhaust gas. The exhaust gases were sampled
from at an area averaged points in the tail duct exit face and continuously introduced into
an emission console which measured CO, CO
2
, NO, NOx, O
2
, and hydrocarbons by the
same methods as the test device for basic studies using the small diffusion burner. The
medium-Btu simulated fuel were sampled from the fuel gas supply line at the inlet of
combustor, and constituents of CO, H
2
, CH
4
, H
2
O, CO
2
and N
2
were determined by gas
chromatography. Heating values of the simulated gaseous fuel were monitored by a
calorimeter and calculated from analytical data of gas components obtained from gas
chromatography.
The temperatures of the combustor liner walls were measured by sheathed type-K
thermocouples with a diameter of 1mm attached to the liner wall with a stainless foil
welding. The temperature distributions of the combustor exit gas were measured with an
array of three pyrometers, each of which consisted of five type-R thermocouples.
3. Gas turbine combustors for the gasified fuels
This chapter indicates the characteristics of the combustion technologies being applied to the
gasified fuels classified into four types in Table 2. Based on the knowledge through
experiments using a small diffusion burner and numerical analyses, prototype combustors
were constructed, tested and their performances were demonstrated.
Advances in Gas Turbine Technology
246
3.1 Combustor for air-blown gasification system with hot/dry type synthetic gas
cleanup
3.1.1 Design concept of combustor
Figure 5 shows the relation between the combustor exhaust temperature and the air
distribution in the gas turbine combustor using low-calorific gasified fuel. To calculate air
distribution, the overall amount of air is assumed to be 100 percent. The amount of air for
combustion is first calculated at 1.2 times of a theoretical air (φ=0.83), 30 percent of the total
air is considered as the cooling air for the combustor liner wall, and the remaining air is
considered as diluting air. According to this figure, as the gas turbine temperature rises up
to 1773K, the ratio of cooling and diluting air decrease significantly, and the flexibility of the
combustor design is minimized. To summarize these characteristics, it can be said that the
design concept of the gas tur-bine combustor utilizing low-calorific fuel should consider the
following issues when the gas turbine temperature rises:
Combustion stability; it is necessary to stabilize the flame of low-calorific fuel.
Low NOx emission technology to restrain the production of fuel NOx.
Cooling structure to cool the combustor wall efficiently with less amount of air.
Fig. 5. Air distribution design of a gas turbine combustor that burns low-Btu gasified fuel
・
Adoption of auxiliary combustor.
Reduction of Fuel-NOx
・
Residence time in the fuel-rich combustion zone
is set 1.5 times of the previous-type combustor.
・
Penetration of the secondary air is diluted to lower
the oxidation of ammonia intermediate in the fuel-
lean combustion zone.
High- Efficiency Cooling
・
Cooling air is distributed intensively in the first half of fuel-rich
combustion zone.
・
Using duplicate structure in the transition piece, cooling air for
inner transition piece is recycled for liner wall cooling.
Fuel-Lean Secondary
Combu
stion zone
Fuel-Rich Primary
Combustion zone
Fuel
Air
Combustion Stability
Fig. 6. Design concept of 1773K-class low-Btu fueled combustor
Developments of Gas Turbine Combustors for Air-Blown and Oxygen-Blown IGCC
247
Burner Combustion Liner
Fig. 7. Tested combustor
Figure 6 presents characteristics of the designed and tested 1773K-class combustor. Figure 7
illustrates the external view of the burner of the combustor. The main design concept of the
combustor was to secure stable combustion of a low-calorific fuel in a wide range of
turn-down operation, low NOx emission and enough cooling-air for the combustor liner.
The combustor is designed for advanced rich-lean combustion which is effective in
decreasing fuel NOx emissions resulting from fuel bound nitrogen.
3.1.1.1 Assurance of flame stabilization
In order to assure flame stability of low-calorific fuel, an auxiliary combustion chamber is
installed at the entrance of the combustor. The ratio of the fuel allocated to the auxiliary
combustion chamber is 15 percent of the total amount of fuel. The fuel and the combustion
air are injected into the chamber through a sub-swirler with a swirling angle of 30 degree.
By setting the stoichiometric condition in this chamber under rated load conditions, a stable
flame can be maintained. The rest of the fuel is introduced into the main combustion zone
from the surrounding of the exit of the auxiliary combustion chamber.
3.1.1.2 Fuel-NOx reduction
To restrict the production of fuel NOx that is attributable to NH
3
contained in the fuel, a
two-stage combustion method (rich-lean combustion method) is introduced. The tested
combustor has a two chamber structure, which separates the primary combustion zone from
the secondary combustion zone. In addition, the combustor has two main design
characteristics for reducing fuel NOx as indicated below:
3.1.1.2.1 Air to fuel ratio in primary combustion zone
The equivalence ratio of the primary combustor is determined setting at 1.6 based on the
combustion tests previously conducted using a small diffusion burner (Hasegawa et al.,
2001).
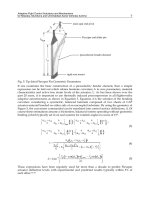
Figure 8 shows an outline of the experimental device of the small diffusion burner. The
combustion apparatus consists of a cylinder-style combustion chamber with an inner
diameter, 'D', of 90mm and a length of 1,000mm, and a primary air swirler and fuel injection
nozzle. The combustion chamber is lined with heat insulating material and the casing is
cooled with water. In order to simulate two-stage combustion, secondary air inlets at a
distance from the edge of the fuel injection nozzles of 3×'D' are used. The diameter of the
secondary air inlets at the entry to the combustion chamber is 13mm, and six inlets are
positioned on the perimeter of one cross-section. The tested burner consists of a fuel
injection nozzle and a primary air swirler. There are twelve injection inlets with a diameter
Advances in Gas Turbine Technology
248
of 1.5mm on the fuel injection nozzle with an injection angle, θ, of 90-degree. The primary
air swirler has an inner diameter of 24.0mm, an outer diameter of 36.4mm, and twelve vanes
with a swirl angle, θ
a
, of 45-degree. Swirl number, S, which is calculated from the following
equation, is 0.84.
a
B
S
B
3
2
21
tan
31
(1)
Where B (boss ratio of swirl vane)=0.66.
To Exhaust Duct
Secondary Air
D
Hot- Face
Insulati
on
Primary Air
Fuel
Fuel Nozzle
3
D
5
D
8
D
10.5
D
φ90
φ36.4
θ
Fuel
Air
Sampling Gas
to Analyzer
D : inner diameter of cylinder-style combustion chamber, 90mm
θ: injection angle of fuel nozzle, 90 degrees
Fig. 8. Combustion chamber and diffusion burner of basic experimental device
Figure 9 presents an example of the test results which indicates the influence of the
equivalence ratio of the primary combustion zone to the conversion rate of NH
3
to NOx,
C.R., at the exit of the secondary combustion zone. It also indicates the influence of the CH
4
concentration in the fuel.
CR
th
3
NOx NOx volume flow rate of exhaust
NH volume flow rate of fuel
(2)
To obtain the conversion rate of NH
3
to NOx, the concentration of thermal-NOx, '[NOxth]',
was first measured after stopping the supply of NH
3
, then the concentration of total NOx,
'[NOx]', was measured while NH
3
was supplied, and finally fuel-NOx was calculated by
deducting the concentration of thermal-NOx from that of total NOx. In the tests
investigating fuel-NOx emissions, 1000ppm of NH
3
is contained in the low-Btu fuel which
consists of CO, H
2
(CO/H
2
molar ratio of 2.33:1), and small amount of CH
4
. In the case of
changing CH
4
concentration, fuel calorific value was adjusted by N
2
dilution.
Developments of Gas Turbine Combustors for Air-Blown and Oxygen-Blown IGCC
249
0.0 0.5 1.0 1.5 2.0 2.5 3.0
φp
0
20
40
60
80
100
C.R. %
HHV=4.4MJ/m
NH
3
=1000ppm
T
air
=673K
T
fuel
=298K
φ
ex
=0.44
V
fuel
=32m/s
3
CH4 %
2.6
1.0
0.5
0
Fig. 9. Effect of methane content on conversion rate of ammonia in the fuel to NOx, defining
by the experiments using a small diffusion burner (Hasegawa et al., 2001)
From the test results, it is known that the conversion rate of NH
3
to NOx is affected by both
the equivalence ratio in the primary combustion zone using the two-staged combustion
method and CH
4
concentration. When the fuel contains CH
4
, HCN produced in the primary
combustion zone is easily converted to NOx in the secondary combustion zone along with
the decomposition of NH
3
. Therefore, there is a particular equivalence ratio, which
minimizes the NOx conversion rate. Since the low-calorific fuel derived from the IGCC
subject to development contained approximately 1.0 percent of CH
4
, the equivalence ratio in
the primary-combustion zone was set at 1.6. The fuel and the primary combustion-air are
injected from the burner, which has 30 degree swirl angle and 15 degree introvert angle.
3.1.1.2.2 Introduction method of secondary air
An innovative idea was applied for secondary air introduction. With the decomposition of
fuel N, a large portion of the total fixed nitrogen produced in the primary combustion zone,
including NO, HCN and NHi, is converted to NOx in the secondary combustion zone. The
influence of secondary air mixing conditions on the NOx production was examined from the
viewpoint of reaction kinetics with modular model where each combustion zone means a
perfect stirred reactor, neither the effect of diffusion nor that of radiant heat transfer of the
flame are taken into account. As a result, it was found that the slower mixing of the
secondary air made the conversion rate of NH
3
to NOx decline further (Hasegawa et al.,
1998a). Based on this result, an exterior wall was installed at the secondary-air inlet section
in the tested combustor to make an intermediate pressure zone of the dual structure. By
providing this dual structure, the flow speed of the secondary air introduced to the
combustor decreased to 70m/s, compared to 120m/s without an exterior wall, thus the
secondary air mixing was weakened.
3.1.1.2.3 Cooling of combustor liner wall
In order to compensate for the declined cooling air ratio associated with the higher
temperature of the gas turbine, the tested combustor is equipped with a dual-structure
transition piece so that the cooling air in the transition piece can be recycled to cool down
the combustor liner wall. The cooling air that flowed into the transition piece from the
exterior wall cools the interior wall with an impingement method, and moves to the
combustor liner at the upper streamside.
Advances in Gas Turbine Technology
250
For the auxiliary combustor and the primary combustion zone in which temperatures are
expected to be especially high, the layer-built cooling structure that combined impingement
cooling and film cooling was employed. For the secondary combustion zone, the film
cooling method was used.
In addition to the above design characteristics, the primary air inlet holes are removed in
order to maintain the given fuel-rich conditions in the primary combustion zone. Also, the
overall length of the combustor, including the auxiliary chamber, is 1317mm, and the inside
diameter is 356mm.
3.1.2 Test results
Combustion tests are conducted on under atmospheric pressure conditions. Concerning the
pressure influence on the performance of the combustor, a half scale combustor, which has
been developed by halving in dimension, was tested under pressurized conditions.
Supplied fuels into the combustor were adjusted as same components as that of air-blown
entrained-flow gasified coal fuel shown in Table 1. The standard rated conditions in the
combustion tests are summarized in Table 3. Combustion Intensity at the design point is
2.0×10
2
W/(m
3
•Pa).
T
air
T
fuel
T
ex
P
ex
Combustion Intensity
700K
633K
1773K
1.4MPa
0.62
2.0×10
2
W/(m
3
•Pa)
Table 3. Rated test conditions
3.1.2.1 Combustion emission characteristics
Figure 10 shows the combustion emission characteristics, under the gas turbine operational
conditions. When the gas turbine load was 25 percent or higher, which is the single fuel
firing of gasified fuel, the conversion rate of NH
3
to NOx was reduced as low as 40 percent
(NOx emissions corrected at 16 percent O
2
was 60ppm), while the combustion efficiency
shows around 100 percent in each gas turbine load.
0 20406080100
Gas turbine load %
0
20
40
60
80
100
C.R. %
99.5
99.6
99.7
99.8
99.9
100
η %
HHV=4.2MJ/m
CH
4
=1.0%
NH
3=1000ppm
3
Fig. 10. Combustion emission characteristics
Combustion efficiency %
Developments of Gas Turbine Combustors for Air-Blown and Oxygen-Blown IGCC
251
3.1.2.2 Thermal characteristics of combustor liner wall
Figure 11 shows the temperature distribution of the combustor liner wall at the rated load
condition. From this figure, it could be said that the overall liner wall temperature almost
remained under 1123K (850°C), the allowable heat resistant temperature, while the wall
temperature increased to an adequate level and a stable flame was maintained in both the
auxiliary-combustion chamber and the primary combustion zone.
0 100 200 300 400 500 600 700 800 900
Axial distance mm
500
600
700
800
900
1000
1100
1200
Liner wall temp. K
Tex=1773K
HHV=4.2MJ/m
3
Fig. 11. Combustor wall temperature distribution
3.2 Combustor for oxygen-blown gasification system with wet type synthetic gas
cleanup
3.2.1 Subjects of combustor
In the case of oxygen-blown IGCC, which has an air-separation unit to produce oxygen as
gasification agent, medium-Btu gasified fuels are produced compared with the case of the
air-blown gasified low-Btu fuels. That is, the maximum flame temperature of medium-Btu
fuel is higher than that of each low-Btu fuel or high-calorie gas such as natural gas. Thermal-
NOx emissions are expected to increase in the case of medium-Btu fueled combustors.
Furthermore, in the oxygen-blown IGCC system, large quantity of nitrogen is produced in
the air separation unit. In almost all of the systems, a part of nitrogen is used to feed raw
material such as coal into the gasifier and so on, gasified fuels are premixed with the rest of
the nitrogen and injected into the combustor to increase electric power and to decrease
thermal-NOx emissions from the gas turbine. It is necessary to return a large quantity of the
surplus nitrogen (as much as the fuel flow rate) to the cycle from the standpoint of
recovering power for oxygen production. So, we intend to inject the surplus nitrogen
directly into higher temperature regions from the burner and to decrease thermal-NOx
emissions produced from these regions effectively. Analyses confirmed that the thermal
efficiency of the plant improved by approximately 0.3 percent absolutely by means of
nitrogen direct injection into the combustor, compared with a case where nitrogen is
premixed with gasified fuel before injection into the combustor.
3.2.2 Design concept of combustor
Figure 12 presents characteristics of the designed, medium-Btu fueled 1573K (1300°C)-class
combustor based on the above considerations. The main design concept for the tested
Axial distance mm
Liner wall temperature K
Advances in Gas Turbine Technology
252
combustor was to secure a low-NOx and stable combustion of medium-Btu fuel with
nitrogen injection in a wide range of turn-down operations. The overall length of the
combustion liner is 650mm and the inside diameter is 230mm.
Fuel
N
2
Air
Combustion Stability
・
Using nitrogen-bypass function in low-
load condition, stable flame is maintained
near the burner.
Reduction of thermal-NOx
・
Adoption of nitrogen direct injection burner
・
Quick - diluting with air in the primary zo
ne
High - Efficiency Cooling
・
Adoption of combination of film cooling with impingement
for high temperature region
・
Using duplicate structure in the transition piece, cooling air
for inner transition piece is recycled for liner wall cooling.
:
Air
:
Fuel
:
N
2
Fig. 12. Design concepts of medium-Btu fueled combustor for wet-type synthetic gas
cleanup
According to the combustor cooling, a convection method was employed in the transition
piece, and moves to the combustor liner on the upstream side. For the primary combustion
zone where temperatures are expected to be especially high, the dual-cooling structure was
employed, in which the cooling air was impinged from the air flow guide sleeve to the
combustion liner and used as film cooling air for the combustion liner. For the secondary
combustion zone, the film-cooling method was used.
To restrict thermal-NOx production originating from nitrogen fixation and CO emissions,
the burner was designed with nitrogen injection function, based on combustion tests
previously conducted using a small diffusion burner (Hasegawa et al., 2001) and a small
model combustor (Hasegawa et al., 2003).
Figure 13 presents an example of the test results using the small diffusion burner shown in
figure 8, which indicate the influence of the primary equivalence ratio on NOx emission
characteristics in two-staged combustion for comparing three cases: 1) a fuel calorific value
(HHV) of 12.7MJ/m
3
, without nitrogen injection; 2) a fuel calorific value of 12.7MJ/m
3
,
where nitrogen is blended with the combustion air from the burner; 3) a fuel blended with
nitrogen of the same quantity as case 2), or low-Btu fuel of 5.1MJ/m
3
. From figure 13, we
know that nitrogen blended with fuel or air injected from the burner has a great influence
over decreasing NOx emissions from nitrogen fixation. On the other hand, not shown in
here, in the case where nitrogen blended with air was injected into the combustor, CO
emissions decreased as low as medium-Btu gasified fuel not blended with nitrogen, while
CO emissions significantly increased when fuel was blended with nitrogen. That is, in the
medium-Btu fuel combustion with nitrogen injection, all of the surplus nitrogen should be
injected into the primary combustion zone to reduce the thermal-NOx emissions and should
not be blended with fuel, or the primary zone should be fuel lean condition for a low NOx
and stable combustion in a wide range of turn-down operations.
Developments of Gas Turbine Combustors for Air-Blown and Oxygen-Blown IGCC
253
012345
φp
0
20
40
60
80
100
120
NOx ppm
N
2
supply
not supplied
blended with Air
blended with Fuel
Tex=1300℃
N
2/Fuel=2.1kg/kg
Tair=370
℃
Tfuel=360℃
Tex=1773K
HHV=12.7MJ/m
N
2/Fuel=2.1kg/kg
T
air
=503K
T
fuel
=503K
3
th
Fig. 13. Effect of nitrogen injection on thermal-NOx emission characteristics in two-stage
combustion, using a small diffusion burner
Figure 14 shows the combustion gas temperature distribution in the both cases of no
nitrogen injection and of nitrogen injection of 1.0kg/kg N
2
/Fuel from the burner under
atmospheric pressure condition, using a model combustor. In tests, the combustor outlet gas
temperature is set at 1373K. From figure 14, we know that nitrogen injection from the burner
has a great influence over decreasing hot regions by around 200K in this test conditions. So,
in this way of nitrogen injection, thermal-NOx production was restrained one fifth that of
the case no nitrogen injection.
0 30 60 90
0
50
100
150
200
250
300
1073
1273
1473
1673K
1
4
7
3
Axial Distance from Burner mm
Radial Distance mm
0 30 60 90
0
50
100
150
200
250
300
1273
1473
1673
1873K
1
0
7
3
1
6
7
3
Axial Distance from Burner mm
Radial Distance mm
Fuel:
Air
:
N
2
:
(1)No injection of nitrogen (2)Nitrogen injected
Fig. 14. Effect of nitrogen injection on combustion gas temperature distribution using a
model combustor
Based on these basic test results, we arranged the nitrogen injection intakes in the burner
and adopted the lean primary combustion, as shown in figure 12. The nitrogen injected
directly into a combustor has the effect of decreasing power to compress nitrogen, compared
with the case where the nitrogen was blended with fuel or air evenly. And it is possible to
control the mixing of fuel, air and nitrogen positively by way of nitrogen being injected
separately into the combustor. The nitrogen direct injection from the burner dilutes the
φp
Thermal NOx(16%O
2
) ppm