chế tạo vật liệu điện môi họ srtimo (m = fe, co, ni) và nghiên cứu một số tính chất của chúng bản tóm tắt tiếng anh
Bạn đang xem bản rút gọn của tài liệu. Xem và tải ngay bản đầy đủ của tài liệu tại đây (1.08 MB, 24 trang )
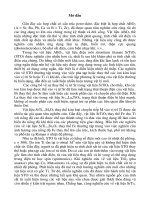
INTRODUCTION
In recent years, perovskite structure compounds, especially ABO
3
(A = Sr, Ba,
Pb, Ca and B = Ti, Zr) have been paid attention and researched popularly
because of their great applications in technology and practicality. ABO
3
materials have interesting characters, such as optical, ferroelectric and
piezoelectric responses and others. Therefore, these materials have been applied
to make capacitor, rheostat, photoelectrodes, ferroelectric storage, gas sensor.
In group of ABO
3
materials, one of the most researched materials is
dielectric Strontium titanate, SrTiO
3
(STO), especially after their ferroelectric
responses were investigated. Because of high dielectric constant, which
increases as freezing and has low short-wave loss, this material is applied in
devices with high frequency, short-wave, even at low temperature. There are
many researches on STO focusing on Ti or Sr doping or replacing with metal
ions to investigate the distortion of perfect cubic structure that causes
interesting physical phenomena.
In the report about doping Sr in SrTiO
3
, it was shown that replacing
metallic ions for Sr position caused the suppression of paraelectric state.
Substitution of Bi for Sr leads to the occurrence of several polarization modes
and phase transition to ferroelectric behavior. La doping in STO materials
strongly suppresses the paraelectric state, without the occurrence of intrinsic
polarization modes, except for polarization effects related to oxygen vacancies.
SrTiO
3
doped with transition metal M have been researched excitingly by many
authors. Recently, in application as sensor, Fe doped STO with high
concentration has been synthesized successfully and applied as transport
emission level. This material carries required stability and transport properties
at relatively high temperatures. Most investigation of Fe doped STO focus on
effects of Fe on structure, size of grains, impedance spectroscopy and Raman
spectra at room temperature.
As we know, STO is material with high dielectric constant (at room
temperature, ε = 300). Ti ion exists at 3d
0
state, so this material does not have
magnetic characters. Lately, ferroelectric properties of doped STO with
magnetic ions have been discovered and it is hoped that this response can be
applied in spintronics. When investigating Co substituted TiO
2 ,
Matsumoto et al
found ferromagnetic properties of the material at the room temperature, which
introduced new research approaches on oxide materials with Ti. Then, many
researches have been carried out with good results. However, the origin of
ferroelectric in these materials has not been explained thoroughly and there are
many opposite opinions. For example, with Co substituted STO, ferromagnetic
properties occur in bulk materials with high Co content, but does not occur in
thin film materials.
In many reports about groups of dielectric materials doped with
transitional metals M, structure, electric and magnetic properties, Raman
spectrum at room temperature have been focused on research, while optical
responses and Raman at low temperature have been hardly researched. There
have several studies on Raman scattering spectroscopy it low temperature but
do not systematic, specially on the effect of transitional metals Fe, Co, Ni on
electromagnetic responses and optical responses of SrTi
1-x
M
x
O
3.
STO materials doped with transition metal (Fe, Co, Ni) are not only
interesting and complicated research object on material science, but also
promising ones in application in Spin electronics, Diluted Magnetic
Semiconductor (DMS). Basing on practical situation and research condition
such as experimental devices, references, research ability and research groups
in Vietnam and abroad the following study and solutions to unsolved
problems are feasible and may give good results.
Therefore, we chose the topic of thesis: "Preparation of SrTi
1-x
M
x
O
3
(M
= Fe, Co, Ni) system and investigation some their properties"
The purpose of thesis is: (i) Preparation of SrTi
1-x
M
x
O
3
(M = Fe, Co, Ni)
systems by sol-gel and Pulsed Laser Deposition (PLD) method. (ii)
Investigating effects of substituted content on their structural, ferroelectric and
optical properties.
Research methods: Experimental method with data analysis was used to
investigate the effects of the substitution on the structure as well as properties of
materials. We used polycrystalline samples made by sol-gel and PLD methods
in the laboratory of Center for Nano Science and Technology, Hanoi National
University of Education. Structure morphology and components of samples
were examined by X-ray diffraction, Scanning Electron Microscopic (SEM),
Atomic Force Microscope (AFM) and Energy Dispersive Spectra (EDS).
Impedance measurement was performed by Le-Croy using Lab-View 8.0 in the
Center for Nano Science and Technology, Hanoi National University of
Education. Raman scattering spectroscopy measurement at low temperature
which used in Ewha University, Korea was carried out on spectrometer device
T6400, using activate laser of 514 nm in 10-300 K. Besides that, measurement
of magnetic, Raman scattering spectroscopy at room temperature, absorption
spectra were also performed by devices having high accuracy at various
laboratories in Vietnam. Exciting source of both Raman was Ar laser of 514
nm. Magnetic measurement was used by DMS 880 (Digital Measurement
System Inc), basing on rules of vibrating sample magnetometer with sensitivity
of 10
-5
emu at Material Science Center of University of Science Vietnam
National University. Absorption spectra of samples were measured on Jasco
670 UV at laboratory of Physics Department of Hanoi National University of
Education. Diagram of energy and density of state were calculated by Material
Studio.
The thesis includes: overview about perovskite Strontium titanate
(SrTiO
3
), experimental methods, results of researches on effects of Fe, Co, Ni
substitution on structure, electromagnetic and optical properties of SrTi
1-x
M
x
O
3
samples synthesized by Sol-gel and PLD method
Composition of the thesis: the thesis consists of 140 pages, including
introduction, 5 chapters of content, conclusion and references. The detailed
composition as follow:
Introduction
Chapter 1: Overview on SrTiO
3
materials
Chapter 2: Experimental methods
Chapter 3: The effects of Fe, Co, Ni substitution on structure of SrTi
1-x-
M
x
O
3
materials
Chapter 4: The effects of Fe, Co, Ni substitution on electromagnetic
properties of SrTi
1-x
M
x
O
3
materials
Chapter 5: The effects of Fe, Co, Ni substitution on optical properties of
SrTi
1-x
M
x
O
3
materials
Conclusion
References
The main results of the thesis were reported 5 articles on international
journals and 5 ones specific conferences.
Chapter 1
OVERVIEW ON SrTiO
3
MATERIALS
1.1. Crystal structure of SrTiO
3
materials
Strontium titanate SrTiO
3
(STO) is one of the important compounds in the
group of perovskite ABO
3
. At the room temperature, STO materials have cubic
structure, with crystal space of P
m3m
(
1
h
O ) and lattice constant of 3.905 Å.
Corner positions of cubic are Sr cations, center of 6 sites is oxygen anion,
center of the cubic is Ti cation. Ion Sr
2+
has coordination number of 12, radius
of r
Sr
+2
= 1.44 Å. Ion Ti
4+
has coordination number of 6, radius of r
Ti
+4
= 0.605
Å. Ion O
2-
has coordination number of 8, radius of r
O
−2
= 1.42 Å. Figure 1.1 is
perovskite at room temperature. At the low temperature, the materials show
phase transition from cubic structure
into tetragonal one of I
4/mcm
(105 K). In
the stoichiometric composition, ratio
Sr/Ti = 1, O/Sr = 3, STO is dielectric
with band gap energy of 3.2 eV. State
2p of oxygen predominates at peaks of
valence band and 3d state of Ti
predominates on conduction band. STO
show both covalent bond and ionic
bond. Hybridization between 2p state of
oxygen and 3d state of Ti presents
covalent bond and between ion Sr
2+
and
O
2-
presents ionic bond.
The important character of STO structure is existence of octahedral TiO
6
in basic cells. In the perfect state, octahedral TiO
6
has 90
o
angle and the length
of 6 bonds is 1.952 Å. The distance of ion O
2-
and ion Sr
2+
in each site of the
cubic is 2.769 Å. However, in the distortion state, depending on the chemical
component of materials, crystal structure is not the cubic, the bond distance is
not homogeneous and physical properties of the materials are also effected.
1.2. Properties of SrTiO
3
materials
1.2.1. Electromagnetic properties of SrTiO
3
materials
Dielectric properties of STO used to be
investigated by impedance spectroscopy
measurement. Impedance spectroscopy is
more general than impedance because it
includes phase shift between electric voltage
and current. Normally, vector quantity is
presented by relation
' "
Z( ) Z jZ
ω
= + , in which
Z’ is the real part and Z’’ is the imaginary
part.
On the complex plane, impedance
diagram is presented as figure 1.2 with:
'
Z Z cos( )
θ
= ,
"
Z Z sin( )
θ
= ,
''
1
'
Z
tan
Z
θ
−
=
,
1
'2 ''2
2
Z (Z Z )
= +
θ is the angle between impedance Z and the real part Z’.
Theoretically, dependence expression of the real and imaginary part is
semi-circle having center on the material axis. Practically, due to different
Sr
Ti
O
Figure 1.1. Perfect cubic
perovskite SrTiO
3
and arrangement
of octahedral TiO
6
.
.
Figure 1.2. components in
complex impedance Z
θ
Z
’’
Z
’
Z
0
Y
X
restoration time, the semicircle
can be distortion having center
under the material axis
X. Guo et al investigated
impedance spectroscopy of
single crystal and crystal of
STO. The result for single is 2
semicircles with the
contribution of grain and grain
boundary (figure 1.4a), for
crystal is 3 semicircles, in
which the one at high
frequency is contributed by
grain local, the one at the low
frequency is contributed by
electrodes, at the medium by
grain boundary. From the cross
point of these semicircles with
material axis, we can define
resistance of grain, grain
boundary and electrodes.
It is known that in the perovskite ABO
3
material at B sites are ions of
transition metal. Cations B with d orbit are the condition that magnetic moment
and magnetic order exist. For dielectric materials SrTiO
3
, ion Ti
4+
haven’t
electronic orbit d (d
o
), so there is not magnetic properties in the pure STO. The
magnetic properties occur only when replacing or doping metal ions for ion
Sr
2+
, Ti
4+
ion O
2-
.
1.2.2. Optical properties of SrTiO
3
materials
For the optical properties of SrTiO
3
materials, it was often focused on
Raman scattering spectroscopy. Theoretically, correlation method can be used
to calculate Raman and infrared active modes in STO crystal. The results show
that in this material, mode 3F
1u
is active infrared and F
2u
is inactive Raman and
infrared. Optical phonons were also investigated in many reports. Oscillation
modes which are typical of 1
st
Raman scattering are: TO
1
mode at around 90
cm
-1
, TO
2
-LO
1
band at around 170 cm
-1
, TO
3
-LO
2
mode is inactively optical
one (266 cm
-1
), mode TO
4
at 545 cm
-1
, LO
4
-A
2g
at 795 cm
-1
. Oscillation modes
for 2
nd
Raman scattering are between 200-400 and 600-800 cm
-1
. The Raman
-Z’’ (Ω)
Z’ (Ω)
Figure 1.4. Impedance spectroscopy
(a) of STO single crystal and (b) of
STO crystal at 773 K in Ar.
scattering spectroscopy at low temperature indicate that in STO, there appears
phase transition from cubic to tetragonal structure at 105-110 K.
For perovskite ABO
3
materials having B site with ions of transition metal
of d group, elements of d and oxygen define properties of materials. Basing on
estimation of energy band, it can be seen that orbital s, p of A have no influence
on width of covalent band ABO
3
.
From diagram of reduced energy of STO (figure 1.10) K. V. Benthem et.
al said that absorbing edge is in accordance with shift from 2p of oxygen and 4p
of Strontium to 3d of Titanium. At near Fermi level, there is hybridization of p
and d. 3d state affects the conduction band and 2p of oxygen in the valence
band. The width of band gap energy is around 3.2 eV, which means that 2p of
oxygen at peaks of valence band to 3d of Ti t
2g
and e
g
in conduction zone.
Bonding of Sr and TiO
6
is strong ionic bonding, while covalent bonding of Ti
and O is the result of 2p (O) and 3d (Ti).
1.3 The effects of substitution on the structure and properties of SrTiO
3
1.3.1. The substitution at site A
1.3.2. The substitution at site B
1.4. Chemical defects of SrTiO
3
in replacing donor and acceptor
1.4.1. Chemical defects
1.4.2. Defect chemistry of donor doped SrTiO
3
.
1.4.3. Defect chemistry of undoped and acceptor doped SrTiO
3
Figure 1.10. Schematic
energy level for STO
Figure 1.11. Density of
state of STO
1.5. Effect of processing parameters on the microstructural and electrical
properties of the STO crystal
1.5.1. Stoichiometric and nonstoichiometric composition of STO
1.5.2. Sintering temperature
1.5.3. Partial pressure during sintering
Chapter 2
EXPERIMENTAL METHODS
2.1. Method of synthesized samples
In this thesis, we have synthesized the following systems and investigated
their structure, electromagnetic, optical and properties of these following
systems:
Systems was synthesized by sol-gel method SrTi
1-x
M
x
O
3
(x = 0.0; 0.1;
0.2; 0.3; 0.4 and 0.5), including SrTi
1-x
Fe
x
O
3
, SrTi
1-x
Co
x
O
3
, SrTi
1-x
Ni
x
O
3
.
Systems SrTi
1-x
M
x
O
3
films
was synthesized by PLD with different
contents, including SrTi
1-x
Fe
x
O
3
films (x = 0.0; 0.1; 0.2), SrTi
1-x
Co
x
O
3
films (x
= 0.0; 0.1; 0.2; 0.3; 0.4), SrTi
1-x
Ni
x
O
3
films (x = 0.0; 0.1; 0.2; 0.3).
2.1.1. Preparation of targets by solid phase reaction
2.1.2. Preparation of samples by sol-gel method
2.1.3. Preparation of samples by PLD method
2.2. Analysis of structure and components of samples
2.2.1. X-ray diffraction method (XRD)
2.2.2. Technique of scanning electron microscopic (SEM)
2.2.3. Atomic force microscope (AFM)
2.2.4. Analysis of component by energy dispersive spectra (EDS)
2.3. Impedance spectroscopy measurement
2.4. Magnetic measurement
2.5. Raman scattering spectroscopy measurement
2.6. Absorption spectra measurement
Chapter 3
THE EFEECT OF TRANSITION METAL M (Fe, Co, Ni)
SUBSTITUTION ON STRUSTURE OF SrTi
1-x
M
x
O
3
MATERIALS
3.1. The effects of transition metal M on structure of SrTi
1-x
M
x
O
3
synthesized by sol-gel method
3.1.1. Diagram of X-ray diffraction of SrTi
1-x
M
x
O
3
samples
Results of investigation structure of SrTi
1-x
M
x
O
3
by X-Ray diffraction are
presented in figure 3.1
On diagram of 3 systems samples, we see that diffraction peaks occurring
at angles of about 32, 40, 46, 52, 57, 68
o
. By comparing the diagram of X-ray
diffraction pattern of pure sample with x = 0.0 with standard JCPDS 35-374
code, these peaks are in accordance with group of planes: (100), (110), (111),
(200), (210), (211) và (220).
Figure 3.1a presents
diagram of X-ray diffraction of
SrTi
1-x
Fe
x
O
3
samples. When Fe
content increases, diffraction lines
change. For example, peaks of 2 -
theta at 22 and 52
o
disappear
when substituted content reaches
to x = 0.2. Especially, position of
diffraction peaks shifts
considerably when Fe content
increases. The reason for shift
may be related to the doped of Fe
in Ti
4+
in lattice cells. It was
known that, in octahedral, ionic
radius of Sr
2+
and Ti
4+
are 1.44 Å
and 0.605 Å successively. Ion Fe
with different oxidation state has
different ionic radius. In this
thesis, our result indicates that
lattice constant of SrTi
1-x
Fe
x
O
3
decreases when Fe content
increases. Therefore, it is
estimated that Fe
3+
(LS) or ion
Fe
4+
having smaller ionic radius
substituted for ion Ti
4+
in lattice
cells, leading to decrease of lattice
constant. With these Fe content
and heating temperature, with x =
0.2; 0.3; 0.4; 0.5, on diagram,
peaks correlating with 2θ of 27.3
o
occur and they are TiO
2
peaks of Rutile,
with space group of P
4m/mmm
. In order to limit Rutile, in careation of samples,
we can replece Ti(OC
3
H
7
)
4
with crude Ti, because when Ti(OC
3
H
7
)
4
is diluted
in water, amorphous phase TiO
2
often occurs.
Figure 3.1.
X-ray diffraction diagram of
SrTi
1-x
M
x
O
3
synthesized
by sol-gel method:
(a) SrTi
1-x
Fe
x
O
3
, (b): SrTi
1-x
Co
x
O
3
, (c): SrTi
1-
x
Ni
x
O
3
. Symbols presents: TiO
2
(*), TiO (
♥
),
Ti
3
O
5
(
♦
), Ni (
♠
).
2
θ
(degree)
Intensity(arb.units)
(210)
(100)
(110)
(111)
(200)
(211)
(220)
0,0
0,1
0,2
0,3
0,4
0,5
(b): SrTi
1-x
Co
x
O
3
20 30 40 50 60 70
♥
♥
∗
♠
♠
♠
♦
∗
♦
♥
(c): SrTi
1-x
Ni
x
O
3
0,5
0,4
0,3
0,2
0,1
0,0
(220)
(210)
(211)
(200)
(111)
(110)
(100)
(a): SrTi
1-x
Fe
x
O
3
(220)
(210)
(211)
(200)
(111)
(110)
(100)
∗
0,5
0,4
0,3
0,2
0,1
0,0
Figure 3.1b present diagram of X-ray diffraction of SrTi
1-x
Co
x
O
3
samples
by sol-gel method method. The peaks shift at right low Co content (x = 0.1; 0.2)
and expand when Co content rises (x = 0.3; 0.4; 0.5). Especially, at angle of
lager 2θ, diffraction peaks expand and unbalance. Therefore, it is estimated that
when Co content is higher, structural phase can be changed. The results of
lattice constants of SrTi
1-x
Co
x
O
3
indicate the value decreases when Co content
increases. We know that ion Co can exist in many states of oxygen such as:
Co
2+
, Co
3+
, Co
4+
with different ionic radius. Maybe ion Co
4+
or Co
3+
(LS) with
smaller ionic radius than Ti
4+
substituted for ion Ti
4+
in crystal cells, which
causes decrease in cell's size and lattice constant when Co content changes.
Figure 3.1c present diagram of X-ray diffraction of SrTi
1-x
Ni
x
O
3
samples,
which shows that when substitute Ni content is low, (x = 0.1), the sample is
pure and has suitable structure with pure STO. When Ni content increases to x
= 0.2 and x = 0.3, contaminant phase TiO occurs (*). If Co content increases to
x = 0.4 and x = 0.5, other phases such as Ti
3
O
5
(♦), TiO
2
(♥), Ni (♠) occur.
Besides that, intensity of diffraction line also decreases and diffraction peaks
shift to lager 2θ. Therefore, lattice constant and size of lattice cell decrease. The
reason for peak shifting and constant changing may be related to substitution
ion Ni for Ti
4+
in lattice cells.
According to experimental condition, in substitution ion Ni
2+
for Ti
4+
in
SrTi
1-x
Ni
x
O
3
, if Ni
2+
has radius of 0.69 Å, size of cell and lattice constant will
increase. We know that, like Fe and Co, ion Ni can exist in many oxidation
states. In octahedral crystal, with coordination number of 6, ion Ni
3+
(HS) has
radius of 0.6 Å, Ni
3+
(LS) of 0.56 Å and ion Ni
4+
only exist in HS with radius
of 0.48 Å. It means that in doped with Ni in lattice cells, oxidation states of
Ni
3+
và Ni
4+
predominate.
3.1.2. SEM images of SrTi
1-x
M
x
O
3
synthesized by sol-gel method
SEM images of SrTi
1-x
Fe
x
O
3
samples show that grain size of Fe
substituted samples is relative homogeneous and suitable to grain size of pure
STO when Fe content increases to x = 0.3. When Fe content increases to x =
0.4; 0.5, grain size decreases to about 10-20 nm. SEM images of SrTi
1-x
Co
x
O
3
indicate that when Co content reaches to x ≥ 0.2, grain size decreases to 10-20
nm. For SrTi
1-x
Ni
x
O
3
samples, even when Ni content Ni reaches to x ≥ 0.1 grain
size decreases considerably to only 10 nm.
We see that size of crystal grain calculated by formula of Debye-Scherer
is bigger than estimated size from SEM images. The reason is that in
calcinations at high temperature, grains accumulate which lead to increase in
size.
3.1.3. Measurement results of energy dispersive spectra (EDS) of SrTi
1-
x
Fe
x
O
3
samples synthesized by sol-gel method method.
Figure 3.6 presents EDS of SrTi
1-x
Fe
x
O
3
samples. Figure 3.6a shows that
only peaks which correspond with Sr, Ti, O occur. When substituting Fe for a
part of Ti, we see EDS of samples as on figure 3.2 (b-g). Besides, spectrum line
of Fe also occurs at different energy level. When Fe content is of x = 0.1; 0.2,
spectrum lines which are typical of Fe occur at about 0.7 and 6.2 keV. When Fe
content is of x = 0.3; 0.4; 0.5, there is also another spectrum line at around 7.1
keV. In substitution Fe, intensity of spectrum peaks of Ti tend to decrease
gradually and spectrum peaks of Fe tend to increase. This result is suitable to
initial estimation, because when Fe content increases gradually, (from 0 to
50%), Ti content decreases ( between 100 and 50%).
3.2. Effects of transition metal ions M on structure of SrTi
1-x
M
x
O
3
material
synthesized by PLD method
3.2.1. Diagram of X-ray diffraction of SrTi
1-x
M
x
O
3
samples synthesized by
PLD method
Figure 3.7 present diagram of X-ray diffraction of SrTi
1-x
M
x
O
3
samples
synthesized by PLD. Like SrTi
1-x
M
x
O
3
samples synthesized by sol-gel method,
structure of this samples are cubic of P
m3m
. On the diagram, diffraction peaks of
pure STO film have high intensity at 2θ of about 22, 32, 40, 50
o
which
correspond with Muller index (100), (110), (111), (210). When substitute
element and its content is different, intensity as well as diffraction peaks also
change. Figure 3.7 show the XRD of Fe doped STO samples. Diagram presents
x = 0.0
0.1 Fe
0.2 Fe
0.3 Fe
0.4 Fe
0.5 Fe
Figure 3.3. SEM images of SrTi
1-x
Fe
x
O
3
samples synthesized by sol-gel method
diffraction lines correspond with 2θ of 22 and 32
o
. When Co substitutes in
STO, in the diagram, diffraction lines correspond with 2θ of 22 and 40
o
, and for
Ni, they are 2θ of 22 and 52
o
. Besides that, position of diffraction peaks shifts
considerably to large 2θ when substitute content increases. The reason for peak
shifting (change in lattice constant) may be related to ions' substitution of Fe,
Co, Ni in Ti
4+
of cells. Constant decreases sharply in accordance with content
of ion M, which indicates that ion Fe
3+
(LS) replaced Ti
4+
in SrTi
1-x
Fe
x
O
3
films,
ion Co
4+
or Co
3+
(LS) replaced ion Ti
4+
in SrTi
1-x
Co
x
O
3
films, ion Ni
4+
or Ni
3+
(LS) replaced ion Ti
4+
in SrTi
1-x
Ni
x
O
3
films.
Figure 3.6. Energy dispersive spectra of SrTi
1-x
Fe
x
O
3
samples
(x = 0.0 ÷ 0.5) synthesized by sol-gel method.
Fe
Sr
Sr
Ti
Fe
Fe
Ti
O
0
2
4
6
8
10
(d): SrTi
0.7
Fe
0.3
O
3
Ti
0
2
4
6
8
10
Fe
Sr
Sr
Ti
Ti
Fe
Fe
Ti
O
(e): SrTi
0.6
Fe
0.4
O
3
0
2
4
6
8
10
Fe
Sr
Sr
Ti
Ti
Fe
Fe
Ti
O
(g): SrTi
0.5
Fe
0.5
O
3
0 2
4
6 8 10
O
Ti
Ti
Sr
Sr
Ti
(a): SrTiO
3
0 2 4 6 8 10
O
Fe
Sr
Sr
Ti
Ti
Ti
Fe
(b): SrTi
0.9
Fe
0.1
O
3
O
Fe
Sr
Sr
Ti
Ti
Ti
Fe
0
2
4 6 8 10
(c): SrTi
0.8
Fe
0.2
O
3
Fe
Intensity (arb. units.)
Energy (keV)
3.2.2. Atomic Force Microscope (AFM) of SrTi
1-x
Fe
x
O
3
films synthesized by
PLD method.
From AFM of SrTi
1-
x
Fe
x
O
3
films (x = 0 ÷ 0.3), we
can observe surface
morphology and estimate grain
size. Results indicate that
lattice models accumulating on
layer Si (100) have averagely
small width of 0.10 µm.
3.3. Comparison and
discussion structure of SrTi
1-
x
M
x
O
3
samples.
After investigating
structure of two SrTi
1-x
M
x
O
3
systems synthesized by sol-gel
and PLD method, we have
some following comments:
For both samples, lattice
constant decreases according
to substitute content, which
means that ions of transition
metal such as Fe, Co, Ni at
different oxidation states
replaced in ion Ti
4+
in cells.
In the diagram of X-ray
diffraction of SrTi
1-x
M
x
O
3
samples, all diffraction peaks
that are typical of STO occur,
and in diagram of SrTi
1-x
M
x
O
3
films, only some peaks occur.
The reason for this
phenomenon is that when we
irradiate X-ray on SrTi
1-x
M
x
O
3
samples, X-ray will diffract to
all directions, and on SrTi
1-
x
M
x
O
3
films, X-ray diffract to
1 priority direction- direction of layer.
20 30 40 50 60
(c): Films SrTi
1-x
Ni
x
O
3
0.3
∗
(111)
(210)
(110)
(100)
0.2
0.1
0.0
(b): Films SrTi
1-x
Co
x
O
3
(111)
∗
(110)
(100)
0.2
0.1
0.0
0.4
0.3
(a): Films SrTi
1-x
Fe
x
O
3
(111)
(210)
(110)
(100)
∗
0,2
0,1
0,0
2θ (degree)
Intensity (arb. units)
Figure 3.7. Diagram of X-ray diffraction
of SrTi
1-x
M
x
O
3
films synthesized by PLD:
(a) SrTi
1-x
M
x
O
3
films, (b) SrTi
1-x
M
x
O
3
films, (c) SrTi
1-x
M
x
O
3
films. Symbol (*)
presents doped TiO
2
.
With SrTi
1-x
M
x
O
3
samples synthesized by sol-gel method, diluted content
limitation of substitute ions is different. In detail, diluted limit of Fe and Ni is
lower than 20 %. While diluted limit of Co is very high, reaching to 30%.
With SrTi
1-x
M
x
O
3
films, although diffraction peaks are a few, we still gain
pure samples in substitute limitation.
Chapter 4
THE EFFECTS OF TRANSITION METAL IONS M (Fe, Co, Ni) ON
ELECTROMAGNETICS PROPERTIES OF SrTi
1-x
M
x
O
3
MATERIALS
4.1. The effects of transition metal ions M on electronic properties on SrTi
1-
x
M
x
O
3
synthesized by sol-gel method
4.1.1. The effects of Fe doped on electronic properties of SrTi
1-x
Fe
x
O
3
synthesized by sol-gel method
Figure 4.1 presents impedance spectroscopy of SrTi
1-x
Fe
x
O
3
samples (x =
0.0 ÷ 0.5), from which we define resistance value of grain local, grain boundary,
contact electrode, maximum frequency of semicircle by using formula
10 20 30 40 50
0
5
10
15
Z' (k
Ω
)
- Z'' (k
Ω
)
(e): SrTi
0.6
Fe
0.4
O
3
Data
Fit
15 20 25 30 35 40
0
3
6
9
(g): SrTi
0.5
Fe
0.5
O
3
Data
Fit
Z' (k
Ω
)
- Z'' (k
Ω
)
50 100 150 200
0
15
30
45
Z' (k
Ω
)
Data
Fit
(d): SrTi
0.7
Fe
0.3
O
3
- Z'' (k
Ω
)
0 1 2 3
0.0
0.2
0.4
0.6
0.8
(c): SrTi
0.8
Fe
0.2
O
3
- Z'' (M
Ω
)
Data
Fit
Z' (M
Ω
)
0 10 20 30 40 50
0
5
10
15
Data
Fit
- Z'' (M
Ω
)
Z' (
ΜΩ
)
(b): SrTi
0.9
Fe
0.1
O
3
0 2 4 6 8 10
0
1
2
3
Data
Fit
- Z'' (M
Ω
)
Z' (M
Ω
)
(a): Sample x = 0.0
Figure 4.1. Impedance spectroscopy of SrTi
1-x
Fe
x
O
3
samples
(x = 0.0 ÷ 0.5) synthesized by sol-gel method
1
max
=RC
ω
. In general, resistance value decreases when Fe content increases.
When Fe replaces with Ti in cells, conductive responses of SrTi
1-x
Fe
x
O
3
increase, and dielectric properties decrease. On diagram figure 4.1 (a, b), there is
a semicircle going through origin, which indicates that grain have contribution
to impedance spectroscopy. In diagram 4.1 (e, g), the semicircle does not go
through the origin, which means that grain boundary affect impedance
spectroscopy. In diagram 4.1, there is no 3
rd
semicircle, which shows the effect
of electrode impedance. In measuring limit, we can not measure electrode
impedance under 10 Hz.
4.1.2. The effects of ion Co on electric properties of SrTi
1-x
Co
x
O
3
materials
synthesized by sol-gel method.
In experimental condition and limitation of frequency range of 10 Hz –
5.3 MHz, for Co doped STO, we only define impedance value of pure STO and
Co doped samples with content of x = 0.1; 0.3. From experimental data, we can
not draw semicircles with Co content of x = 0.2; 0.4; 0.5. Therefore, resistance
and capacitor value of grain local, boundary grain, electrodes also have been
defined yet. According to impedance diagram of samples SrTi
1-x
Co
x
O
3
, for Co
substituted samples, impedance spectroscopy is a semicircle without going
through origin O. It means that impedance value is contributed mainly by grain
boundary
4.1.3. The effects of ion Ni on electric properties of SrTi
1-x
Ni
x
O
3
materials
synthesized by sol-gel method
The diagram of Ni doped SrTi
1-x
Co
x
O
3
shows that impedance
spectroscopy of pure STO and Ni doped samples with content of (x = 0.1; 0.2) is
semicircles going through origin O. Grain local have contribution to this value.
When Ni content reaches to x = 0.4 and 0.5, impedance spectroscopy is 2
semicircles not going through origin. Therefore, grain and boundary have
influence on the value. With highest Ni content, (x = 0.5), there is a semicircle
not going through the origin, and grain local contributes mainly to the value.
4.2. The effects of transition metal ions M on electronic properties on SrTi
1-
x
M
x
O
3
synthesized by PLD
4.2.1. The effects of Fe on electronic properties of SrTi
1-x
Fe
x
O
3
synthesized
by PLD method
According to figure 4.4. impedance is a semicircle not going through
origin, which means that grain boundary contribute mainly to the value. From
experimental data and semicircle, we can define maximum frequency,
resistance value of grain local and boundary, capacitance value.
4.2.2. The effects of ion Co on electric properties of materials SrTi
1-x
Co
x
O
3
synthesized by PLD method.
Results impedance spectroscopy of SrTi
1-x
Co
x
O
3
(with x = 0.0 ÷ 0.4)
synthesized by PLD show that, impedance spectroscopy of SrTi
1-x
Co
x
O
3
is
semicircles not going through origin O, so grain boundary contribute mainly to
the impedance value.
4.2.3. The effects of ion Ni on electric properties of SrTi
1-x
Ni
x
O
3
materials
synthesized by PLD method
Like SrTi
1-x
Fe
x
O
3
and SrTi
1-x
Co
x
O
3
films, impedance spectroscopy of
SrTi
1-x
Ni
x
O
3
films is semicircles not going through origin O, so grain boundary
contributes mainly to the impedance value.
4.3. Discussion of impedance spectroscopy of SrTi
1-x
M
x
O
3
samples
synthesized by sol-gel and PLD method
The basic difference of two samples is that impedance of SrTi
1-x
M
x
O
3
powder is contributed by grain, grain boundary and electrodes, while
impedance of SrTi
1-x
M
x
O
3
samples
are mostly contributed by grain boundary.
Resistance of SrTi
1-x
Fe
x
O
3
, SrTi
1-x
Co
x
O
3
synthesized by sol-gel decreases
when doped Fe and Co concentration increases, while resistance of grain
boundary of SrTi
1-x
Fe
x
O
3
increases when Fe concentration. For other samples
(SrTi
1-x
Ni
x
O
3
,
SrTi
1-x
Co
x
O
3
, SrTi
1-x
Ni
x
O
3
) resistance does not depend on the
concentration of doping ions.
4.4. Effect of doping transition metals M on magnetic responses of SrTi
1-
x
M
x
O
3
samples synthesized by sol-gel and PLD
4 8 12
0
2
4
Data
Fit
Z' (k
Ω
)
- Z'' (k
Ω
)
(b): 0.1 Fe
0 5 10 15 20
0
4
8
Data
Fit
Z' (k
Ω
)
- Z'' (k
Ω
)
(c): 0.2 Fe
0 4 8 12
2
4
- Z'' (k
Ω
)
Z' (k
Ω
)
Data
Fit
(a): x = 0.0
Figure 4.4. Impedance
spectroscopy of SrTi
1-x
Fe
x
O
3
films (x = 0.0 ÷ 0.5) synthesized
by PLD
4.4.1. The effects of transition metal ions M on magnetic properties on
SrTi
1-x
M
x
O
3
synthesized by sol-gel method
Figure 4.9 show that pure STO
and 10% doped sample (x = 0.1)
present both diamagnetic and
ferromagnetic. When Co and Fe
content increases, magnetic
properties increase, but have not
been saturated. This means that
electromagnetic field H = 13500 Oe
is not big enough to define all
domains. For SrTi
1-x
Ni
x
O
3
, the
saturated value increases in
accordance with Ni content.
As we know, STO is
diamagnetic, but for sample with x =
0.0, both ferroelectric and
diamagnetic are shown. The reason
for ferroelectric may be heating at
high temperature that causes oxygen
vacancy and Ti
4+
→ Ti
3+
. In
octahedral, 3d of Ti
3+
is 3d
1
which
has 1 electron, so double exchange
interaction of Ti
3+
- O
2-
- Ti
4+
occur
that cause magnetic properties.
When M content increases, there is
super exchange among Ti
4+
- O
2-
-
M
n+
that cause magnetic responses.
Besides, accumulation of oxides of
Fe in SrTi
1-x
Fe
x
O
3
, existence of Ti
(Ti
3
O
5
, TiO
2
) and Ni in SrTi
1-x
Ni
x
O
3
also cause magnetic responses. For SrTi
1-x
Co
x
O
3
, the reason for magnetic
properties are doped Co. Fe, Co, Ni exist in different oxidation states, they
cause different properties.
4.4.2. The effects of transition metal ions M on magnetic properties on
SrTi
1-x
M
x
O
3
films synthesized by PLD method
Figure 4.11 is magnetic hysteretic loop of Fe doped samples SrTi
1-x
Fe
x
O
3
(x = 0.0; 0.1; 0.2). Both pure SrTiO
3
and Fe doped samples show ferroelectric
Figure 4.9. Magnetic curve of SrTi
1-
x
M
x
O
3
sample synthesize by sol-gel
method. (a) SrTi
1-x
Fe
x
O
3
samples,
(b) SrTi
1-x
Co
x
O
3
samples, (c) SrTi
1-x-
Ni
x
O
3
samples ( x = 0.0 ÷ 0.5).
-10000 -5000 0 5000 10000
-0.08
-0.04
0.00
0.04
0.08
(b): SrTi
1-x
Co
x
O
3
0,0
0,1
0,2
0,5
0,3
0,4
-10000 -5000 0 5000 10000
-0.8
-0.4
0.0
0.4
0.8
(c): SrTi
1-x
Ni
x
O
3
0,0
0,1
0,2
0,3
0,4
0,5
-0.4
-0.2
0.0
0.2
0.4
-10000 -5000 0 5000 10000
0,0
0,1
0,2
0,3
0,4
0,5
(a): SrTi
1-x
Fe
x
O
3
M (emu/g)
H (Oe)
and diamagnetic. Magnetism curve in
figure 4.11 presents: (1) general
magnetism curve, (2) diamagnetic
line, (3) ferroelectric line. Similarly,
for SrTi
1-x
Co
x
O
3
samples
(x = 0.0 ÷
0.4) and SrTi
1-x
Ni
x
O
3
samples (x = 0.1;
0.2; 0.3) also have diamagnetic and
ferroelectric properties.
4.5. Discussion of magnetic
responses of SrTi
1-x
M
x
O
3
samples
synthesized by sol-gel và PLD
method
Pure SrTiO
3
synthesized by sol-
gel or PLD method show both
diamagnetic and ferromagnetism.
When Fe, Co, Ni content is
small (10%), diamagnetic and
ferroelectric exist in all samples of
SrTi
1-x
M
x
O
3
. When the content
reaches to 20 %, samples Sol-gel have
ferromagnetism, and samples by PLD
show both ferromagnetism and
diamagnetism.
As we know, pure STO is
dielectric, so it does not have
magnetism at normal condition. However, by doping transitional metal for Ti,
this material have complicated responses. Many results focused on researching
magnetic responses of STO doped Fe, Co. A. Sendil Kumar et. al investigated
magnetic responses of SrTi
1-x
Fe
x
O
3-δ
(x = 0,2; 0,3; 0,5; 0,7; 0,9). The diagram
M (T) indicates that when concentration of Fe was small (20%), the materials
have antiferromagnetic responses and temperature Neel T
N
increased with Fe
concentration.
S. Srinath et. al synthesized SrFe
x
Ti
1-x
O
3-δ
(x = 0.7; 0.9; 1.0) by solid
phase reaction at 1200
o
C of sintering (STF70), 1300
o
C (STF90), 1400
o
C
(STF100). The results were examined by measurement of M (H), M (T) and
χ(T) which shown the ferromagnetic responses. Reason for formation of
magnetic responses is due to interaction between Fe
4+
(HS)-O- Fe
4+
(LS) and
Fe
4+
(HS)-O- Fe
3+
(LS). As we know, in materials having perovskite, for
-10000 -5000 0 5000 10000
-6.0x10
-4
-3.0x10
-4
0.0
3.0x10
-4
6.0x10
-4
(c): Film x = 0.2 Fe
(3)
(2)
(1)
-10000 -5000 0 5000 10000
-5.0x10
-4
0.0
5.0x10
-4
(b): Film x= 0.1 Fe
(3)
(2)
(1)
-10000 -5000 0 5000 10000
-6.0x10
-4
-3.0x10
-4
0.0
3.0x10
-4
6.0x10
-4
(3)
(2)
(a): Film x = 0.0
(1)
M (emu/g)
H (Oe)
Figure 4.11. Magnetism curve of
SrTi
1-x
Fe
x
O
3
films by PLD
method
(with x = 0.0; 0.1,
0.2).
example, CaFeO
3
, ion Fe
4+
changes from HS in to LS, depending on pressure
condition and temperature.
When investigating magnetic susceptibility, χ or (1/χ) depending on
temperature, C. Pascanut et. al also received the similar result with that of
research.
Chapter 5
THE EFFECTS OF TRANSITION METALS M (Fe, Co, Ni) ON
OPTICAL PROPERTIES OF SrTi
1-x
M
x
O
3
MATERIALS
5.1. The effects of M doped on Raman
scattering spectroscopy of SrTi
1-x
M
x
O
3
synthesized by sol-gel method
Raman scattering spectroscopy of
samples SrTi
1-x
M
x
O
3
(M = Fe, Co, Ni) at
room temperature in figure 5.1. In pure
STO sample, optical phonons are
activate, strong peak is at 170 cm
-1
of
band TO
2
-LO
1
, weak peak at 234 cm
-1
with B
2g
, wide peak at 334 cm
-1
of band
TO
3
-LO
2
, peak at 545 cm
-1
is in
accordance with mode TO
4
, and
asymmetrical peak at 791 cm
-1
is of LO
4
-
A
2g
oscillation. In figure 5.1, Raman
scattering spectroscopy of Fe, Co, Ni
doped samples is different from those of
pure STO sample. When Fe, Co content
increase (figure 5.1a, b), spectrum peaks
of STO decrease and nearly disappear.
Raman scattering spectroscopy of SrTi
1-
x
M
x
O
3
have strong peak at approximately
700 cm
-1
. Change in oscillation and
occurrence of new peaks can be related to
distortion of octahedral TiO
6
. In
substitution M for Ti, radius difference
causes bonding energy and length among
ions in cells. Therefore, oscillation lines
on Raman scattering spectroscopy
change. This result is suitable to that
250 500 750
(c): SrTi
1-x
Ni
x
O
3
0.5
0.4
0.3
0.2
0.1
0.0
B
2g
TO
3
-LO
2
TO
4
LO
4
, A
2g
200 400 600 800 1000
0.5
0.4
0.3
0.2
0.1
0.0
B
2g
TO
2
,
LO
1
TO
3
-LO
2
TO
4
LO
4
, A
2g
(b): SrTi
1-x
Co
x
O
3
200 400 600 800 1000
B
2g
0.5
TO
2
,
LO
1
TO
3
-LO
2
TO
4
LO
4
, A
2g
(a): SrTi
1-x
Fe
x
O
3
0.4
0.3
0.2
0.1
0.0
Raman shift (cm
-1
)
Intensity (arb. units)
Figure 5.1. Raman scattering
spectroscopy of SrTi
1-x
M
x
O
3
samples at room temperature with x
= 0.0 ÷ 0.5. (a) SrTi
1-x
Fe
x
O
3
samples, (b) SrTi
1-x
Co
x
O
3
samples,
(c)
SrTi
1
-
x
Ni
x
O
3
samples
.
gained by analysis of X-ray diffraction when lattice constant changes of SrTi
1-
x
M
x
O
3
. This indicated string connection between crystal structure and Raman
scattering spectroscopy in materials.
5.2. The effect of ion M on Raman scattering spectroscopy of SrTi
1-x
M
x
O
3
synthesized by sol-gel method at low temperature
Raman scattering spectroscopy of STO at low temperature shows 1
st
scattering peaks with high intensity, in accordance with oscillation of TO
4
(545
cm
-1
) and LO
4
-A
2g
(791 cm
-1
). The intensity decreases when temperature goes
down. Two wide peaks in range of 200-400 cm
-1
and 600-800 cm
-1
occur
because of 2
nd
Raman scattering. Raman scattering spectroscopy in Fe, Co, Ni
doped samples is different. In addition to typical spectrum of oscillation mode
TO
4
, there are other modes which are typical of 2
nd
oscillation at around 700
cm
-1
.
Temperature of phase transition of SrTi
1-x
Fe
x
O
3
samples is 110-160 K, of
SrTi
1-x
Co
x
O
3
samples at 110-130 K and of SrTi
1-x
Ni
x
O
3
samples at 110-150 K.
5.3. The effect of ion M on Raman scattering spectroscopy of SrTi
1-x
M
x
O
3
films synthesized by PLD method at room temperature
Raman scattering spectroscopy of pure SrTiO
3
has oscillation modes:
TO
2
-LO
1
, TO
3
-LO
2
, LO
3
, TO
4
, LO
4
-A
2g
in accordance with 177, 270, 480, 544,
792 cm
-1
. When Co content increases, there are 2 peaks at 430 and 750 cm
-1
of
2 bands 300-500 cm
-1
and 650-850 cm
-1
. Besides that, peak intensity of 2
nd
scattering B
g
(230 cm
-1
) and oscillation modes 578 cm
-1
increases considerably.
It is clear that when Co, Ni content rises, on SrTi
1-x
M
x
O
3
films typical
oscillation modes of 2
nd
scattering occur, for Co dpoed samples at 750 cm
-1
and
for Ni samples at 300 cm
-1
an 680 cm
-1
.
5.4. Comparison, discussion Raman scattering spectroscopy of SrTi
1-x
M
x
O
3
samples synthesized by sol-gel và PLD method
For pure STO sample at room temperature, oscillation modes
predominate, especially 1
st
scattering modes: TO
2
-LO
1
, TO
3
-LO
2
, LO
3
, TO
4
,
LO
4
-A
2g
. besides, there are 2 wide peaks in range of 200-400, 600-800 cm
-1
and
mode B
2g
at 230 cm
-1
which are assigned to 2
nd
scattering modes. This result is
relatively suitable to previous reports.
For SrTi
1-x
M
x
O
3
samples at room temperature, when substitute ion
content increases, there is only one typical mode of 2
nd
Raman in range of 700
cm
-1
.
For SrTi
1-x
M
x
O
3
films at room temperature, when Co, Ni content
increases, typical modes of SrTi
1-x
Co
x
O
3
and SrTi
1-x
Ni
x
O
3
films change
properly. Both show 1 wide peak of 2
nd
scattering in 600-800 cm
-1
. For SrTi
1-
x
Co
x
O
3
films, Raman scattering spectroscopy have wide peaks in 300-500 cm
-1
and intensity of oscillation mode B
2g
increases in spite of low Co content (x =
0.1), then decrease when Co content increases. However, for SrTi
1-x
Ni
x
O
3
films,
when Ni content increases, the shapes of scattering spectrum at x = 0.1 and 0.2
are the same, typical mode of 2
nd
scattering occur in 600-800 cm
-1
. If Ni content
reaches to x = 0.3, Raman scattering spectroscopy will have other characters
from 2 these samples, with oscillation mode at 300 and 613 cm
-1
.
It can be seen that different substitute contents cause different phase
transition temperatures which are higher than that of pure STO sample.
Moreover, with different method of synthesized samples, Raman scattering
spectroscopy of SrTi
1-x
M
x
O
3
samples and SrTi
1-x
Co
x
O
3
films also have different
characters.
5.5. The effect of ion M on absorption spectra of SrTi
1-x
M
x
O
3
synthesized
by sol-gel method at room temperature
STO materials have high dielectric constant (ε = 300 at room
temperature). The results in theory and practicality of band gap energy width
are different. L. Soledade et. al gave result of 3.73 eV by theoretical calculation.
Experimental result of W. Keith et al is 3.34 eV, and others is 3.22 eV.
From absorption spectra of pure STO, we defined forbidden band width
is 3.18 eV, in accordance with wave length of 391 nm (figure 5.9a). This result
is suitable to that of the previous reports.
By extrapolation method, we define the
band gap energy width of the rest
samples.
Figure 5.9 present the dependence
on Fe content of band gap energy. When
substituting a part of Fe
3+
for Ti
4+
,
samples can absorb in visible zone and a
part of infrared zone.
The reason for reduction of
forbidden band width when Fe
3+
content
increases is dopant in STO. As we know,
STO is dielectric materials with high
band gap energy lager. When replacing
ion Fe, 3d of Fe is over 2p of O on covalent band, which causes the width of
band gap energy decreases. This result was also affirmed by experimental and
X- ray photoelectron spectrum X (XPS).
Figure 5.9. Absorption spectra
of SrTi
1-x
Fe
x
O
3
(x = 0.0 ÷ 0.5).
300 450 600 750
Absorption (arb. units)
Wawelenght (nm)
0.0
0.1
0.2
0.3
0.4
0.5
By investigation of absorption spectra of SrTi
1-x
M
x
O
3
samples, we can
prove that the width of band gap energy decreases with Fe, Co, Ni content. Like
Fe doped samples, for SrTi
1-x
Co
x
O
3
, SrTi
1-x
Ni
x
O
3
samples, 3d state is over 2p
which cause decrease in band gap energy width.
Besides, Co, Ni exist in different oxidation states and play as acceptor
which also cause decrease in band gap energy width
Our estimation of energy level formation in band gap energy when doped
Fe, Co, Ni in STO has been examined by density functional theory (DFT).
5.6. Electronic structure and Density of State (DOS) of Fe, Co doped SrTi
1-
x
M
x
O
3
In this thesis, we use LDA (Local Density Approximation) to computer
region structure, DOS of Fe, Co doped STO with CASTEP program
(Cambridge Serial Total Energy Package). Crystal structure of STO was taken
from library of Materials Studio.
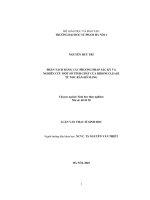
Figure 5.13 presents energy region structure and DOS of pure STO,
which are similar with the previous reports. It can be seen that peak of covalent
band and base of band locate at G and Z spot on Brillouin zone ( Figure 5.13a)
with value of 1.68 eV, while experimental value is 3.2 eV because of LDA
method, which ignore interaction among electronic gas.
-1.5
-1.0
-0.5
0.0
0.5
1.0
1.5
2.0
2.5
3.0
ZQF G
G
Energy (eV)
(a)
-5 -4 -3 -2 -1 0 1 2 3 4 5
0
20
40
60
80
0
20
40
60
80
0.0
0.5
1.0
1.5
0
20
40
60
Energy (eV)
Total
Ti 3d
Sr 5s
O 2p
DOS
Energy (eV)
(b)
Figure 5.13. Diagram of
structure of energy region (a)
and density of state (b) of pure
SrTiO
3
.
In diagram of partly density of states PDOS (Figure 5.13b), covalent
region was contributed by 2p of O. In the conducting region, 3d state was
predominant. This means that when replacing or doping electron for STO
material, impure energy levels were formed, or Fermi level sifted to conducting
region, causing width of band gap energy decrease.
Structure of energy region and DOS of 12,5 and 25% Fe doped STO are
presented on figure 5.14. From the structural diagram of energy region (figure
5.14a), impure energy bands over Fermi were formed, causing the width of
band gap energy decrease to 0,86 eV. Diagram density of state (DOS) in figure
-1.0
-0.5
0.0
0.5
1.0
1.5
2.0
Z
Q
G
F
G
Energy (eV)
(a)
-5 -4 -3 -2 -1 0 1 2 3 4 5
0
50
100
150
0
50
100
0
40
80
0.0
0.5
1.0
1.5
0
20
40
60
Total
Fe 3d
Ti 3d
Sr 5s
O 2p
DOS
(b)
Energy (eV)
Figure 5.14. Fe doped SrTi
1-x-
Fe
x
O
3
with x = 0.125. (a)
structure of energy region, (b)
density of state.
Energy (eV)
-5 -4 -3 -2 -1 0 1 2 3 4 5
0
50
100
150
0
40
80
0
20
40
60
0.0
0.5
1.0
1.5
0
20
40
60
E (eV)
DOS
Total
Fe 3d
Ti 3d
Sr 5s
O 2p
DOS
(b)
-1.0
-0.5
0.0
0.5
1.0
1.5
2.0
ZQF G
G
(a)
Energy (eV)
Figure 5.15. Fe doped SrTi
1-x-
Fe
x
O
3
with x = 0.25. (a)
structure of energy region, (b)
density of state.
5.14b indicates that at the Fermi energy level and proximity levels, electronic
concentration of 3d state was predominant.
From the diagram structural of energy region 25% doped Fe SrTi
1-x
Fe
x
O
3
materials ( figure 5.14a), it is clear that, the impurity cover on valence peak has
become impure energy region. Therefore, electrons moved from the peak of
impure energy region to base of conducting band, which caused decrease in the
width of band gap energy to around 0.75 eV. In the density of state, we
researched on energy levels in the covalent area to conducting region, because
these levels are typical for investigated materials. In the valence band, energy
levels were formed partly by hybridization among 2p of O, 5s of Sr, 3d of Fe.
While in the samples without doped of Fe, (figure 5.13b), energy at maximum
of valence band was also contributed by Fe 3d. At the base of conducting
region, there was strong interaction between 3d state of Ti and Fe. Contribution
of Fe was smaller than that of Ti because Fe substituted concentration was
much smaller than that in STO. Similarly in the SrTi
1-x
Fe
x
O
3
materials, on the
diagram structural of energy band Co doped SrTi
1-x
Co
x
O
3
with x = 0.125,
impure energy band over Fermi were formed by 3d state of Co ion, causing the
width of band gap energy decrease to around 1.0 eV. This result was suitable to
reports on conductivity of SrTi
1-x
Cr
x
O
3
and CaTi
1-x
Cu
x
O
3
. Thence, electrons
moved from impure energy band to peak of conducting region, leading decrease
in the width of the band gap energy. Diagram density of states indicates that, at
the proximity of Fermi, electronic concentration of Oxygen 2p and Co 3d were
predominant.
CONCLUSION
1. SrTi
1-x
M
x
O
3
systems (M = Fe, Co, Ni; x = 0.0 ÷ 0.5) have been
prepared by Sol-gel and PLD method. The samples received by this method
give good quality, satifying requirements of the investigation. By sol-gel
method, temperature in phase formation decreased considerably from 1200 to
900
o
C. Especially, the preparation of SrTi
1-x
M
x
O
3
materials by PLD method
has contributed to technological process.
2. The result in structure was the evidence of substitution of transition
metals, shown by changing lattice constants. Grains of 10-30 nm dimension
were obtained by Sol-gel method. Lattice gained by PLD method indicated the
role of transitional metal to grain formation. Thence, we can judge components
in the samples and give suggestion of dilute limitation of doped ions.
3. Role of grain, grain boundary, electrode has been judged by impedance
measurement. For SrTi
1-x
M
x
O
3
system prepared by Sol-gel, grain, grain
boundary, electrode have contribution to impedance. While for SrTi
1-x
M
x
O
3
system prepared by PLD method, there was only contribution of grain
boundary to impedance. Depending on doped and doped concentration,
resistance of grain, grain boundary and electrode had different values.
4. The pure SrTiO
3
samples prepared by Sol-gel and PLD method
performed both paramagnetic and ferromagnetism.
For SrTi
1-x
M
x
O
3
samples prepared by Sol-gel method, when concentration of
doped ions was low, (x = 0.1), samples shown both paramagnetic and
ferromagnetism. When the concentration was higher (x ≥ 0.2), samples shown
only ferromagnetism. In the measurement range of electromagnetic field (from
-13500 to 13500 Oe), only magnetization of SrTi
1-x
Ni
x
O
3
samples reached
saturation value.
For SrTi
1-x
M
x
O
3
samples prepared by PLD method, when the
concentration of doped ions increased, all samples had both paramagnetic and
ferromagnetism.
5. At the room temperature, Raman scattering spectroscopy of the pure
SrTiO
3
samples prepared by Sol-gel and PLD method also shown typical
oscillation modes of first order Raman scattering spectrum and two bands of the
second order Raman scattering spectrum. When the concentration of metal ions
Fe, Co, Ni increased, typical oscillation modes of SrTiO
3
materials decreased
gradually. On the Raman scattering spectroscopy of SrTi
1-x
M
x
O
3
samples
prepared by Sol-gel, there was only oscillation mode in range of 700 cm
-1
. On
the SrTi
1-x
M
x
O
3
samples synthesized by PLD method, there were oscillation
modes which were different from that of SrTi
1-x
M
x
O
3
samples synthesized by
Sol-gel because lattice had preferred orientation.
Basing on Raman scattering spectroscopy of material system SrTi
1-x
M
x
O
3
prepared by Sol-gel at the low temperature, it was indirectly inferred that
temperature of phase transition was around 110-160 K.
Measurement result of absorption spectra on SrTi
1-x
M
x
O
3
materials
synthesized by sol-gel indicated that, absorption edge shifted to high wave-
length (low energy), there was complete light absorption in visible area and
infrared area. It can be predicted that a part of Fe, Co, Ni ions has contributed
to the structure and become acceptor contaminant, increasing conductivity of
the prepared materials. This predication has been supported by structural energy
region and density of states.
Diagram structural of energy region and density of states defined that
when Fe, Co were substituted in SrTi
1-x
M
x
O
3
,
impure energy region over Fermi
has been formed, which caused decrease in width of banned area.