nghiên cứu đánh giá tính dễ bị tổn thương do biến đổi khí hậu đối với sản xuất nông nghiệp. áp dụng thí điểm cho một số tỉnh vùng đồng bằng sông hồng
Bạn đang xem bản rút gọn của tài liệu. Xem và tải ngay bản đầy đủ của tài liệu tại đây (1.35 MB, 24 trang )
MINISTRY OF EDUCATION
AND TRAINING
MINISTRY OF AGRICULTURE
AND RURAL DEVELOPMENT
VIETNAM ACADEMY FOR WATER RESOURCES
HA HAI DUONG
CLIMATE CHANGE VULNERABILITY ASSESSMENT ON
AGRICULTURE PRODUCTION. PILOT APPLICATION FOR
SOME PROVINCES IN THE RED RIVER DELTA
SUMMARY OF DOCTOR OF PHILOSOPHY THESIS
Specialization: Water Resources Engineering
Code : 62 58 02 12
HANOI, 2014
This work has been completed at:
VIETNAM ACADEMY FOR WATER RESOURCES
Scientific supervisors:
1. Prof., Dr. Tran Thuc - Vietnam Institute of
Meteorology Hydrology and Environment
2. Prof., Dr. Lars Ribbe – Cologne University of
Applied Science, Germany
Judge 1: Assoc., Prof., Dr. Tran Viet On
Water Resources University
Judge 2: Assoc., Prof., Dr. Hoang Thai Dai
Hanoi University of Agriculture
Judge 3: Assoc., Prof., Dr. Nguyen Van Tinh
Directorate of Water Resources - MARD
The Thesis shall be defended against State level thesis assessment
council held at: Vietnam Academy for Water Resources, No 171 Tay
Son street, Dong Da district, Hanoi, Vietnam.
At …… hours, on ……day… month… 2014.
The Thesis can be further referred to at:
- National Library of Vietnam;
- Library of Vietnam Academy for Water Resources;
- Library for Institute for Water and Environment.
1
PREFACE
I. Research purposes
Develop a method to assess the vulnerability caused by
climate change on rice production;
Assess the vulnerability caused by climate change on rice
production in Nam Dinh, Hai Phong, Ha Nam and Hai Duong
provinces.
II. The scientific significance of the thesis
In term of academy, the climate change vulnerability
assessment method has been supplemented and completed, especially
focus much on community level;
Provide a set of indicator for assessing vulnerability to
climate change on agriculture production;
Provide a process to calculate sub-indices and main indices
of climate change vulnerability index;
Provide a basic methodology to develop the support software
that to be recommended to apply for other relevant research.
III. The practical significance of the thesis
Establish a method and tool supporting for assessment and
determination of the most vulnerable province and applied
practically for 04 provinces as Ha Nam, Nam Dinh, Hai Phong and
Hai Duong;
Pilot application for 04 provinces as Ha Nam, Nam Dinh,
Hai Phong and Hai Duong to determine which province is the most
vulnerable to climate change.
IV. The new points of the thesis
Establish a method with the unified process to assess the
vulnerability to climate change on agriculture production;
Establish the sub-indicators and main indicators of
vulnerability to climate change on water demand for crop;
Develop the set of indices and maps of climate change
vulnerability on water demand for crop in pilot provinces;
Develop the Climate Vulnerability Assessment Support
Software (CVASS)
2
CHAPTER I. LITERATURE REVIEW ON THE
METHODOLOGY FOR ASSESSING VULNERABILITY TO
CLIMATE CHANGE
Based on the result of literature review on the methods and
frameworks for assessing vulnerability to climate change in Vietnam
and over the world, in general, it is recognized that the approach of
most of vulnerability method and framework divided into 3
categories as following:
1.1. Top-down approach
Top-down approach focuses much on climate-risks
assessment for long-term such as decade and normally to year 2100
and based on climate change scenarios.
Typical methods and frameworks using this approach
include 7-steps framework of IPCC, assessment method of NOAA.
1.2. Bottom-up approach
This approach has been applied in the recent years and
supporting for top-down approach due to it based on local adaptive
strategies and indigenous technologies and knowledge responding to
current climate change. This approach is very useful for strategy
development and policy implementation.
Typical methods and frameworks using this approach
include framework of National Adaptation Program of Action
(NAPA), 5-steps method of America International and Cooperation
Agency and Vietnam institutes and organizations such as Vietnam
Red Cross, Asian Cities Climate Change Resilience Network, and
Institute for Water and Environment…
1.3. General approach
The combination of above two approaches is called general
approach and this has been applied in the Australian government
program for climate-risk assessment and adaptation plan in
Mandurah, A Guide to Community Vulnerability and Adaptation
Assessment and Action of Canadian International Agency,
vulnerability assessment method based on MASSCOTE (FAO) and
framework of Stockholm Environment Institute and Indian
Technology Institute.
3
CHAPTER II. DEVELOPMENT OF METHOD AND
PROCESSES FOR ASSESSING THE VULNERABILITY TO
CLIMATE CHANGE ON WATER DEMAND FOR CROP
2.1. Development of method for assessing the vulnerability to
climate change on water demand for crop
2.1.1. Selection of vulnerability concept
In term of concept, the thesis selected vulnerability concept
of IPCC (2001) to develop method and vulnerability assessment
processes. Therefore, according to this concept, vulnerability shall be
expressed by the function of Exposure (E), Sensitivity (S) and
Adaptation Capacity (AC).
V = f(E, S, AC)
2.1.2. Approach for method development
The development of method for assessing the vulnerability to
change has been based on problem solving diagram as following:
(Figure 2.1):
Figure 2.1: Problem solving diagram for method development
2.1.3. Method for climate change vulnerability assessment
According to vulnerability concept of IPCC, problem solving
diagram mentioned above and the requirements of the method, the
4
thesis proposed a 5-steps method for assessing vulnerability to
climate change on water demand for crop as following:
Figure 2.2: Climate change vulnerability assessment method
2.2. Processes and content of the method for assessing
vulnerability to climate change on water demand for
crop
2.2.1. Step 1: Preparation
Collection of secondary data;
Identifying assessment scope: can be divided into two
regions: (i) the region affected by climate change and sea level rise
and (ii) the region affected by climate change without sea level rise.
Selection of climate change and sea level rise scenarios:
Applying scenarios corresponding to medium emission (B2) for the
method as well as pilot assessment.
Screening main impacts of climate change: Screening
impacts of climate change in the research area is an important step to
primarily determine the impacts of climate change in the pilot areas
before conducting field assessment.
2.2.2. Step 2: Field assessment
- Preparation for field assessment including the activities such
as: (i) Development of field assessment proposal, (ii) Selection of
climate change and sea level rise scenarios; (iii) Identifying
assessment scope; (iv) Preparation of tables and questionnaires for
5
data collection; and (v) Preparation of tools for assessment and data
collection at community level.
Processes for assessment at community level: Include following
activities:
Activity 1: Work with locality (province, district and commune);
Activity 2: Establish partners group and to train them;
Activity 3: Document and data collection; and
Activity 4: Discuss with partner groups and local people.
2.2.3. Step 3: Identifying vulnerability elements
The content of step 3 is to collect data for calculating
Exposure (E), Sensitivity (S) and Adaptive Capacity (AC) which will
be used for constructing vulnerability index in step 4. The result of
step 3 is collected data tables of sub-variables of exposure,
sensitivity and adaptive capacity.
2.2.4. Step 4: Constructing vulnerability index
- Calculating vulnerability index;
- Developing vulnerability maps and charts.
2.2.5. Step 5: Assessing vulnerability to climate change
The content of this step is to determine which
province/district is the most vulnerability to climate change on water
demand for crop and then proposing adaptive measures.
2.3. Scientific research and algorithm applied to build
Climate Vulnerability Assessment Support Software
2.3.1. Assessment of vulnerability by index method
The climate vulnerability index consists of three main
indices including Exposure index (E), Sensitivity index (S) and
Adaptive Capacity index (AC) and their sub-indices.
2.3.2. Developing process to calculate vulnerability index;
The calculation of vulnerability index, main indices and sub-
indices is presented by the diagram as following:
6
Figure 2.3: The diagram to calculate climate vulnerability index
2.3.2.1. Normalization of collected data
Collected data had been normalized by using Equation (1)
and started at the lowest level as E
11
÷ E
1n
, E
n1
÷ E
nn
, S
11
÷ S
1n
, S
n1
÷
S
nn
, and AC
11
÷ AC
1n
, AC
n1
÷ AC
nn
:
2.3.2.2. Identifying the weight of indices
After normalizing collected data, it is necessary to identify
the weight for each sub-index. In the scope of the thesis, the weights
were identified by unequal weight method basing on the quantity of
sub-variables.
2.3.2.3. Calculating sub-variable indices
As mentioned above, each main-variable could comprise of
different sub-variables and each sub-variable could comprise of
different correlative components, therefore, sub-variables indices can
be calculated by Equation 2 as following:
2.3.2.4. Calculating main-variable indices
2.3.2.5. Calculating climate vulnerability index
7
2.3.3. Process to identify and calculate vulnerability index
According to contents and the equations mentioned above,
the process to identify and calculate climate vulnerability index as
well as the indices of exposure, sensitivity and adaptive capacity is as
followings:
Figure 2.4: Process to calculate climate vulnerability index
8
2.3.4. Identifying Exposure index (E)
Exposure index consists of 3 sub-indices as (i) Climate extreme event (E
1
); (ii) Change in climatic
variables (E
2
); and (iii) Sea level rise (E
3
). Each sub-index is expressed by the indicators as following:
Sub-
component
Indicator
Unit
Source
Present
2030
Climate
extreme
event (E
1
)
Number of annual average of 10-scale storm (E
11
)
Event
Statistic
Assume
Number of annual average of flood (E
12
)
Event
Statistic
Assume
Number of annual average of drought (E
13
)
Event
Statistic
Assume
Change in
climatic
variables
(E
2
)
Average of yearly maximum rainfall (E
21
)
mm
Statistic
CC Scenarios
Average of yearly minimum rainfall (E
22
)
mm
Statistic
CC Scenarios
Average of yearly maximum temperature (E
23
)
T
o
Statistic
CC Scenarios
Average of yearly minimum temperature (E
24
)
T
o
Statistic
CC Scenarios
Total of potential evapotranspiration (E
25
)
%
Statistic
CC Scenarios
Sea level
rise (E
3
)
Sea level rise (E
31
)
cm
Statistic
CC Scenarios
9
2.3.5. Identifying Sensitivity index (S)
Sensitivity index consists of 4 sub-indices as (i) Land use (S
1
); (ii) Water sources (S
2
); (iii) Labour
and income (S
3
); and (iv) Affected by climate extreme events (S
4
). Each sub-index is expressed by the
indicators as following:
Sub-component
Indicator
Unit
Source
Present
2030
Land use (S
1
)
Land use for crop (S
11
)
ha
Statistic
LUP
Irrigated land use for crop (S
12
)
ha
Statistic
IDP
Water sources
(S
2
)
Total water flow at headwork (S
21
)
m
3
Calculation
Calculation
Water demand for crop (S
22
)
m
3
Calculation
Calculation
Operational effectiveness of head-works
(S
23
)
%
Calculation
Calculation
Labour and
income (S
3
)
Rate of agriculture population (S
31
)
%
Statistic
SDP
Total of poverty households (S
32
)
Houshold
Statistic
SDP
Total income from crop production (S
33
)
VND
Statistic
SDP
Affected by
climate extreme
events (S
4
)
Total land for crop affected by storm (S
41
)
ha
Statistic
Assume
Total land for crop affected by drought (S
42
)
ha
Calculation
Calculation
Flood level (S
43
)
ha
Calculation
Calculation
Maximum length of saline intrusion (S
44
)
ha
Calculation
Calculation
10
2.3.6. Identifying Adaptive Capacity index (AC)
Adaptive Capacity index consists of 3 sub-indices as (i) Infrastructure (AC
1
); (ii) Economy (AC
2
);
and (iii) Society (AC
3
). Each sub-index is expressed by the indicators as following:
Sub-
component
Indicator
Unit
Source
Present
2030
Infrastruct
ure (AC
1
)
Rate of concreted irrigation system (AC
11
)
%
Statistic
IDP
Rate of concreted rural road system (AC
12
)
%
Statistic
SDP
Rate of concreted on-farm road system (AC
13
)
%
Statistic
SDP
Rate of mechanization in agriculture production (AC
14
)
%
Statistic
SDP
Economy
(AC
2
)
Rate of investment in agriculture production (AC
21
)
%
Statistic
SDP
Investment in improvement of head-works (AC
22
)
VND
Calculation
Calculation
Investment in improvement of irrigation system (AC
23
)
VND
Calculation
Calculation
Society
(AC
3
)
GDP (AC
31
)
Statistic
SDP
Human Development Index (AC
32
)
Statistic
SDP
Remark: LUP: Land Use Plan; IDP: Irrigation Development Plan; SDP: Socioeconomic
Development Plan.
11
2.4. Development of vulnerability assessment support
software
2.4.1. Basic functions of the software:
Data base: Include all information, data, basic maps for
calculating vulnerability index and developing vulnerability maps
and charts.
Calculation function: to calculate the indices of exposure
(E), sensitivity (S), adaptive capacity (AC) and climate vulnerability
index (CVI).
Result display function: to display the table of indices, and
relevant vulnerability maps and charts.
2.4.2. Block diagram of CVASS software
Figure 2.5: Block diagram of CVASS software
12
CHAPTER III. THE RESULTS OF CLIMATE CHANGE
VULNERABITILY ASSESSMENT ON WATER DEMAND
FOR CROP IN SOME PILOT PROVINCES IN THE RED
RIVER DELTA
3.1. Selection of pilot areas and climate change scenarios
3.1.1. Pilot areas selection
Based on the natural conditions of each sub-area, the impacts
of climate change and sea level rise in each province/city as well as
the availability and feasibility of required input data, the following
provinces have been selected for pilot assessment:
- Area 1: Nam Dinh province (Giao Xuan and Giao Lac
commune, Giao Thuy district) and Hai Phong province (Tan
Trao commune, Kien Thuy district);
- Area 2: Ha Nam province (Lien Son commune, Kim Bang
district) and Hai Duong province (Tien Tien and Phuong
Hoang commune, Thanh Ha district).
3.1.2. Milestones for pilot application
Currently, all provinces in Vietnam have established
development strategy, socioeconomic development plan as well as
agriculture development plan for the year of 2030; moreover, most of
these provinces (including pilot provinces) have the Action Plan to
responds to Climate change on agriculture sector. Therefore, the
milestones for pilot assessment are at present and in 2030.
13
3.2. The results of climate change vulnerability assessment at
provincial level
3.2.1. Index and map of exposure (E) at provincial level
Table 3.1: Exposure index at provincial level
Province
Milestone
Present
Rank
2030
Rank
Nam Dinh
0.322
3
0.384
4
Hai Phong
0.626
1
0.697
1
Ha Nam
0.493
2
0.493
2
Hai Duong
0.256
4
0.399
3
Remark: (Rank 1
4: High
Low)
Figure 3.1: Exposure map at provincial level
14
3.2.2. Index and map of sensitivity (S) at provincial level
Table 3.2: Sensitivity index at provincial level
Province
Milestone
Present
Rank
2030
Present
Nam Dinh
0.898
1
0.825
1
Hai Phong
0.337
3
0.379
3
Ha Nam
0.130
4
0.170
4
Hai Duong
0.477
2
0.578
2
Remark: (Rank 1
4: High
Low)
Figure 3.2: Sensitivity map at provincial level
15
3.2.3. Index and map of adaptive capacity (AC) at provincial level
Table 3.3: Adaptive Capacity index at provincial level
Province
Milestone
Present
Rank
2030
Rank
Nam Dinh
0.556
2
0.659
1
Hai Phong
0.414
3
0.413
3
Ha Nam
0.389
4
0.392
4
Hai Duong
0.601
1
0.579
2
Remark: (Rank 1
4: High
Low)
Figure 3.3: Adaptive Capacity map at provincial level
16
3.2.4. Index and map of climate change vulnerability (CVI) at
provincial level
Table 3.4: Climate Vulnerability index at provincial level
Province
Milestone
Present
Rank
2030
Rank
Nam Dinh
0.555
1
0.517
1
Hai Phong
0.516
2
0.554
2
Ha Nam
0.411
3
0.424
4
Hai Duong
0.377
4
0.466
3
Remark: (Rank 1
4: High
Low)
Figure 3.4: Climate Vulnerability map at provincial level
17
3.3. The results of climate change vulnerability assessment at community level
3.3.1. The result of index calculation
Table 3.5: The indices of E, S, AC and CVI at community level in present
Commune
Present
E
Rank
S
Rank
AC
Rank
CVI
Rank
Tan Trao
0,700
1
0,432
5
0,535
6
0,533
1
Giao Lac
0,322
3
0,754
1
0,627
4
0,483
2
Giao Xuan
0,322
3
0,616
2
0,635
3
0,435
3
Tien Tien
0,256
4
0,604
3
0,697
1
0,388
5
Phuong Hoang
0,256
4
0,583
4
0,684
2
0,385
6
Lien Sơn
0,493
2
0,251
6
0,536
5
0,403
4
Table 3.6: The indices of E, S, AC and CVI at community level in year 2030
Commune
Year 2030
E
Rank
S
Rank
AC
Rank
CVI
Rank
Tan Trao
0,697
1
0,389
5
0,410
5
0,558
1
Giao Lac
0,384
4
0,687
1
0,574
2
0,499
3
Giao Xuan
0,384
4
0,560
4
0,506
3
0,479
5
Tien Tien
0,399
3
0,633
2
0,584
1
0,483
4
Phuong Hoang
0,399
3
0,612
3
0,409
6
0,534
2
Lien Sơn
0,493
2
0,222
6
0,439
4
0,425
6
18
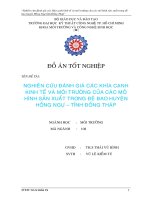
3.3.2. Climate change vulnerability at community level
Figure 3.5: Exposure chart at community level
Figure 3.6: Sensitivity chart at community level
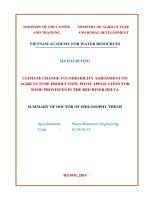
19
Figure 3.6: Adaptive Capacity chart at community level
Figure 3.7: Climate Vulnerability chart at community level
20
CONCLUSION AND RECOMMEND FOR FURTHER STUDY
I. Conclusion
According to scientific basic and the results of literature
review on the methods and frameworks for assessing vulnerability to
climate change in Vietnam and over the world, the thesis had
developed a method for assessing vulnerability to climate change
on water demand for crop.
In order to support to vulnerability assessment, a tool
(Climate Vulnerability Assessment Support Software - CVASS) has
been also developed. Besides, the set of 30 indicators of exposure,
sensitivity and adaptive capacity had proposed for calculating
climate vulnerability index.
Depending on scale and scope of pilot assessment, some
typical indicators had calculated by supplementary tool and
mathematic model before using CVASS software.
Based on equations (1), (2), (3) and (4) with the set of
indicators mentioned above, use CVASS software to calculate the
indices of exposure, sensitivity, adaptive capacity and climate
vulnerability index. With these indices, the development of
vulnerability map and chart has simplified by using CVASS software
in order to provide the results with more visual for vulnerability
assessment.
21
II. Recommends for further study
2.1. Recommends for developed method
The adaptive measures to responds to climate change at
community level must be feasibility and high reality.
It is required to check information and data for climate
assessment collected at community with those at the higher level.
The set of indicators (30 indicators) within the thesis are
only representative indicators of exposure, sensitivity and adaptive
capacity. Therefore, it is recommended for further study on
identifying maximum of indicators for relevant studies.
It is requires for further study on weighting calculation, the
variation and deviation of weights when using different weighting
methods
In some special case, if the statistic data is not available the
relevant supplement models should be applied to calculate the
indicator variables before using CVASS.
2.2. Recommends for CVASS software
In the future, it is required to update data base for all
provinces of Vietnam.
It is requires for further study on integrating relevant models,
software such as Cropwat, Mike, DSSAT… into CVASS software to
become a module of this software.
It is very necessary to increase colour band of display
module of CVASS software in order to display maps and charts with
more clear and visual.
22
PUBLICATION RELATED TO THE THESIS
1. Nguyen Tuan Anh, Ha Hai Duong, Nguyen Xuan Lam. The
measures to upgrade irrigation system for new rural development
in coastal areas in the Red river delta. Journal of Water
Resources Science and Technology No 18. (9/2013), p.79.
2. Ha Hai Duong et al. Qualitative assessment of vulnerability to
climate changes. Journal of Water Resources Science and
Technology No 7. (3/2012), p.18.
3. Ha Hai Duong, Nguyen Quang An, Dinh Thuy Linh, 2012,
“Part 5: Climate Change Impacts on Water Resources,
Irrigation and Drainage.” Climate Change Impacts on
Agricultural sectors and Adaptation Measures, Agriculture
Publication, Hanoi, 42 pp.
4. Ha Hai Duong et al. Climate change impacts on water resources
systems in Vietnam; Adaptive policies and measures to respond
to these impacts. Journal of Agricultural and Rural Development
– Special topic on Climate Change and Adaptive Measures
(4/2011).
5. Ha Hai Duong. Literature review on the methodology to assess
the vulnerabilities caused by climate change. Journal of Water
Resources Science and Technology No 22. (7/2009), p.101.
6. Ha Hai Duong et al. Climate Change and Adaptive Capacity in
Quy Nhon City, Binh Dinh province. Journal of Water
Resources Science and Technology No 23. (7/2009), p.46.