Improving competitiveness of Petrolimex Joint-Stock Insurance Company = Nâng cao năng lực cạnh tranh công ty Cổ phần Bảo Hiểm Petrolimex
Bạn đang xem bản rút gọn của tài liệu. Xem và tải ngay bản đầy đủ của tài liệu tại đây (1.36 MB, 119 trang )
vietnam national university, HANOI
school of business
Do Thi Mai
IMPROVING COMPETITIVENESS of
PETROLIMEX JOINT- STOCK INSURANCE COMPANY
Major: Business Administration
Code: 60 34 05
Master of business administration thesis
Supervisor: Dr. Tran Phuong Lan
Hanoi - 2011
vi
TABLE OF CONTENT
ACKNOWLEDGMENTS i
ABSTRACT ii
TÓM TẮT iv
TABLE OF CONTENT vi
LIST OF TABLES vii
LIST OF FIGURES ix
LIST OF ABRREVIATION x
INTRODUCTION 1
1. The problem 1
2. Objectives 1
3. Research Questions 1
4. Scope of work 2
5. Methodology and data sources 2
6. Significance and expected results 2
7. Limitations 3
8. Thesis Structure 3
CHAPTER 1: THEORETICAL FOUNDATIONS 4
1.1 Definition of competitiveness 4
1.2 Sources of competitiveness 5
1.3 Models to assess and analyze industrial competitive environment 6
1.4. Models to analyze firm competitiveness 14
CHAPTER 2: RESEARCH AND ANALYSIS APPLICATION OF MODELS TO
ANALYZE PJICO’s COMPETITIVENESS 16
2.1 Overview of non-life insurance industry in general and in Vietnam 16
2.1.1. Non-life insurance industry in recent years 16
2.1.2 Non-life insurance industry in Vietnam 20
2.1.3 Key success factors in non-life insurance industry 25
2.1.4. Factors affecting non-life insurance enterprise’s competitiveness 27
2.2. Overview of PJICO 29
vii
2.2.1. Introduction of PJICO 29
2.2.2. PJICO’s business activities 33
Unit: VND billion 35
2.3. Application of models to analyze PJICO’s competitiveness 39
2.3.1. Application of PEST & Five Forces models to analyze factors affecting
PJICO’s competitiveness 39
2.3.2. Application of Value Chain model to analyze and evaluate PJICO’s
competitiveness 51
2.3.3. PJICO’s competitive position in comparison with its main competitors 76
CHAPTER 3: CONCLUSIONS AND RECOMMENDATIONS 80
3.1. Conclusion of PJICO’s Competitiveness 80
3.1.1. Summary from internal analysis and competitiveness comparison 80
3.1.2. Assess to the real PJICO’s strengths & weaknesses – the core
compentencies 85
3.2. Solutions for PJICO to strengthen its competitiveness & to achieve its
objectives 89
3.2.1. PJICO’s strategic vision and objectives 89
3.2.2. Solutions for improving PJICO’s competitiveness until 2017 90
3.3. Recommendations 106
3.3.1. Recommendations to Government 106
3.3.2. Recommendations to Association of Vietnamese Insurers 107
3.3.3. Recommendations to PJICO 108
REFERENCES 109
APPENDICES 111
LIST OF TABLES
Table 1.1: Selected connotations of firm level competitiveness: 5
Table 1.2: The five forces that shape industry competition of Michael Porter 9
viii
Table 2.1: Real growth rate of Industrialized and Emerging markets (1980 – 2009) 17
Table2.2: Real growth rate of insurance market of developing countries (1980 -
2010) 18
Table 2.3: Asia Pacific Non-life markets at a glance, 2008 - 2010 19
Table2.4: Vietnam’s top 10 non-life insurance market share 2005-2010 21
Table2.5: Non-life insurance premium income and premium growth 2004-2010 21
Table2.6: Premium and Loss by class in 2010 23
Table 2.7: Gross Premium Income by Type of Insurance 2007-2010 38
Table 2.8: Vietnam’s non-life insurance market shares 2005- 2010 47
Table 2.9: Conclusion of Environment analysis – Chances and Challenges 51
Table 2.10: Labor Force of PJICO 2006-2010 69
Table 2.11: Statistics of Training Courses 2007-2010 70
Table 2.12: Some financial criteria of PJICO 2007-2010 73
Table 2.13: Competitiveness Comparison 77
Table 3.1: Identification of Sustainable Competitive Advantages - Strengths 85
Table 3.2: Identification of Sustainable Competitive Advantages – Weaknesses 86
Table 3.3: The real PJICO’s strengths and weaknesses – Core competencies 88
Table 3.4: Possible solutions and actions 91
ix
LIST OF FIGURES
Figure 1.1: Value chain 14
Figure 2.1: Market premium and loss 2006-2010 22
Figure 2.2: Non-life insurance premiums by business lines 23
Figure 2.3: Market share of Non-life Insruance Companies 2010 31
Figure 2.4: Insurance Premium Income 2005-2010 35
Figure 2.5: PJICO’s Product Portfolio in 2010 36
Figure 2.6: Vietnam’s GDP 42
Figure 2.7: Vietnam’s savings and current account balance (in % of GDP) 43
Figure 2.8: Vietnam’s inflation and exchange rate 43
Figure 2.9: Some Vietnam’s economic figures 44
Figure 2.10: Value chain of PJICO ……………………………………………… 52
Figure 2.11: Process of new product design 53
Figure 2.12: Underwriting process 59
Figure 2.13: PJICO’s process of reinsurance 62
Figure 2.14: Survey process for non-life insurance products of PJICO 64
Figure 2.15: Claims handling process for non-life insurance products of PJICO 65
x
LIST OF ABRREVIATION
PJICO
Petrolimex joint-stock insurance company
SWOT
Strengths, Weaknesses, Opportunities, Threat
PEST
Political, Economic, Social, Technological
R & D
Research & Development
SCIC
State Capital Investment Corporation
CEO
Chief Executive Officer
GDP
Gross Domestic Price
IT
Informatics Technology
1
INTRODUCTION
1. The problem
Vietnamese non-life insurance market has been experiencing a challenging,
struggling as well as fast-developing stage. Going along with this context, each and
every participant in this market needs to focus more on their real competitiveness to
achieve further growth and sustainability; and PJICO is one of these players.
Moreover, until now, there has not been a complete and thorough analysis on
PJICO’s competitiveness and the ways to improve the real competitiveness.
Therefore, the thesis is born to conduct analyses on PJICO’s competitiveness and
suggest possible solutions to strengthen its competitiveness in order to stand and
develop in Vietnamese non-life insurance market in the future.
2. Objectives
The objectives of this study can be listed as follows:
Give the overview on concept of competitiveness
Provide some analyses on macro and industry environment of insurance
market
Conduct a thorough study on PJICO’s competitiveness
Recommend the possible ways to improve the current competitiveness so
as to help PJICO be stable and progressive in the insurance market.
3. Research Questions
Based on the problem and objectives listed above, some research questions are
given and discussed:
a. What is competitiveness?
b. Method and process to analyze competitiveness of a firm?
c. The way to conduct macro and industry environment analysis of
insurance market?
2
d. The way to conduct internal environment analysis of an insurance
company?
e. What are suggestive solutions to improve the competitiveness of PJICO
to the year 2017?
Answering these above questions shall help the author fulfill and reach the
objectives which the thesis are required to achieve.
4. Scope of work
In terms of theory, the thesis focuses on the concept of competitiveness, macro and
industry environment analysis, and internal environment analysis of an enterprise.
In terms of practice, the thesis focuses on reviewing the current insurance market in
Vietnam, analyzing the external and internal environment of insurance market in
order to assess the competitiveness of PJICO, and giving recommendations on
possible solutions to improve its competitiveness to the year 2017.
5. Methodology and data sources
This study uses the descriptive method for analysis through a specific case study of
PJICO in the context of present Vietnam insurance market.
The data are sourced through two ways:
a. Secondary data are collected from research of books, websites, teaching
notes, reports, magazines and newspaper, and other available documents.
b. The primary data are collected chiefly through deep interviews with
PJICO’s as well as partners’, other players’ managers, key staffs, and
their customers. The details of primary data are shown in analyses in
Chapter 2 and Chapter 3; the list of interviewees and the list of
questionnaires are shown in the Appendix 1 and 2.
6. Significance and expected results
By scanning the specific theory on competitiveness and analyzing the impacts of
business environment of non-life insurance market, the study helps PJICO in giving
suggestive solutions to improve its competitiveness to the year 2017.
3
Therefore, this methodology, information and analysis can be applied for other
companies or other insurance companies or for the PJICO itself in other stages of
development.
7. Limitations
This thesis is conducted in narrowed scope of insurance market and the applications
to PJICO in certain period to the near future until 2017. Thus, it may not wholly
express and reflect the business environment as the whole and in other periods.
8. Thesis Structure
The study includes four parts as below:
a. Introduction
b. Chapter 1: Literature review and overview of non-life insurance market
c. Chapter 2: Research and applications of models to analyze PJICO’s
competitiveness
d. Chapter 3: Conclusions and recommendations
4
CHAPTER 1: THEORETICAL FOUNDATIONS
Day by day, firms have been facing increasing numbers of challenges, changes and
competitors. Indeed, being successful is requiring new perspective and practice on
competitiveness.
1.1 Definition of competitiveness
In spite of its significance, the concept and definition of competitiveness is widely
controversial. Up till now, there has been no generally accepted definition of
competitiveness as well as no mutually accepted definition to explain it. In the
simplest terms, competitiveness is the ability to compete. It has become the name of
the game where economic strength of a country or an industry or a firm is described
with respect to its rivals in the global market economy, in which goods and
resources can move freely throughout territorial borders.
In other terms, competitiveness is a broad concept. According to Beckley, “A firm
is competitive if it can produce and services of superior quality and lower costs than
its domestic and international competitors. Competitive is synonymous with a
firm’s long run profit performance and its ability to compensate its employees and
provide superior returns to its owners”. The Organization of Economic Cooperation
and Development (OECD) defines competitiveness as “the ability of companies,
industries, regions, nations and supranational regions to generate, while being and
remaining exposed to international competition, relatively high factor income and
factor employment levels on a sustainable basis.” Whereas, under Fischer and
Schornberg’s analysis, profitability is obviously a significant variable for assessing
sector competitiveness and value added as a percentage of turnovers is a kind of
profit margin that entity usually relies. “Market shares are often defined as the
proportion of the total available market segment or sales that is produced or sold by
a company. They also rationed that market share is a necessary competitive
indicator at the firm level even when analyzing aggregates, market share may be of
trouble” (InternationalJournal.org). Simply speaking, it can be said that
5
“competitiveness is how effectively an organization meets the wants and needs of
customers relative to others that offer similar goods or services” (Operations
Management - MD021 www2.bc.edu). Normally, three competitive levels are
focused: country, industry, and firm level. Originated from a Latin word –
Competer – involvement in a business competition for markets, competitiveness is
now broadly used across different fields. This study is focused on firm-level
competitiveness. It can be defined as the ability of firms to design, produce or create
markets products/ services superior to those offered by rivals. Among the three
competitiveness levels, firm level is of greatest interest in practitioners and has
attracted the maximum attention of researchers. Michael Porter says “it is the firms,
not nations, which compete in international markets”. The firms actually compete in
the global stage and cope with the direct competition.
Some competitive dimensions that firms should focus as below:
Cost
Product Quality and Reliability
Delivery Speed
Delivery Reliability
Sales and after sales service
Coping with Changes in Demand
Flexibility and New Product Introduction Speed
Other Product-Specific Criteria
1.2 Sources of competitiveness
The identification of sources of competitiveness has been supported by known
perspectives on competitiveness. According to Dr Ajitabh Ambastha and Dr. K.
Momaya, select connotations of firm level competitiveness from literature review
provide richer and comprehensive views on sources of competitiveness.
Table 1.1: Selected connotations of firm level competitiveness:
No.
Source
6
1
Brand and reputation
2
Culture and system
3
Human resources
4
Technology & IT applications
5
Value creation
6
Customer satisfaction
7
Market share
8
Productivity and new product development
9
Price, expenses
10
Marketing
11
Relationships
12
Others…
Competitiveness can be viewed via competency and environment approach. The
role of external factors (economic, legal, technological… factors) and internal
factors (firm’s strategy, structures, human resources, competencies, and other
tangible and intangible resources for their competitive success) should be
emphasized.
In today’s turbulent business environment, dynamic capabilities, flexibility, speed
and adaptability are becoming more significant sources of competitiveness. These
kinds of sources will be clarified more through analysis models in the part 1.3
below.
1.3 Models to assess and analyze industrial competitive environment
In essence, the duty of leading manager is to understand and cope with competition,
or in other words, work with competitiveness. However, they often define so-called
rivalry too narrowly, as if it happened only among direct competitors. Yet the
matter of competitiveness goes beyond direct competitors certainly. In order to
7
estimate competitiveness, it is essential to have analyses in both external and
internal environment.
The external environment has two aspects: macro and micro environment. Macro
environment deals with things affecting all the firms in the economy, whereas micro
environment deals with things that affect firms in specific industries. PEST model
(Economic, Political, Technological, Social factors…) is widely used to analyze
macro environment; and Michael Porter’s five competitive forces model (Rivalry,
Potential competitors, Customers, Suppliers, and Substitute) is mostly used to
analyze industry environment.
1.3.1 PEST analysis
PEST stands for Political, Economic, Social and Technological factors. However,
the number of PEST analysis is unlimited. Other country-specific factors can be
added to perform macro environment.
Economic factor:
Economic growth/ growth rate
Inflation
Monetary policy and exchange rate
Government intervention
Government spending
National income
Unemployment rate, and others
Political factor:
Legal framework
Regulations and tariffs
Taxation
Political stability
Intellectual property and consumer protection, and others
Technological factor:
Technology transfer
8
Impact of changes in Information Technology on economy and
industry
New discoveries and development
Capabilities of application and customization, and others
Social –cultural factor:
Culture
People attitude (to work, health, safety…)
Living conditions
Lifestyle
Education, and others
Other factors:
Natural factor (territorial area, level of rain, typhoons, storms,
climate…)
Demographical factor (ages, numbers of young, birth rate, death
rate…)
1.3.2 Five Force analysis
Michael Porter’s five competitive forces include industry rivals, buyers, suppliers,
potential entrants and substitute products. The five competitive forces shall help
define an industry’s structure as form the nature of competitive interaction within an
industry.
9
Table 1.2: The five forces that shape industry competition of Michael Porter.
Rivalry among existing competitors
When the rivalry is high, the profitability of an industry is limited. The industry
profit which driven down by rivalry depends firstly on intensity with which firms
compete and secondly on the basis on which they do.
Firstly, the strength of rivalry reflects the intensity of rivalry, which is due to:
The number of competitors
The growth rate of industry
High exit barriers
Competitors’ high commitment to the business
Firm lacks of familiarity with one another (diverse approaches or
differing goals)
10
However, the strength of rivalry also reflects the basis, or the dimensions on which
rivalry occurs. Once competitors compete on the same basis, it will have a major
influence on profitability.
In rivalry, price war is the destructive factor to profitability as price competition as
it helps transfer profits from an industry to its own customers. Price reduction also
interrupts buyers from product feature and service.
Price war happens if:
Products/services are identical and for customers there are few switching
costs; thus rivals can have price cut to attract more clients.
High fixed costs and low marginal costs, then players can cut price below
their average costs
There are still many rooms for capacity expansion. This capacity
expansion disturbs industry supply – demand balance, then often leads to
overcapacity and price reduction.
The product/service goes decline. This urges producers to cut price in
order to sell out product.
Not like price war, competition on other dimensions such as product feature,
customer service, delivery convenience, brand image, or promotions harm less to
profitability than price. Parallel, players can also improve value creation compared
to substitutes, or higher barriers to entry.
Another tragedy is whether rivals compete on the same dimensions. When most of
the players target to meet the same needs compete on the same dimensions
(attributes or basis), zero-sum competition is often visible, where one’s gain is
others’ loss; and then profitability is driven down.
Competition can increase average profitability or be positive when each player aims
to serve different customer segments, with different mixes of price, products,
services, features, or brand identities. Such positive rivalry can not only support
higher average profitability but also cause industry expansion, as the needs of more
and more buyers are met. With clearer understanding on competition, leaders
11
sometimes can take measures to go to a more positive direction of competition
nature.
Threat of new entrants
Newcomers to industry come with new capacity and efforts to achieve market share
which will set pressure on prices, costs and other factors. When new entrants are
entering into new markets, they can leverage current capabilities and cash flows to
warm up rivalry. Thus, the threat of entry puts pressure on the profit potential of an
industry. High threat of new entrants shall make current players cut down their
prices or boost investment to compete with new rivals.
The threat of new entrants in an industry depends on entry barriers and current
players’ reaction to newcomers. When low entry barriers go with little retaliation
from incumbents, the threat of entry goes high, therefore it holds down profitability.
There are 7 main sources of barriers to entry:
Supply-side economies of scale: Firm that manufactures or creates at
larger volumes will get lower costs per unit. Economies of scale in supply
affect entry by pushing newcomers to enter the industry on a large scale.
With the practice of value chain, economies of scale virtually in every
activity.
Network benefits of scale: When the customer willingness to pay for a
product/service rises with the number of other customers also patronizing
the company, network effects will arise in industry. Customers may put
their concern in larger firms for a product/service. Then network effects
constrain entry by limiting the customer willingness to buy from a new
entrant and by decreasing the price.
Buyer switching costs: The higher switching costs, the more difficult it
will be for newcomers to enter the industry.
Fund requirements: Large financial resources requirements also limit
entrance to the industry. The barrier is especially high if fund is required
12
for uncovered expenses. Huge funding requirements will constrain
newcomers, and vice versa.
Incumbency advantages independent of size: existing players always
have advantages to potential entrants (such as technology, geographic
locations, brand identities, experience…). And entrants have to try to
surpass such advantages.
Unequal access to distribution channels: Certainly, newcomers have to
seek for placement channels. The more placement channels the
incumbents keep, the harder entrance to an industry will happen.
Especially when barrier to distribution access is high, newcomers have to
cooperate to bypass distribution channels or create their own ones.
Restrictive government policy: Government can directly influence on
potential entry through tools such as restrictions, requirements,
regulations, taxation, subsidies…
Besides barrier to entry, expected retaliation also impact on the entry or exit to an
industry. Potential entrants will be limited by expected retaliation if:
Existing players have replied tough to newcomers previously.
Incumbents have resources that can limit entry (such as borrowing power,
redundant productive capacity, available distribution channels…)
Current firms can and intend to do price reduction to fill excess capacity.
Slow industry growth makes new entrants obtain market only by taking it
from the existing participants.
The power of suppliers
Power of suppliers is high when they can charge high prices, limit service or
quality, or shift costs to industry participants. Suppliers are powerful when:
The supplier group is more concentrated that the industry itself.
In terms of revenues or profits, suppliers do not depend much on the
industry (for example, suppliers provide inputs for several industries).
13
Industry players cope with switching costs when they want to change
suppliers.
The product/service offered by suppliers is differentiated.
No or few substitutes for what the supplier group is serving.
Threat when suppliers tend to enter the industry to become the industry’s
participants.
The power of customers
The power of buyers is high by forcing down prices, having negotiating leverage,
being price sensitive, or demanding better service and quality…
Customers have negotiating leverage when:
There are few clients or each one buy a large volume of product/service.
Product/service of the industry is standardized or undifferentiated.
Low switching costs in changing sellers for customers
Threat of buyers’ integration
A group of clients is price sensitive when:
There is a significant fraction of cost structure in the product. Hence,
customers can shop and bargain.
Cash-poor buyers
There is little affect by the industry’s product in the quality of customer’s
product/service.
There is little affect by the industry’s product in the client’s other costs.
With the high power of customers in non-life insurance industry, in one side, PJICO
and other companies have to face up with the threats of reduce price, benefit and in
other side, they have to supply much better service for customers.
The threat of substitutes
A product/service and its substitute perform the same function by a different means.
High threat of substitutes will suffer industry profitability. Substitutes place a
ceiling on prices. This threat is considered high when:
Substitutes have attractive price.
14
Low clients’ switching cost to the substitute.
Sometimes, industry changes can make substitutes attractive. And leading
management should pay enough attention in these changes.
1.4. Models to analyze firm competitiveness
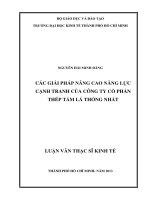
1.4.1 Value chain analysis
According to Michael Porter, value chain indicates the whole production chain from
the input to the output of final product/service by the end-user. There are two kinds
of activities in the value chain. One kind is called supporting activities, which
concerns the stream of production, where firms use its inputs, integrate and process
them, then produce or create its outputs. The other kind is called primary activities,
which are activities going across firms, where the outputs of one step become the
inputs of the next step.
Visible objectives of value chain can be mentioned:
Optimizing the overall activities of companies
Managing and coordinating the entire chain from initiate inputs to final
products/ services to end customers
Developing a sustainable competitive chain
Establishing choices and processes to support the relationships between
suppliers and customers…
Figure 1.1: Value chain
Source: www.manage12.com
15
Supporting activities include: firm infrastructure (finance, accounting…), human
resource management, technology development, and procurement.
Primary activities include: inbound logistics, production and/or operations,
outbound logistics, marketing and sales, and service.
A crucial analysis on the value created will help companies to identify its internal
capacity or its core competencies, and then figure out the strengths and weaknesses
of PJICO.
1.4.2 Core competencies assess
After extracting the strengths and weaknesses of firm from value chain analysis,
table of identification of sustainable competitive advantages to examine the long-
term or short-term strengths and weaknesses, and then they would lead to the
determination of core competencies for the company. The table is as follow:
Strengths/
Weaknesses
Valuable
Rare
Costly to
imitate
Big gap?
Coincide
with KSF
Marks
1. Factor 1
4/5
2. Factor 2
4/5
3. Factor 3
4/5
*KSF: Key Success Factors
Strengths with marks from 3/5 to 5/5 are considered as long-term strengths; whereas
short-term strengths are those with marks from 0/5 to 2/5. In contrast, weaknesses
with marks from 3/5 to 5/5 are short-term weaknesses; whereas long-term
weaknesses are those with marks from 0/5 to 2/5.
For the core competencies extracting from the sustainable competitive advantages
model, some possible solutions would be given based on improving strengths and
enhancing weaknesses, in order to improving competitiveness of the company.
16
CHAPTER 2: RESEARCH AND ANALYSIS
APPLICATION OF MODELS TO ANALYZE PJICO’s
COMPETITIVENESS
2.1 Overview of non-life insurance industry in general and in Vietnam
2.1.1. Non-life insurance industry in recent years
Non-life growth is still weak in industrialized countries, but strong in
Asia
In non-life insurance sector, premiums rose by 2.1% in 2010. Soft pricing still
showed slow growth in Europe and the US, while the strong economic rebound
pushed up premium growth in emerging Asia and the newly industrialized countries
in Asia. Throughout 2011, economic recovery is hopefully taking place, supporting
premium growth in both industrialized and emerging markets.
However, higher inflation, especially in the emerging markets, was chiefly driven
by rising food and energy prices. Emerging markets countries, especially in Asia,
weathered global financial recession better than most, due to sustainable growth in
GDP.
17
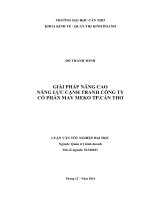
Table 2.1: Real growth rate of Industrialized and Emerging markets (1980 – 2009)
For non-life insurance in the world: global premiums growing, but only
slowly in the US and Western Europe
After global financial recession, the world premiums grew by 2.1% to USD 1819bn
in 2010. The recovery of capital in the non-life industry is still strengthening but
challenges also remain.
Developing countries: significant growth in many different markets
18
Table2.2: Real growth rate of insurance market of developing countries (1980 - 2010)
For South and East Asia: resilient despite the global financial crisis
Non-life premiums went up by 14% to USD75bn in 2009 (it was +9.7% in 2008).
Aggressive government fiscal policies and support has helped create pipeline of
projects on infrastructure construction, therefore, it helps non-life sector. Natural
disasters were not expected to be a main factor; however a number of typhoons hit
South and East Asia in the mid-years, causing lots of damages (Ketsana and
Miranae in 2009, Sansane in 2010…). The recovery from economic recession and
improving investment results also support non-life insurance. The major challenges,
like previous years, are continual price pressure, increasing inflation, and tighter
solvency standards.
19
Table 2.3: Asia Pacific Non-life markets at a glance, 2008 - 2010
Source: Swiss Re
Key concerns and conclusions of world’s non-life insurance:
The increase in interest rate, assets management is still existing problem
of insurance industry
The recovery of insurance companies’ financial states after recession
period
There are some breakthroughs in insurance industry: risk management
focus, bancassurance
Too many regulations that authority can apply for insurers, which can
distort development
Different development stages and different market segments among
countries, especially Asia