Giá trị khách hàng và chất lượng sống người tiêu dùng nghiên cứu trường hợp ngành siêu thị bán lẻ tại việt nam tt tiến
Bạn đang xem bản rút gọn của tài liệu. Xem và tải ngay bản đầy đủ của tài liệu tại đây (820.79 KB, 27 trang )
MINISTRY OF EDUCATION AND TRAINING
UNIVERSITY OF ECONOMICS HO CHI MINH CITY
LÊ QUANG BÌNH
CUSTOMER EQUITY AND CONSUMER
WELL-BEING: A CASE STUDY OF THE RETAIL
SUPERMARKET INDUSTRY IN VIETNAM
Major: BUSINESS ADMINISTRATION
Code: 9340101
SUMMARY OF Ph.D THESIS
Ho Chi Minh City - 2019
The thesis was completed in University of Economics Ho Chi Minh City
Tutor: Asso. Prof. Ph.D. Nguyễn Đình Thọ
Reviewer 1: .........................................................
Reviewer 2: ...........................................................
Reviewer 3: ...........................................................
The thesis will be presented to the school-level thesis evaluation board at:………..
At .......... time .........date .............. month....................year………..
The thesis can be found at: ..........................................................
1
Chapter 1: OVERVIEW OF RESEARCH THESIS
1.1 Research problem
Managers faced daily challenges of increasing the efficiency of their products and services with the
millions of dollars invested in marketing programs, regardless of whether the investment is made a reasonable
profit or not. Managers may simply not know how or are not able to calculate profit from investing in marketing
programs. They lack models of linking marketing activities with customer spending activities and instead often
use intuition to make decisions (Vogel at al, 2008). Customer equity model is one of the first methods to bridge
this gaps. Customer equity has become an important marketing objective for today's business organizations,
as it is capable of evaluating individual customers and customer segments from a value perspective (Rust at
al, 2000). The concept of customer equity must incorporate customer value management, brand management
and customer relationship management (Lemon at al, 2001). It is seen as the basis for a new strategic model
from which to build more powerful and customer-centered marketing programs that can are financially
accountable and measurable.
The impact of marketing on consumer well-being (CWB) has been concerned by many authors (eg Sirgy,
2001; Sirgy & Lee, 2008, 2012; Sirgy at al, 2006, 2007, 2008b). Marketing greatly affects consumer quality
of life because it directly affects the satisfaction of elements in consumers' life and indirectly affects other
aspects of life such as work life, family life, leisure life, financial life, etc. (Day 1978, 1987; Leelakulthanit at
al, 1991; Lee & Sirgy, 1995; Sirgy, 2001; Samli at al, 1987). So far there have been many different concepts
and measures of consumer well-being that have been introduced in the field of marketing, business and the
academic research in the world. While there have been many different efforts to measure consumer well-being
in the world, there is still little interest in studying, applying existing theoretical foundations to measure of
consumer well-being in different industries in Vietnam. There are many different concepts and measures of
consumer well-being. Therefore it is necessary to identify and apply the measurement model of consumer wellbeing in accordance with the research object, as well as the performance of marketing strategies towards
consumer well-being as a new trend.
Researching customer attitudes and behaviors for a particular company is based not only on customer
interaction and experience with that company, but also based on customer standards, preferences and
personality characteristics (Ferguson at al, 2010). The personality traits associated with customer reactions to
a service experience will create a specific attitude about a company that can lead to an intention in the next
attitude and behavior (Bagozzi, 1992). Consumers may prefer a specific supplier and product that matches
their personality traits or their own views (Yi Lin, 2010). In previous studies of customer characteristics in the
field of marketing, the five-character personality model (BigFive) has been widely used by authors. The model
of five personality traits including extraversion, conscientiousness, agreeableness, emotional stability
(neuroticism) and openness to experience (Bove & Mitzifiris, 2007). In Vietnam, researching on personality
traits in marketing is still less concerned by the authors, especially in the retail sector.
Researching on customer equity in the retail sector in generally and retail supermarkets in particularly has
been done in previous studies (eg Vogel at al, 2008; Dwivedi at al, 2012). However, the focus of this study is
to explore the relationship between customer equity drivers, including brand equity, perceived value and
relationship equity with consumer well-being, as well as testing the role of customer personality traits in the
retail supermarket industry in Vietnam. Retail supermarket is a shopping place close to consumers. It affects
the daily lives of consumers in generally, as well as affecting other aspects of their lives such as family life,
social life, work life, leisure life, etc. Customer's perception of shopping experience is very important in retail
supermarkets (Ailawadi & Keller, 2004). It not only affects the satisfaction or dissatisfaction of customers in
shopping, but also the customers' feelings of satisfaction in their life, the satisfaction that contributes to
improving their quality of life. Therefore, in the retail supermarket industry, it is necessary to enhance customer
equity, constantly invest in improving brand equity, value equity and relationship equity. It is identified as a
background for improving consumer well-being in the retail supermarket industry.
2
However, studying the relationship between customer equity and consumer well-being is still a new issue
in Vietnam. There has not been a complete study of measuring the relationship between customer equity
components and consumer well-being, as well as testing the role of customer personality on these relationships
at Vietnam market in generally and in retail supermarket industry in particularly.
1.1 Objectives of the study
- Discovering and measure the relationship between brand equity, value equity and relationship equity in
the retail supermarket industry in Vietnam;
- Discovering and measure the relationship between customer equity drivers (including brand equity,
value equity and relationship equity) and consumer well-being in retail supermarket industry in Vietnam;
- Exploring the moderator role of customer personality traits on causal relationships between research
concepts in the retail supermarket industry in Vietnam.
- Proposing management implications for marketing managers and business management in Vietnam's
retail industry in generally and Vietnam's retail supermarket sector in particularly.
1.2 Scope and research methodology
The research topic of the thesis only focuses on the retail market in Vietnam but in particular the retail
supermarket sector and general retail supermarket selected for research. Research objects are customers of
general retail supermarkets in Vietnam. Survey samples were taken in Ho Chi Minh City, Da Nang and Hanoi.
Subjects of the survey are customers who are shopping at retail supermarkets in three cities aged 18 and over.
Preliminary research is conducted by qualitative research and preliminary quantitative research methods,
conducted in Ho Chi Minh City in early 2017. Qualitative research is done through focus group discussion
techniques. Preliminary quantitative research is conducted by direct interview with retail supermarket
customers through questionnaires. Information obtained from the interview results is used to screen the
observed variables that measure research concepts. This study uses SPSS software to test the Cronbach alpha
reliability and exploring factor analysis (EFA). Formal research is conducted by quantitative research methods,
implementing information collection techniques by directly interviewing customers through a complete
questionnaire from preliminary quantitative research. This research step is carried out in Ho Chi Minh City,
Hanoi and Da Nang in mid-2017. This study uses AMOS software, performs the confirmatory factor analysis
(CFA) and the structural equation modeling (SEM) to test research models and research hypotheses.
1.3 New contributions in theory and practice of the thesis
Theoretical contributions: Firstly, the thesis synthesizes a relatively complete and systematic set of
customer equity theories, drivers of customer equity (including brand equity, value equity and relationship
equity), consumer well-being and customer personality traits. The theories presented in this thesis have good
reference value for research topics related to this field of research. Secondly, researcher has provided a
theoretical framework for customer equity, consumer well-being and customer personality traits. In addition,
the study proposes a model that explores the relationship between customer equity drivers and consumer wellbeing, the moderator role of customer personality traits on relationships of research model in the retail
supermarket industry in Vietnam. Thirdly, This research has inherited the scales of previous studies, and has
adjusted and supplemented to suit the context of this research and retail supermarkets. The results have built
the scales of this research concepts for retail supermarkets in Vietnam. Fourthly, this research results show
that value equity and relationship equity have a positive effect on the consumer well-being. In the five
personality traits, agreeableness is a significant moderating effect on the causal relationship between value
equity and consumer well-being, conscientiousness is a significant moderating effect on the causal relationship
between relationship equity and consumer well-being, agreeableness is a significant moderating effect on the
causal relationship between relationship equity and consumer well-being, extraversion and emotional stability
(neuroticism) have a significant moderating effect on the causal relationship between value equity and
relationship equity. This research results is completely new, not yet published in previous studies. Fifthly, this
research results show that investing to improve brand equity, perceived value (value equity) and relationship
equity not only contributes to customer equity but also contributes to consumer well-being.
3
Practical contributions: Firstly, this study provides the general managers and the retail supermarket
manager to understand more about customer equity, customer equity drivers, consumer well-being and
customer personality traits. Research has shown managers what is important to customer equity, thereby
marketing investment selectively and effectively to improve customer equity drivers, contributing to enhance
the perceived quality of life of consumers. This can increase sales and profits for businesses. Secondly, this
study helps researchers and business managers, especially in the retail context, see the important role of
consumer well-being in enterprise marketing strategy. In the retail supermarket industry, the goal of the
customer is not only toward their shopping satisfaction but also towards their life satisfaction in the general
and specific life domains (for example: social life, family life, leisure life, work life, health and safety,
physical/sensual life, etc.). Thirdly, this study also helps enterprise directors and marketing managers find the
role of customer personality to make the right solutions in business. Enterprises can implement solutions such
as training their service staffs who can serve customers enthusiastically and thoughtfully, understand customers
more in the process of performing their services; Investing in various supermarket utility suitable for the
majority of customers; diversification of product types, product quality, prices suitable for each customer, etc.
to serve customers better. Fourthly, this study also helps market research companies and marketing managers
to apply this research to measure customer equity drivers, consumer well-being, and customer personality in
other industries, since offering appropriate marketing activities to improve customer equity drivers, enhance
customer equity for the enterprises and increase consumer well-being.
1.4 Structure of the thesis
This thesis is carried out in six chapters: Chapter 1: Overview of the research topic, Chapter 2: Theoretical
basis, Chapter 3: Research model, Chapter 4: Research methodology, Chapter 5: Results of research, Chapter
6: Conclusion and direction for further research.
Chapter 2: THEORETICAL BASIS
2.1 Theory of customer equity
2.1.1 Customer lifetime value (CLV)
CLV is defined as measuring future profit streams from customers to companies, adjusted to customers'
future purchases from the company and being discounted for the present (Rust, Lemon , & Narayandas, 2004,
p. 23).
CLV is an important part of designing, budgeting and implementing marketing decisions (Dwyer, 1989).
It may not be beneficial for the company to maintain a relationship with the customer if the customer has a
short lifetime with the business or their changing behavior is high.
According to Berger and Nasr (1998), there is a potential threat when the company is too focused on CLV
and efforts to ensure the absolute maximum revenue from the most active and most profitable customers.
Companies should not neglect opportunities other customer pools may offer for generating revenue. The result
can continue to increase in CLV from the most frequent customers and gradually reduce the majority of
customers causing the overall profit reduction of the company.
CLV is a key concept of customer equity. CLV is a lifetime contribution of the customer to the company
and it is used as a measure of corporate success (Gupta et al., 2006). Lifetime contribution of customers to the
company is considered in the following four stages: (1) customer asquisition, (2) customer retention, (3)
relationship development and, (4) customer withdrawal (Rust, Lemon & Zeithaml, 2004; Berger et al., 2006).
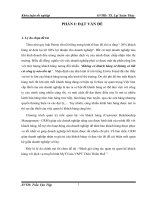
These four stages are described by Gupta et al. (2006) in Figure 2.1.
2.1.2 Customer equity
Blattberg and Deighton (1996) defined customer equity as the total net present value of the customer
lifetime aggregated across all of the company's customers. Customer lifetime value is one of the most important
measures of assessing the performance of business companies (Sargeant, 2001). Blattberg et al (2001) stated
that "customers are financial assets that companies and organizations should measure, manage and maximize
as other assets". Bitan and Mondschein (1997) defined a lifetime value as "all net contributions that customers
have created in customer lifetime on customer databases".
4
Firms’ Financial
Performance
Customer Lifetime Value
(CLV)
Customer
Customer
Relationship
Customer
Asquisition
Retention
Development
Withdrawal
Source: Gupta et al. (2006)
Figure 2.1: Modeling customer lifetime value
Rust et al. (2004) defined customer equity as “the total of the discounted lifetime values summed over all
of the firm’s current and potential customers” (p. 110). From this point of view, customer equity is considered
an important asset of an organization, because revenue is generated by customers and the investment to
generate this revenue is the company's cash flow facility (Hansotia, 2004).
As a theoretical framework, customer equity is widely applied in many different market contexts and
many industries because it directs enterprises to follow customer orientation (Rust et al, 2004). Customer
equity provides a strategic perspective for management decisions by providing facility managers with a basis
for identifying those customers or customer types they wish toseek out, retain, avoid, or even given up (Dorsch
et al, 2001). An important component of all customer equity-marketing initiatives is identifying specific
antecedents, or drivers of customer equity. Rust et al. (2004) argued that it is necessary for an organization to
distinguish between strategies that improve the components of customer equity that are useful and not useful.
It is only recently that researchers sought to identify specific components of customer equity. The summary of
studies in this direction is listed in Table 2.1.
Table 2.1: Antecedent theories of customer equity
Authors
Main content
Rust, Zeithaml and Lemon (2000);
Lemon, Rust and Zeithaml (2001);
Rust, Zeithaml and Lemon (2004);
Rust, Zeithaml and Narayandas
(2004).
Presenting a strategic model to explore key drivers that increase the
firms’ customer equity. The authors have proposed three main
drivers of corporate customer equity: value equity, brand equity and
relationship equity.
An overview of customer equity as a marketing process. Discussing
the management process, model and segmentation.
Testing the impact of marketing activities on customer benefits and
Dias, Pilhens and Ricci (2002).
shareholder value.
Proposing a unified model, called CUSAMS (customer asset
Bolton, Lemon and Verhoef (2004). management of services) to understand and influence the value of
customer assets.
Discovering the mediating roles of the drivers of customer equity in
Chang and Tseng (2005).
the effectiveness of relationship marketing activities on the average
revenue of each customer.
Testing the effectiveness of customer equity components in
Voorhees (2006).
predicting customer behavior.
Bayon, Gutsche and Bauer (2002).
5
Vogel, Evanschitzky and
Ramaseshan (2008)
Hyun (2009)
Ramaseshan, Rabbanee and Hui
(2013)
Razzaq at al (2016)
Cho and Jang (2017)
Researching the relationship between the drivers of customer equity
and customer loyalty and sales in the future of self-service retail
stores in Europe. The authors used three drivers of customer equity
proposed by Rust et al. (2000) to explore in the retail sector.
Establishing a model of customer equity in the restaurant industry
including brand equity, value equity and relationship equity. The
author has proposed sub-drivers of customer equity in the restaurant
industry. Researching the relationship between the three main
components of customer equity. The research sample is done for
customers in restaurant chains in Korea.
Researching the relationship between the three customer equity
components (brand equity, perceived value and relationship equity)
and customer loyalty of the telecommunications industry in the B2B
market in Australia through the mediating roles of customer trust.
The study has investigated the level of meaningful contribution of
customer emotions to customer equity components and customer
loyalty intention. The impact of three customer equity components
including brand equity, value equity and relationship equity on
loyalty intention that has been investigated by exploring more
regulatory effects of positive emotions and negative of customers.
The research sample is carried out in the supermarket and banking
industry in Pakistan.
Studying the impact of the drivers of customer equity (including
brand equity, value equity and relationship equity) on customer
loyalty and testing cultural differences between Korean and
American customers. Research data is collected from customers who
have shopping experience at discount stores in Korea and the United
States.
Source: The author synthesized from theoretical research
2.2 The drivers of customer equity
Rust et al. (2000, 2004), Lemon et al. (2001) identified the model of customer equity consisting of three
drivers that are value equity, brand equity and relationship equity. These three drivers are also used by some
other authors in their research (eg. Severt, 2007; Sweeney, 2008; Vogel et al., 2008; Hyun, 2009; Dwivedi et
al., 2012; Ramaseshan et al., 2013; Martin, 2015; Razzaq et al., 2016; Choo & Jang, 2017).
2.2.1 Value equity
Value equity is defined as an objective assessment of customers about the benefits of a brand based on
how customers perceive what they spent compared to what they received. (Rust et al., 2000). It is the perceived
rate between what is received (such as products and its benefits) and what has been spent (such as the price
paid for the product) and so the benefit is higher than the cost, it will bring higher customer value. Zeithaml
(1988) recommended four customer perceived factors in value, including (1) low prices, (2) whatever I want
in a product, (3) the quality I get for the price I pay, and (4) what I get for what I give up, including time and
effort. Holbrook (1999) proposed customers’ perceived value including input/output, quality, convenience and
aesthetics. Richards and Jones (2008) presented three factors to enhance customers’ perceived value including
customer perceptions of quality, price, and convenience. Rust et al. (2000, 2004) provided three elements of
perceived value, including quality, price, and convenience. Hyun (2009) provided five elements of perceived
value, including food quality, service quality, price, convenience and environment of the restaurant.
6
In the retail market, Vogel et al. (2008) studied the customer equity of consumer goods retail stores
(computer hardware) in Europe, based on Rust et al’ research (2000), the authors gave five elements of
perceived value, namely (1) price, (2) product quality, (3) service quality, (4) convenience and (5) ) tangible
environment of retail stores. Factors of perceived value of Vogel et al. (2008) were also studied by Ramaseshan
et al. (2013) in the telecommunications service industry of the B2B market.
2.2.2 Brand equity
According to Aaker (1991) defied brand equity as “a set of assets and liabilities linked to a brand, its
name and symbol, that add to or subtract from the value provided by a product or service to a firm and/or that
firm’s customers”. And Keller (1993) defined brand equity as the different effect of brand knowledge on
customer response to brand marketing. Basically, a company will have a higher brand equity when customers
response to their marketing efforts is more positive. Ambler et al (2002) defined brand equity as all that exists
in the minds of customers, including thoughts, feelings, experiences, images, perceptions, beliefs and attitudes.
A basic principle for brand equity is that a brand’s foundations including “peoples’ intangible mental
associations about it…(and) the value placed on the brand is really the value of the strength and resilience of
those associations” (Dyson, Farr, & Hollis, 1996, p. 9).
Explaining the nature of the relationship between brand equity and customer equity, Rust et al. (2000)
determined brand equity as part of customer equity and it builds on customer awareness about the brand.
Moreover, the brand equity represents the subjective and invisible assessment of customers and it is objective
perceived value of customers. Thus, the brand equity that includes many major components needs to be
considered. First, brand equity is considered a part of customer equity, which indicates that it is only partly
responsible for determining the overall customer equity of the firms. Second, brand equity is subjective
assessment of brand, but it is not an objective assessment. Therefore, the role of brand equity in the model of
customer equity is more focused than the concepts of brand equity given before.
Brand equity is a multidimensional concept whose elements have been tested in theories. Two of the often
cited models are of Aaker (1991) and Keller (1993). Aaker (1991) proposed brand equity consisting of four
elements (1) brand awareness, (2) perceived quality, (3) brand loyalty, and (4) brand association. Keller (1993)
argued that brand equity is the customer's knowledge of the brand, including two factors (1) brand awareness
and (2) brand image. Keller (2003) evaluated brand equity from a customer perspective as a two-element
structure that is brand awareness and brand image. In the study of consumer goods market in Vietnam, Nguyen
Dinh Tho and Nguyen Thi Mai Trang (2002) determined the association of brands is the attributes that
accompany the brand, the two authors also proposed three components of brand equity including (1) brand
awareness, (2) perceived quality and (3) brand passion.
In the retail industry, there are many published studies related to retail brand equity. Theories have shown
a concern over the past decade about analyzing the concept of brand equity in the retail sector, with certain
contributions to determine the content of this concept (For example: Hartman & Spiro, 2005; Pappu & Quester,
2006a; Jinfeng & Zhilong, 2009; Swoboda et al., 2009; Gil-Saura et al., 2016). According to Pappu and Quester
(2006a), brand equity is formed from awareness, association attributes, perceived quality and loyalty. Arnett
and ctg (2003), brand equity includes loyalty, awareness, service quality and association attributes. Jara and
Cliquet (2012) proposed the model of retail brand quity based on the model of Keller (1993), with the retail
brand equity described as a multidimensional concept consisting of two main components that are brand
awareness and positive brand image. Vogel et al. (2008) defined retail store brand equity as two factors: (1)
brand awareness and (2) brand image, which are proposed based on Keller’s model of brand equity (2003).
Thus, through the study of the theory of brand equity shows that the factors that make up the brand equity are
still inconsistent. However, recent research on customer equity in the service and retail industry, the authors
all agreed that the component of brand equity in customer equity includes two factors: brand awareness and
brand image (Vogel et al., 2008; Hyun, 2009; Dwivedi et al., 2012; Resmaseshan et al., 2013).
2.2.3 Relationship equity
7
Relationship equity is defined as the tendency of customers to return to the brand and beyond the objective
and subjective assessment of the brand (Lemon et al., 2001). The concept of relationship involves the belief
that how is it important of brand equity and perceived value is still not enough to retain customers. In other
words, even if the customer evaluates the product objectively and subjectively, they may not buy the product
in the future for many reasons, including changes in personal situations and the impact of other companies'
marketing efforts (Oliver, 1999). Relationship equity represents the strength of the relationship between firms
and customers. This concept comes from the theory of relationship marketing. Morgan and Hunt (1994)
defined relationship marketing as referring to all marketing activities and strategies aimed at creating,
expanding, and maintaining the exchange of successful relationships. According to Bejou and Iyer (2006), the
relationship with customers is a source of intangible assets. The intangible asset mentioned by the author is an
indirect component of the customer equity defined above. Therefore, relationship marketing activities can be
viewed as a meaningful role in enhancing value based on the relationship of the organization, as well as the
financial results and customer equity of the firm.
Lemon et al. (2001) believed that there should be a "glue" between customers and the company, one of
which is to increase the level of cohesion of the relationship. In this context, relationship equity is the glue.
Many researchers have proposed different measuring factors to measure relationship equity. Hennig-Thurau
and Klee (1997) proposed three factors of relationship equity including trust, commitment, and overall quality.
De Wulf et al. (2001) provide three factors that measure relationship quality including satisfaction, trust and
commitment. Hyun (2009) studies relationship equity in the restaurant industry, giving four elements of
relationship equity including trust, emotional commitment, satisfaction and conflict. In summary, through
research, we see three factors that authors often use to measure relationship equity are trust, satisfaction and
commitment (see De Wulf et al., 2001; Hennig-Thurau et al., 2002; Vogel et al., 2008; Hyun, 2009; Dwivedi
et al., 2012).
2.3 Consumer well-being (CWB)
2.3.1 Concept of consumer well-being
Many authors have conceived the concept of consumer well-being as a result of consumers' positive
emotional response when consuming a product or service. Sirgy et al. (2008b) believed that consumer wellbeing is a positive emotional response of consumers to high quality goods and services. Lee et al. (2002), Sirgy
and Lee (2003) described consumer well-being as consumer satisfaction from using a high quality goods and
services. Suranyi-Unger (1981) argued that CWB is the satisfaction of consumers' needs in various life domain
(eg physical, social, emotional, physical substances) that are not only economically pure. Nakano et al. (1995)
also described CWB as the level of consumer satisfaction with goods and services, the level of satisfaction
with a variety of life domains increases, the level of consumers’ quality of life (QOL) also increased.
Sirgy et al. (2007) defined CWB as a desirable state of objective and subjective quality based on different
stages of the consumer life or product cycle that relations with consumer goods. Merunka and Sirgy (2011)
defined CWB as "a consumer assessment related to the extent to which brands or companies contribute
significantly to their quality of life ".
2.3.2 Well-being marketing
Marketing is capable of significantly enhancing consumer well-being by providing consumers with goods
and services, not only to improve their overall quality of life but also to make it safe for consumers,
communities and the environment (Lee & Sirgy, 2012). The concept of well-being marketing is based on
Kotler's social marketing concept (1979, 1986, 1987).
Lee and Sirgy (2004) defined the well-being marketing as: "... a way of doing business like planning,
determining selling prices, promoting products and distributing goods to customers - designed to improve
consumers' quality of life while retaining the interests of the company's stakeholders (eg shareholders,
distributors, suppliers, workers, local communities and the environment).
The impact of marketing on consumer well-being has been concerned by many authors (eg Sirgy, 2001;
Sirgy & Lee, 2008; Sirgy et al., 2008b). Marketing greatly affects consumer well-being because it directly
8
affects the satisfaction of elements in consumers' life and indirectly impacts other aspects of life such as work
life, family life, leisure life, financial life, etc. (Day 1978, 1987; Leelakulthanit et al., 1991; Lee & Sirgy, 1995;
Sirgy, 2001; Samli et al., 1987).
So far, there have been many different concepts and measures of consumer well-being in the field of
marketing, business and published in jounals of well-being research by academics (eg Meadow & Sirgy, 2008;
Nakano & ctg, 1995; Day, 1987; Leelakulthanit et al., 1991; Lee et al., 2002).
2.3.3 The distinction between consumer well-being and consumer satisfaction.
The term "well-being" can be considered similar to "satisfaction". However, the current theoretical
background shows the difference between consumer satisfaction and consumer well-being. Based on Oliver's
theory of expectations (1980,1997, 2009), customer satisfaction is largely determined by customer
expectations, which becomes a strong driving force for repeat purchase, positive word of mouth and customer
loyalty (Fornell, 1992; Fornell et al., 1996; Szymanski & Henard, 2001). Of course, the goal of improving
customer satisfaction is to ensure a high level of repeat patronage, ergo sales, market share, and profit (Lee &
Sirgy, 2012).
In contrast, the concept of CWB has been shown to be a meta-level concept with many different aspects
of life, namely the link between CWB and quality of life. In other words, all the concepts and measures of
CWB presented in this thesis are based on the assumption that high level of CWB lead to higher levels of
consumer’s quality of life - higher levels of life satisfaction, overall happiness with life, reduction of disease,
increased social welfare, etc.
CWB also play a role as a bridge between satisfaction and consumer quality of life, but satisfaction does
not always lead to consumer quality of life which is determined by consumer perception of the consumption
of a product or service that enhanced quality of life in their various life domains, eg social life, work life,
leisure life, etc (Sirgy et al., 2007).
2.3.4 Tổng quan các khái niệm và nghiên cứu thực nghiệm chất lượng sống người tiêu dùng
In this section, the author will review the different experimental concepts and results of consumer wellbeing models published in previous studies. These contributions are summarized and presented in Table 2.3.
The models of consumer well-being are summarized in Table 2.3 in previous studies in marketing related
academic fields. In addition, there are other models of consumer quality of life from the public sector that the
author does not synthesize in this study because these models are only useful for public management of CWB,
not much meaning to CWB research in the field of marketing.
Table 2.2: Previous research on CWB
Contributions from the marketing sector
The Shopping Satisfaction Model (Meadow & Sirgy, 2008)
The Possession Satisfaction Model (Nakano et al., 1995; Sirgy et al., 1998a,b)
The Acquisition/Possession Satisfaction Model (Leelakulthanit et al., 1991)
The Consumer Life Cycle Model (Lee et al., 2002)
The Need Satisfaction Model (Sirgy et al., 2006b)
The Bottom-Up Spillover Model (Diener, 1984; Sirgy, 2002; Sirgy et al., 2010a,b)
The Marketers’ Orientation Model (Lee & Sirgy, 1999)
The Perceived Value Model (Sirgy et al., 2006, 2007; Grzeskowiak & Sirgy, 2008))
Source: The author synthesized from theoretical research
2.4 Consumer personality traits
Customer's personality is a stable set of characteristics and trends that lead to differences in the thoughts,
feelings and actions of each individual (Maddi, 1989). McCrae et al. (1990) were the first authors to classify
personality theory into five elements. These five elements are often called BigFive model, which are widely
used today (Yi Lin, 2010). According to Bove and Mitzifiris (2007), BigFive model provides the most concise
and complete to describe characteristics of personality. Personality traits in the Big Five model include:
Extraversion (representing sociality), Agreeableness (representing good character), Neuroticism (representing
9
emotional change), Conscientiousness (representing trust), Openness to Experience (representing the nature of
curiosity).
In measuring personality traits, most authors applied the BigFive model in most of their research models.
Bove and Mitzifiris (2007) applied the BigFive model but the authors only investigated four of the five
characteristics, namely: (1) Agreeableness, (2) Conscientiousness, (3) Extraversion, (4) Openness to
Experience. Gosling, Rentfrown and Swann (2003) provided five characteristics of personality, including: (1)
Extraversion, (2) Agreeableness, (3) Conscientiousness, (4) Neuroticism and (5) Openness to Experience with
ten observed variables. Migliore (2011) and Al-Hawari (2015) based on the personality characteristics model
of customers of Bove and Mitzifiris (2007) to build measurement variables for their research. Al-hawari (2015)
developed a scale of five customer personality traits with 28 variables of question type. In particular,
extraversion with 4 observed variables, conscientiousness with 6 observed variables, agreeableness with 6
observed variables, emotional stability with 7 observed and openness to experience with 5 observed variables.
Chapter 3: RESEARCH MODEL
3.1 Research theoretical framework
Three main drivers of customer equity, including: (1) value equity, (2) brand equity and (3) relationship
equity (Lemon et al., 2001; Leone et al., 2006; Rust et al., 2000, 2004) (see Figure 3.1).
brand equity
customer
equity
relationship
equity
value equity
Figure 3.1: Three drivers of customer equity
Three drivers of customer equity are brand equity, value equity and relationship equity that both operate
independently and both interact with each other. By improving these three drivers, companies can enhance the
overall customer equity (Rust, Lemon & Zeithaml, 2004; Hyun, 2009; Vogel et al., 2008; Ramaseshan et al.,
2013). According to Vogel et al. (2008), Hyun (2009), Ramaseshan et al. (2013), value equity is an
intermediary between brand equity and relationship equity in the concept of customer equity and impact on
relationship equity. Brand equity impacts on value equity and relationship equity (see Figure 3.2).
Value
equity
Brand
Relationship
equity
equity
Figure 3.2: Relationship between customer equity drivers
Chapter 2 has presented and evaluated the theoretical foundations of CWB. We see that there are many
different models of CWB, which model is not easy to use. However, according to Grzeskowiak and Sirgy
(2008), the model of the impact of perceived quality of life (Sirgy et al., 2006) recognized that the CWB that
relates to a specific product is a direct function of consumer perception about the impact of products on their
overall life. The perception of the impact of that quality of life is influenced by the perception of how the
product creates satisfaction in various life domains (eg work life, leisure life, social life, family life ...).
10
On that basis, the author argues that there are two important factors that the author believes it will
significantly contribute to CWB, which is value equity and relationship equity, two of the three important
drivers of customer equity. The author also hypothesizes that the causal relationship of the concepts in the
research model is moderated by customer personality traits. The theoretical framework for this research is
shown in Figure 3.3.
3.2 Research hypotheses
3.2.1 The relationship of the drivers of customer equity in the retail supermarket industry in
Vietnam
3.2.1.1 Hypothesis of the relationship between brand equity and value equity in the retail
supermarket industry in Vietnam
Hypothesis H1: The brand equity of retail supermarket positively affects the value equity of retail
supermarket.
3.2.1.2 Hypothesis of the relationship between value equity and relationship equity in the retail
supermarket industry in Vietnam
Hypothesis H2: The value equity of retail supermarket positively affects the relationship equity of retail
supermarket.
Value equity
Brand
Customer
equity
well-being
Relationship
equity
Customer personality traits
Figure 3.3: Research theoretical framework
3.2.1.3 Hypothesis of the relationship between brand equity and relationship equity in the retail
supermarket industry in Vietnam
Hypothesis H3: The brand equity of retail supermarket positively affects the relationship equity of retail
supermarket.
3.2.2 The relationship between the drivers of customer equity and CWB in the retail supermarket
industry in Vietnam.
3.2.2.1 Hypothesis of the relationship between value equity and CWB in the retail supermarket
industry in Vietnam.
Hypothesis H4: The value equity of retail supermarkets positively affects the CWB of retail
supermarkets.
3.2.2.2 Hypothesis of the relationship between relationship equity and CWB in the retail
supermarket industry in Vietnam.
Hypothesis H5: The relationship equity of the retail supermarket positively affects the CWB of retail
supermarkets.
3.2.3 Moderator effect of customer personality traits on the causal relationship of research concepts
in the retail supermarket industry.
11
Hypothesis H6a: The level of influence of the value equity of retail supermarket on the CWB of retail
supermarket is moderated by the extraversion of retail supermarket customers.
Hypothesis H7a: The level of influence of the relationship equity of retail supermarket on the CWB of
retail supermarket is moderated by the extraversion of retail supermarket customers.
Hypothesis H8a: The level of influence of the brand equity of retail supermarket on the value equity of
retail supermarket is moderated by the extraversion of retail supermarket customers.
Hypothesis H9a: The level of influence of the value equity of retail supermarket on the relationship equity
of retail supermarkets is moderated by the extraversion of retail supermarket customers.
Hypothesis H10a: The level of influence of the brand equity of retail supermarket on the relationship
equity of retail supermarket is moderated by the extraversion of retail supermarket customers.
Hypothesis H6b: The level of influence of the value equity of retail supermarket on the CWB of retail
supermarket is moderated by the conscientiousness of retail supermarket customers.
Hypothesis H7b: The level of influence of the relationship equity of retail supermarket on the CWB of
retail supermarket is moderated by the conscientiousness of retail supermarket customers.
Hypothesis H8b: The level of influence of the brand equity of retail supermarket on the value equity of
retail supermarket is moderated by the conscientiousness of retail supermarket customers.
Hypothesis H9b: The level of influence of the value equity of retail supermarket on the relationship
equity of retail supermarkets is moderated by the conscientiousness of retail supermarket customers.
Hypothesis H10b: The level of influence of the brand equity of retail supermarket on the relationship
equity of retail supermarket is moderated by the conscientiousness of retail supermarket customers.
Hypothesis H6c: The level of influence of the value equity of retail supermarket on the CWB of retail
supermarket is moderated by the agreeableness of retail supermarket customers.
Hypothesis H7c: The level of influence of the relationship equity of retail supermarket on the CWB of
retail supermarket is moderated by the agreeableness of retail supermarket customers.
Hypothesis H8c: The level of influence of the brand equity of retail supermarket on the value equity of
retail supermarket is moderated by the agreeableness of retail supermarket customers.
Hypothesis H9c: The level of influence of the value equity of retail supermarket on the relationship equity
of retail supermarkets is moderated by the agreeableness of retail supermarket customers.
Hypothesis H10c: The level of influence of the brand equity of retail supermarket on the relationship
equity of retail supermarket is moderated by the agreeableness of retail supermarket customers.
Hypothesis H6d: The level of influence of the value equity of retail supermarket on the CWB of retail
supermarket is moderated by the emotional stability of retail supermarket customers.
Hypothesis H7d: The level of influence of the relationship equity of retail supermarket on the CWB of
retail supermarket is moderated by the emotional stability of retail supermarket customers.
Hypothesis H8d: The level of influence of the brand equity of retail supermarket on the value equity of
retail supermarket is moderated by the emotional stability of retail supermarket customers.
Hypothesis H9d: The level of influence of the value equity of retail supermarket on the relationship
equity of retail supermarkets is moderated by the emotional stability of retail supermarket customers.
Hypothesis H10d: The level of influence of the brand equity of retail supermarket on the relationship
equity of retail supermarket is moderated by the emotional stability of retail supermarket customers.
Hypothesis H6e: The level of influence of the value equity of retail supermarket on the CWB of retail
supermarket is moderated by the openness to experience of retail supermarket customers.
Hypothesis H7e: The level of influence of the relationship equity of retail supermarket on the CWB of
retail supermarket is moderated by the openness to experience of retail supermarket customers.
Hypothesis H8e: The level of influence of the brand equity of retail supermarket on the value equity of
retail supermarket is moderated by the openness to experience of retail supermarket customers.
Hypothesis H9e: The level of influence of the value equity of retail supermarket on the relationship equity
of retail supermarkets is moderated by the openness to experience of retail supermarket customers.
12
Hypothesis H10e: The level of influence of the brand equity of retail supermarket on the relationship
equity of retail supermarket is moderated by the openness to experience of retail supermarket customers.
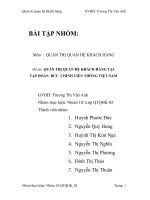
3.3 Proposed research model
3.3.1 Official research model
The formal research model consists of an independent variable of brand equity (BE); two variables both
independent and dependent are value equity (VE) and relationship equity (RE); dependent variable is consumer
well-being (CWB); moderator variables are customer personality traits (Figure 3.4).
Value equity
H4
H1
Brand equity
H2
H3
H8(a,b,c,d,e)
H9(a,b,c,d,e)
H6(a,b,c,d,e)
Consumer
well-being
H5
H7(a,b,c,d,e)
H10(a,b,c,d,e)
Relationship equity
Customer personality:
a) Extraversion
b) Conscientiousness
c) Agreeableness
d) Emotional stability
e) Openness to experience
Figure 3.4: The formal research model
3.3.2 Competitive model
In the competitive model, the research proposes a hypothesis concerning the relationship between brand
equity and CWB, see Figure 3.5.
Chapter 4: RESEARCH METHOD
4.1 Research design
4.1.1 Introduction to the research process
Research process (see Figure 4.1) and implementation schedule (see Table 4.1).
Table 4.1: Implementation schedule
The way of
Stages Research form
Method
Time
Place
performance
Focus group
1
Preliminary
Qualitative
01/2017
HCM city
discussion
2
Preliminary
Quantitative Interview
3,4/2017
HCM city
HCM city, Da Nang
3
Formal
Quantitative Interview
6,7,8/2017
& Ha Noi
4.1.2 Research Methods
4.1.2.1 Qualitative research methods
Qualitative research is carried out in the form of focus group discussions. The purpose of this research is
to clarify the factors and adjust and supplement the observed variables for draft scales 1 (see in Section 4.3).
13
Value equity
H4
H1
Brand equity
Consumer
well-being
H6
H2
H9(a,b,c,d,e)
H7(a,b,c,d,e)
H3
H10(a,b,c,d,e)
H5
H8(a,b,c,d,e)
H11(a,b,c,d,e)
Customer personality:
a) Extraversion
b) Conscientiousness
c) Agreeableness
d) Emotional stability
e) Openness to experience
Relationship equity
Figure 3.5: Competitive model
Research issues
Objectives of the research
Theoretical background (customer equity,
consumer well-being, customer personality)
Qualitative research (group discussion, two
groups, n1 = 10, n2 = 10)
Draft scales 1
Draft scales 2 (first
Preliminary quantitative research
(n = 389)
adjusted)
Complete scales
Evaluate the reliability of Cronbach alpha
and EFA scales
Formal quantitative research (n = 1089)
Model suitability test (CFA)
Moderator variable test (SEM)
Evaluate of Structural Equation Modeling
(SEM)
Results and
The meaning of research
Figure 4.1: Research process of the thesis
14
The research uses two discussion groups, one male group and one discussion group, from 22 to 35 years
old, 10 members per group. This qualitative research will be presented in detail in Section 4.4.
4.1.2.2 Quantitative research methods
Preliminary quantitative research aims to continue a preliminary assessment of the reliability and validity
of the scale and adjust it to the retail supermarket market in Vietnam. The number of research samples was
surveyed with n = 389 and follow the convenient sampling method. Subjects of the survey are customers who
have been shopping in general retail supermarkets. This research was conducted in March and April 2017 in
District 1, District 3 and District 5, Ho Chi Minh City. Formal quantitative research is conducted by direct
interview with customers. The number of reseach samples was surveyed with n = 1089 and follow the
convenient sampling method. The survey subjects are customers who have been shopping in general retail
supermarkets with the frequency of shopping at least once a month, regardless of male or female. This study
was conducted in June, July and August 2017 in Ho Chi Minh City, Da Nang and Hanoi.
4.2 Background tof building the scale
4.2.1 Scales of customer equity drivers
This research uses Vogel et al.’s (2008) scale of retail customer equity to explore, adjust and supplement
observed variables that measure three drivers of customer equity in the retail supermarket industry in Vietnam.
The measurement variables of this scales are presented in Table 4.2.
Table 4.2: Scales of three drivers of customer equity in the retail supermarket industry in Vietnam
(draft scale 1)
Concepts
Brand equity
Value equity
Relationship
equity
Measure variables
X is a strong brand.
X is an attractive brand.
X is a unique brand.
X is a likable brand.
How would you rate your overall shopping experience at X (“extremely good value/extremely poor value”) ?
The quality provided by X in relation to the price you paid for their product is very good.
The quality provided by X in relation to the price you paid for their service is very good.
For the time spent at X, would you say shopping is (“highly reasonable/highly unreasonable”) ?
For the effort involved in shopping at X, would you say shopping is (“very worthwhile/not at all worthwhile”)?
X is very attractive.
I have a high quality relationship with X. “*”
I am familiar with the employees that perform the service.
I am glad to meet other customers in X.
Employees in X know my name.
I feel loyal towards X. “*”
I am happy with the efforts that X is making towards customers like me. “*”
company
I have trust in X.
Source: Author adjusted from Vogel et al. (2008)
The observed variables are measured by the five-point Likert multivariate scales, with the convention: 1
= "strongly disagree", 2 = "disagree", 3 = "medium", 4 = "agree" and 5 = "strongly agree".
4.2.2 Scale of consumer well-being
This research uses the CWB scale of Grzeskowiak and Sirgy (2008) to explore, adjust and supplement for
the CWB scale of retail supermarket in Vietnam.
Table 4.3: Scale of CWB of retail supermarket (draft scale 1)
Does shopping at X contribute to your quality of life?
1
2
3
Measure variables
X satisfies my overall shopping needs.
X plays a very important role in my social well-being.
X plays an important role in my leisure well-being.
Source
Grzeskowiak & Sirgy (2008)
Grzeskowiak & Sirgy (2008)
Grzeskowiak & Sirgy (2008)
15
4
5
6
7
8
9
X plays an important role in my family well-being.
X plays an important role in enhancing the quality of my education life.
X plays an important role in ensuring my health and safety.
X plays an important role in my emotional well-being.
X plays an important role in my work well-being.
X plays an important role in my financial well-being.
Sirgy et al. (2006a)
Grzeskowiak & Sirgy (2008)
Sirgy et al. (2006a)
Sirgy et al. (2006a)
Sirgy et al. (2006a)
Sirgy et al. (2006a)
Source: Author adjusted from Grzeskowiak and Sirgy (2008)
The observed variables are measured by the five-point Likert multivariate scales, with the convention: 1
= "strongly disagree", 2 = "disagree", 3 = "medium", 4 = "agree" and 5 = "strongly agree".
4.2.3 Scale of customer personality
This research is based on the scale of three customer personality traits of Bove and Mitzifiris (2007) which
are extraversion, conscientiousness, agreeableness and in combination with the scale of two customer
personality traits of Al-Hawari (2015) is emotional stability and openness to experience to build a scale of
customer personality traits of retail supermarkets in Vietnam. The observed variables are measured by the fivepoint Likert multivariate scales, with the convention: 1 = "strongly disagree", 2 = "disagree", 3 = "medium", 4
= "agree" and 5 = "strongly agree".
Table 4.6: Scale of retail supermarket customer personality (draft scale 1)
Concepts
Extraversion
Conscientiousness
Agreeableness
Emotional stability
Openness to
experience
Measure variables
I am the life of the party
I don’t mind being the center of attention
I feel comfortable around people
I start conversation
I am always prepared
I pay attention to details
I get chores done right away
I like order
I follow a schedule
I am exacting in my work
I am interested in people
I sympathize with others’ feelings
I have a soft heart
I take time out for others
I feel others’ emotions
I make people feel at ease
I don’t easily get disturbed
My mood doesn’t change a lot
I don’t get irritated easily
I don’t get stressed out easily
I don’t get upset easily
I don’t have frequent mood swings
I don’t worry about things
I have a vivid imagination
I have excellent ideas
I am quick to understand things
I spend time reflecting on things
I am full of ideas
Source
Bove & Mitzifiris (2007)
Bove & Mitzifiris (2007)
Bove & Mitzifiris (2007)
Al-hawari (2015)
Al-hawari (2015)
Source: Bove and Mitzifiris (2007) and Al-hawari (2015)
4.3 Qualitative research
Qualitative research is carried out in the form of focus group discussions. The purpose of this research is
to explore, adjust and supplement the observed variables of draft scale 1.
16
4.3.1 Research design
This research uses two groups of customers who regularly buy goods from retail supermarkets in Ho Chi
Minh City (at least once a month), a group of male customers and a female group between the ages of 22 and
35. Each group of 10 members, all working and living in Ho Chi Minh City. The purpose of dividing into two
discussion groups is to assess whether there is a difference in the outcome of the discussion between men and
women. Since then, the observed variables will be adjusted to suit the general survey subjects, both male and
female. The implementation period is January 2017. How it done through group discussion outline prepared
by the author (see details in Appendix 1).
4.3.2 Results of qualitative research
4.3.2.1 Scale of brand equity (BE)
Scale of retail supermarket brand equity
BE1: X supermarket is a strong brand
BE2: X supermarket is a well-known brand
BE3: X supermarket is a unique brand
BE4: X supermarket is a attractive brand
4.3.2.2 Scale of value equity (VE)
Scale of retail supermarket value equity
VE1: You rate your overall shopping experience at X supermarket is very worthwhile.
VE2: The quality provided by X supermarket in relation to the price you paid for their product is very
good.
VE3: The quality provided by X supermarket in relation to the price you paid for their service is very
good.
VE4: For the time spent at X supermarket, you can say shopping is very reasonable.
VE5: For the effort involved in shopping at X supermarket, you can say shopping is very worthy.
VE6: The display of the X supermarket is very suitable for shopping.
4.3.2.3 Scale of relationship equity (RE)
Scale of retail supermarket relationship equity
RE1: I have a high quality relationship with X supermarket
RE2: I am familiar with the employees of X supermarket that perform the service.
RE3: I am glad to meet other customers in X supermarket.
RE4: I feel loyal towards X supermarket.
RE5: I am happy with the efforts that X supermarket is making towards customers like me
RE6: I have trust in X supermarket.
4.3.2.4 Scale of consumer well-being (CWB)
Scale of retail supermarket CWB
Does shopping at X supermarket contribute to your quality of life?
CWB1: X supermarket plays a very important role in my social well-being.
CWB2: X supermarket plays an important role in my leisure well-being.
CWB3: X supermarket plays an important role in my family well-being.
CWB4: X supermarket plays an important role in enhancing the quality of my education life.
CWB5: X supermarket plays an important role in ensuring my health and safety.
CWB6: X supermarket plays an important role in my emotional well-being.
CWB7: X supermarket plays an important role in my financial well-being.
CWB8: X supermarket satisfies my overall shopping needs.
4.3.2.5 Scales of customer personality traits
Scales of customer personality traits of retail supermarket
Extraversion
ET1: I am the life of the party
17
ET2: I don’t mind being the center of attention
ET3: I feel comfortable around people
ET4: I like talking to people
Conscientiousness
CT1: I am always prepared
CT2: I pay attention to details
CT3: I get chores done right away
CT4: I like order
CT5: I follow a schedule
CT6: I am exacting in my work
Agreeableness
AT1: I am interested in people
AT2: I sympathize with others’ feelings
AT3: I have a soft heart
AT4: I take time out for others
AT5: I feel others’ emotions
AT6: I make people feel at ease
Emotional stability
NT1: I don’t easily get disturbed
NT2: My mood doesn’t change a lot
NT3: I don’t get irritated easily
NT4: I don’t get stressed out easily
NT5: I don’t get upset easily
NT6: I am in a stable mood
NT7: I'm less worried about everything
Openness to experience
OT1: I have a vivid imagination
OT2: I have excellent ideas
OT3: I am quick to understand things
OT4: I spend time reflecting on things
OT5: I am full of ideas
4.4 Preliminary assessment of the scale
The scale of research concepts will be preliminarily tested by quantitative method with n = 389. The tool
is used to preliminarily test the scales of Cronbach's Alpha reliability factor and explore factor analysis (EFA).
Cronbach’s Alpha coefficients are firstly used to remove unsuitable variables. The item-total correlation
variables less than 0.30 will be eliminated and the criteria to select the scale when it has alpha reliability of
0.60 or higher (Nguyen Dinh Tho & Nguyen Thi Mai Trang, 2008). Next, the EFA method is used, the
variables with factor loading less than 0.40 in EFA are further eliminated. The method of extracting
coefficients is PAF (principal axis factoring) with promax rotation and stopping point when extracting factors
with eigenvalue > = 1. The scale is accepted when the total variance extracted is greater than 50% (Nguyen
Dinh Tho & Nguyen Thi Mai Trang, 2008).
The results of testing the scales of research concepts have satisfactory Cronbach’s Alpha reliability factor
(> 0.80). The item-total correlation coefficients are met (> 0.30). Results with eigenvalue> 1.0. The total
variance extracted > 50% and all factor loadings are greater than 0.50. Thus, the observed variables of this
scales are used for formal research.
Chapter 5: RESEARCH RESULTS
5.1 Formal research sample
18
Samples are selected according to the convenient sampling method. The estimated sample size is n = 1000
and is done through direct interviews with retail supermarket consumers in the three cities of Hanoi, Da Nang
and Ho Chi Minh, regardless of male or female, aged 18 and over.
To get the estimated sample size n = 1000, the number of interview questionnaires distributed was 1500.
The reason for the large number of interview questionnaires (greater than 50% of the expected sample size) is
due to the respondents must be regular customers shopping at retail supermarkets, shopping frequency is at
least one times a month. Therefore, during the interview, respondents who do not meet the shopping frequency
requirements will be disqualified immediately with the clarification question at the top of each questionnaire.
The results of 207 questionnaires were disqualified during the interview process because they did not meet the
above shopping frequency. The number of questionnaires that were not collected (because the respondent did
not return the answer sheet) was 59 copies. The total number of r questionnaires collected was 1234. After
checking, there are 147 questionnaires that do not meet the requirement due to the blank answer so they will
be rejected. Finally there are 1087 completed questionnaires used.
Table 5.1: Description of sample characteristics
Contents
Age
18 - < 24
25 - < 31
32 - < 38
39 - < 45
46 - < 55
> = 55
Total
Income
< 5 triệu
5 - < 8 triệu
8 - < 10 triệu
10 - < 15 triệu
> = 15 triệu
Total
Sex
Male
Female
Total
Survey area
Ho Chi Minh
Ha Noi
Da Nang
Total
Frequency
Ratio (%)
Accumulation rate (%)
323
393
199
103
51
18
1087
29.71
36.15
18.31
9.48
4.69
1.66
100.00
29.71
65.87
84.18
93.65
98.34
100.00
333
357
220
114
63
1087
30.63
32.84
20.24
10.49
5.80
100.00
30.63
63.48
83.72
94.20
100.00
462
625
1087
42.50
57.50
100.00
42.50
100.00
374
423
290
1087
34.41
34.41
38.91
73.32
26.68
100.00
100.00
Source: From the data processing results collected
5.2 Evaluating the reliability of the scale
5.2.1 Evaluating the reliability of the scale with Cronbach’s Alpha
5.2.1.1 Cronbach’s alpha evaluation of the scales of customer equity drivers and CWB.
Cronbach Alpha results of the scales of customer equity components and consumer well-being show that
all scales are reliable. The item-total correlation coefficients are high (> 0.50). Cronbach Alpha of all scales is
also high, the specific results: the scale of value equity scale is 0.893, the scale of brand equity is 0.882, the
scale of relationship equity is 0.913 and the scale of CWB is 0.925. Therefore, all observed variables of the
scales are used to analyze the EFA in the next section.
5.2.1.2 Cronbach’s alpha evaluation of the scales of customer personality traits.
Cronbach Alpha results of the scales of five customer personality traits show that scales are reliable. The
item-total correlation coefficients are high (> 0.50). Cronbach Alpha of the scales is also high, the specific
results: the extraversion scale is 0.817, the conscientiousness scale is 0.875, the agreeableness scale is 0.888,
the emotional stability scale is 0.887 and the scale of openness to experience is 0.847 (see Table 5.3).
Therefore, all observed variables of the scales are used to analyze the EFA in the next section.
19
5.2.2 Evaluating the reliability of the scale with EFA
5.2.2.1 EFA evaluation of the scales of customer equity drivers and CWB.
After analyzing the exploratory factors EFA (using the factoring method of extracting principal axis with
promax rotation). The results show that there are four factors extracted at the eigenvalue of 1.49, the extractable
variance is 60.04% (the variables in the model are able to exactly explain 60.04%) and KMO is 0.94. The
extracted variance and KMO met the requirements. In addition, the factor loading coefficients of the observed
variables is high and satisfactory (> 0.50), the lowest is observed variable VE3 = 0.63. Thus, after analyzing
EFA, there are four factors and 24 observed variables, perceived value has six observed variables, brand equity
has four observed variables, relationship equity has six observed variables and CWB has eight observed
variables.
5.2.2.2 EFA evaluation of the scales of customer personality traits
EFA results show that there are five factors extracted at the eigenvalue of 1.05, the extractable variance
is 56.2% (the variables in the model are able to exactly explain 56.2%) and KMO is 0.94. The extracted
variance and KMO met the requirements. In addition, the factor loading coefficients of the observed variables
is high and satisfactory (> 0.5), the lowest is the observed variable ET4 = 0.60. Thus, after analyzing EFA, the
scales of customer personality traits has five elements and 28 observed variables, the extraversion has four
observed variables, the conscientiousness has six observed variables, the agreeableness has six observed
variables, the emotional stability has seven observed variables and the openness to experience has eight
observed variables.
5.2.3 Evaluating the reliability of the scale with CFA
5.2.3.1 The scale of value equity
The value equity scale is measured by six observed variables. After the CFA test, the observed variables
have the required weights (> 0.50), the lowest is VE3 variable with 0.69 and all have statistical significance
with p = 0.00. The weighted average value is 0.75. CFA results show that this model has a degree of conformity
with market data with Chi-square is 0.815, df is 3 and the value of p = 0.85 (> 0.05). Other measurement
criterias are also satisfactory with GFI is 1.000, TLI is 1.000, CFI is 1.000, CMIN/df is 0.27 and RMSEA is
0.000. Thus, the observed variables used to measure the concept of value equity achieve convergent value. The
composite reliability (CR) is 0.89 and the average variance extracted (AVE) is 56.8%. Thus, this scale
achieves reliability and extracted variance.
5.2.3.2 The scale of brand equity
The scale of brand equity is measured by four observed variables. After the CFA test, the observed
variables have the required weights (> 0.50), the lowest is BE4 variable with 0.66 and is statistically significant
with p = 0.00. The weighted average value is 0.724. CFA results show that this model has a suitable level with
market data with Chi-square is 2,637, df is 2 and p = 0,267 (> 0,05). Other measurement criterias are also
satisfactory with GFI is 0.999, TLI is 0.999, CFI is 1.000, CMIN/df is 1.319 and RMSEA is 0.017. Thus, the
observed variables used to measure the concept of brand equity achieve convergent value. The CR is 0.816
and the AVE is 52.3%. Thus, this scale achieves reliability and extracted variance.
5.2.3.3 The scale of relationship equity
The relationship equity scale is measured by six observed variables. After the CFA test, the observed
variables all have the required weights (> 0.50), the lowest is RE2 variable with 0.729 and is statistically
significant with p = 0.00. The weighted average value is 0.78. Thus, the observed variables used to measure
the concept of relationship equity achieve convergent value. CFA results show that this model has a degree of
conformity with market data with Chi-square is 1.702, df is 4 and p is 0,79 (> 0,05). Other measurement
criterias are also satisfactory with GFI is 0.999, TLI is 1.000, CFI is 1.000, CMIN/df is 0.426 and RMSEA is
0.000. The CR is 0.90 and the AVE is 61.2%. Thus, this scale achieves reliability and extracted variance.
5.2.3.4 The scale of CWB
The scale of CWB is measured by eight observed variables. After the CFA test, the observed variables
have the required weights (> 0.50), the lowest is CWB6 variable with 0.70 and all have statistical significance
20
with p = 0.00. The weighted average value is 0.76. Thus, the observed variables used to measure the concept
of CWB achieve convergence value. CFA results show that this model has a suitable level with market data
with Chi- square is 13.62, df is 10 and p is 0.191 (> 0.05). Other measurement criterias are also satisfactory
with GFI is 0.997, TLI is 0.998, CFI is 0.999, CMIN/df is 1.36 and RMSEA is 0.018. The CR is 0.92 and the
AVE is 58.4%. Thus, this scale achieves reliability and extracted variance.
5.2.3.5 The scale of customer personality traits
CFA results of the scale model of customer personality traits have 323 degrees of freedom, Chi-square is
657.59 with p value = 0.00. However, the CFA results show that this model is consistent with market data
when the GFI, TLI, CFI, CMIN/df and RMSEA criterias are good with GFI is 0.958, TLI is 0.975, CFI is
0.979, CMIN/df is 2.036 and RMSEA is 0.031. Moreover, the weights are within the permitted standard (≥
0.50) and all are statistically significant with p is 0.00. Therefore, we can conclude the observed variables used
to measure the scale of five customer personality traits (PT) achieve convergence value. The CR of ET is 0.80
and the AVE is 50.4%; The CR of CT is 0.87 and the AVE is 52.1%; The CR AT is 0.88 and AVE is 54.9%;
The CR of NT is 0.91 and the AVE is 58.2%; and the CR of OT is 0.84 and the AVE is 52%.
Thus, the CFA results of scales in the research model, we see that all scales are valid (see Table 5.7).
Table 5.6: Summary table of results of scale test
Concepts
VE
BE
RE
CWB
ET
CT
PT AT
NT
OT
Number of
components
1
1
1
1
5
Observed
variables
6
4
6
8
4
6
6
7
5
CR
AVE
0.89
0.82
0.90
0.92
0.80
0.87
0.88
0.91
0.84
0.568
0.523
0.612
0.584
0.504
0.521
0.549
0.582
0.520
Average
weights
0.75
0.72
0.78
0.76
0.71
0.72
0.74
0.76
0.72
Validity
Qualified
Qualified
Qualified
Qualified
Qualified
Source: From the data processing results collected
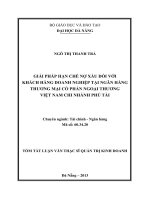
5.3 Verification of research model
5.3.1 Verification of formal research model
The results show that the model has 227 degrees of freedom with Chi-square is 435,860 with p = 0.00.
However, when adjusting the level of CMIN/df, this value is 1.920 (<2), this value is quite good (Nguyen Dinh
Tho & Nguyen Thi Mai Trang, 2002). Moreover, other conformity assessment criterias meet the requirement
with GFI is 0.968, TLI is 0.983, CFI is 0.986 and RMSEA is 0.029 (Figure 5.1). Thus, we can evaluate this
model in accordance with data collected from the market. The results show that all relationships in the model
are statistically significant (p <0.05), which is the relationship between BE and VE with p = 0.000, VE and RE
with p = 0.000, BE and RE with p = 0.000, VE and CWB with p = 0.000, RE and CWB with p = 0.000 (see
Table 5.7 for details). This results also show us that conceptual scales in the research model have a theoretical
relevance value because each measurement has a relationship with other measures as theoretically expected
(Churchill , 1995; Nguyen Dinh Tho & Nguyen Thi Mai Trang, 2008). In particular, the relationship between
RE and CWB is strongest with ML is 0.429, the relationship between BE and VE with the estimated ML value
is 0.383, the relationship between VE and RE with ML is 0.326, followed by the relationship between VE and
CWB with ML is 0.304 and finally the relationship between BE and RE with ML is 0.182.
Table 5.7: Results of verifying causal relationship in formal models (standardization)
BE
BE
VE
VE
Mối quan hệ
--->
VE
--->
RE
--->
RE
--->
CWB
ML
0.383
0.182
0.326
0.304
S.E.
0.045
0.050
0.042
0.036
C.R.
10.126
4.952
8.914
9.072
P
0.000
0.000
0.000
0.000
21
RE
--->
CWB
0.429
0.032
Note: ML: Maximum Likelihood Estimates; SE: standard error; C.R: Critical Ratios.
12.562
0.000
Source: From the data processing results collected
Source: From the data processing results collected
Figure 5.1: SEM results of theoretical model
5.3.2 Verification of competitive model
Source: From the data processing results collected
Figure 5.2: SEM results of competitive model
SEM results show that the model has 226 degrees of freedom with Chi-square is 435,822 and p = 0.00.
But other indicators of the model are consistent with market data with CMIN/df is 1,928 (<2), GFI is 0.968,
TLI is 0.983, CFI is 0.986 and RMSEA is 0.029 (Figure 5.2).
Compared to the formal research model, this model does not have much difference. If comparing Chisquare value, the difference of the two models is only 0.038 (435,860 - 435,822), and for the degrees of freedom
(df) is only 1 (227-226). Thus, this difference is not statistically significant, the competition model takes only
22
one degree of freedom but does not increase the model's compatibility with market data. Moreover, the
hypothesis is built in the competitive model (Retail supermarket brand equity has a significant impact on the
CWB of retail supermarkets) is not statistically significant with p = 0.846 (> 0.05) (see Table 5.8 for details).
Therefore, research does not accept this hypothesis.
Table 5.8: Results of verifying causal relationship in competitive models (standardization)
Mối quan hệ
ML
S.E.
C.R.
P
BE
--->
VE
0.383
0.045
10.126
0.000
BE
--->
RE
0.182
0.050
4.952
0.000
VE
--->
RE
0.326
0.042
8.914
0.000
VE
--->
CWB
0.304
0.036
9.072
0.000
RE
--->
CWB
0.429
0.032
12.562
0.000
BE
--->
CWB
0.006
0.042
0.195
0.846
Note: ML: maximum likelihood estimates; SE: standard error; C.R: critical ratios.
Source: From the data processing results collected
5.4 Estimating models with Bootstrap
Bootstrap is the sampling method of replaced repetition that the original sample as a crowd.
Table 5.9: Results of estimating Bootstrap with N = 2000
ML estimation
Bootstrap estimation
ML
SE
M
SE
SE(SE)
Bias
SE(Bia)
C.R
BE ----> VE
0,383
0,045
0,3830
0,037
0,001
0,0000
0,001
0,000
BE ----> RE
0,182
0,050
0,1830
0,041
0,001
0,0010
0,001
1,000
VE ----> RE
0,326
0,042
0,3250
0,039
0,001
-0,0010
0,001
-1,000
VE ----> CWB
0,304
0,036
0,3025
0,038
0,001
-0,0015
0,001
-1,500
RE ----> CWB
0,429
0,032
0,4300
0,036
0,001
0,0010
0,001
1,000
Note: ML: maximum likelihood estimates; M: average bootstrap estimates; SE: standard error; SE(SE): standard
error of standard error; Bias: bias; SE(Bias): standard error of bias. C.R: critical ratios.
Source: From the data processing results collected
Relationships
5.5 Testing the moderator role of customer personality traits on causal relationships in the research
model
The concept of customer personality in this study consists of five traits, including (1) extraversion, (2)
conscientiousness, (3) greeableness, (4) emotional stability and (5) openness to experience. Test results see
Table 5.10.
Table 5.10: The results of testing moderator variable on causal relationships in the research model
CWB
CWB
CWB
CWB
CWB
CWB
CWB
CWB
CWB
CWB
VE
VE
VE
VE
VE
RE
RE
RE
RE
RE
RE
Mối quan hệ
<--ET_x_VE
<--CT_x_VE
<--AT_x_VE
<--NT_x_VE
<--OT_x_VE
<--ET_x_RE
<--CT_x_RE
<--AT_x_RE
<--NT_x_RE
<--OT_x_RE
<--CT_x_BE
<--AT_x_BE
<--NT_x_BE
<--OT_x_BE
<--ET_x_BE
<--ET_x_VE
<--CT_x_VE
<--AT_x_VE
<--NT_x_VE
<--OT_x_VE
<--AT_x_BE
ML
-0.007
0.023
0.080
0.018
-0.036
-0.001
0.052
0.045
-0.009
-0.024
-0.042
0.015
0.007
-0.029
0.009
0.069
-0.027
0.030
0.055
-0.031
-0.041
S.E.
0.024
0.022
0.023
0.023
0.023
0.022
0.022
0.020
0.020
0.023
0.022
0.021
0.021
0.024
0.021
0.026
0.024
0.025
0.024
0.025
0.024
C.R.
-0.291
1.076
3.481
0.778
-1.586
-0.039
2.315
2.266
-0.450
-1.070
-1.919
0.711
0.328
-1.222
0.415
2.663
-1.162
1.196
2.269
-1.254
-1.727
P
0.771
0.282
0.000
0.437
0.113
0.969
0.021
0.023
0.653
0.285
0.055
0.477
0.743
0.222
0.678
0.008
0.245
0.232
0.023
0.210
0.084
23
RE
<--OT_x_BE
-0.006
0.027
-0.215
0.830
RE
<--ET_x_BE
0.023
0.023
1.007
0.314
RE
<--NT_x_BE
0.044
0.023
1.918
0.055
RE
<--CT_x_BE
0.039
0.024
1.607
0.108
Note: ML: maximum likelihood estimates; SE: standard error; C.R: critical ratios.
Source: From the data processing results collected
5.8 Verification of research hypotheses
This research has thirty hypotheses that need to be verified, symbols H1, H2, H3, H4, H5, H6a, H6b, H6c,
H6d, H6e, H7a, H7b, H7c, H8b, H8c, H8d, H8e, , H9a, H9b, H9c, H9d, H9e, H10a, H10b, H10c, H10d, H10e.
There are 10 accepted hypotheses (H1, H2, H3, H4, H5, H6c, H7b, H7c, H9a and H9d) and 20 unacceptable
hypotheses (H6a, H6b, H6d, H6e, H7a, H7d , H7e, H8a, H8b, H8c, H8d, H8e, H9b, H9c, H9e, H10a, H10b,
H10c, H10d, H10e). Specific results of accepted hypotheses see Table 5.11.
Table 5.11: Summary of accepted hypothesis test results
No.
1
2
3
4
5
6
7
8
9
10
Hypothesis
ML
S.E.
P
Results
0.045
0.000
Accepted
H1 (Impact of the relationship between BE and VE)
0.383
Accepted
0.182
0.050
0.000
H2 (Impact of the relationship between BE and RE)
Accepted
0.326
0.042
0.000
H3 (Impact of the relationship between VE and RE)
Accepted
0.304
0.036
0.000
H4 (Impact of the relationship between VE and CWB)
Accepted
0.429
0.032
0.000
H5 (Impact of the relationship between RE and CWB)
Accepted
0.080
0.023
0.000
H6c (Moderator impact of AT on VE and CWB)
Accepted
0.052
0.022
0.021
H7b (Moderator impact of CT on RE and CWB)
Accepted
0.045
0.020
0.023
H7c (Moderator impact of AT on RE and CWB)
Accepted
0.069
0.026
0.008
H9a (Moderator impact of ET on VE and RE)
Accepted
0.055
0.024
0.023
H9d (Moderator impact of NT on VE and RE)
Note: ML: maximum likelihood estimates; SE: standard error; C.R: critical ratios.
Source: From the data processing results collected
Chapter 6: CONCLUSION
6.1 Main results and contributions of the study
6.1.1 Measurement models
Firstly, the measurement scales in this study will contribute to the scale system of customer equity
components, consumer well-being and customer personality traits which had in the world by adding a
measurement scale system in Vietnam market. Secondly, the observed variables used to measure the scales in
this study can be adjusted and supplemented to suit each market, industry and brand. Thirdly, the results of
this study also show managers the difference between measuring customer equity and value equity. The results
show that value equity scales are an important measurement component of customer equity. Fourthly, the
results of the measurement model show that the measurement scales in the study must be re-evaluated for their
validity and reliability when using them to measure in other studies and new markets.
6.1.2 Theoretical model
6.1.2.1 Theoretical contributions
The theoretical contributions of the research: Firstly, this research has reviewed relatively complete
and systematic theories of the study. Secondly, this research has produced a theoretical framework and
proposed a research model in the retail supermarket industry in Vietnam. Thirdly, this research also shows that
investment to improve customer equity drivers not only contributes to increasing customer equity for
businesses but also contributes to improving consumer well-being.
The meaning of the relationship of three customer equity drivers: Firstly, the research results show
that the value equity of retail supermarkets is an intermediate component between retail supermarket brand
equity and the relationship equity of retail supermarket in the structure of the relationship between the three
drivers of customer equity. The value equity of retail supermarkets directly affects the relationship equity of
retail supermarket and contributes to enhancing the relationship equity of retail supermarket. These are the
factor that contributes to the customer's perception of the relationship strength that they have from retail