Bookflare net statistics without maths for psychology, 7th edition
Bạn đang xem bản rút gọn của tài liệu. Xem và tải ngay bản đầy đủ của tài liệu tại đây (16.49 MB, 634 trang )
SEVENTH EDITION
Statistics
without Maths
for Psychology
Christine Dancey
and John Reidy
Statistics Without Maths for Psychology
British Psychological Society standards in Quantitative
Methods in Psychology
The British Psychological Society (BPS) accredits psychology degree programmes across
the UK. It has set guidelines as to which major topics should be covered within quantitative
methods in psychology. We have listed these topics below and indicated where in this
textbook each is covered most fully.
BPS guidelines on the teaching of quantitative methods in psychology
Which chapters?
Descriptive and summary statistics
3, 4 and 5
Probability theory
4 and 5
The normal distribution
3, 4 and 5
Statistical inference
4 and 5
Confidence intervals
4
Mean and error bar graphs
4
Non-parametric alternatives to t-tests
16
Tests of proportions
9
Cramer’s Phi as a measure of association in contingency tables
—
McNemar’s test of change
—
Bivariate correlation and linear regression
6 and 12
The analysis of variance
10, 11 and 15
Non-parametric alternatives to one factor analyses of variance
16
The choice of an appropriate statistical analysis
5
Statistics
Without Maths
for Psychology
Seventh Edition
Christine P. Dancey
John Reidy
University of East London
Sheffield Hallam University
Harlow, England • London • New York • Boston • San Francisco • Toronto • Sydney
Dubai • Singapore • Hong Kong • Tokyo • Seoul • Taipei • New Delhi
Cape Town • São Paulo • Mexico City • Madrid • Amsterdam • Munich • Paris • Milan
PEARSON EDUCATION LIMITED
Edinburgh Gate
Harlow CM20 2JE
United Kingdom
Tel: +44 (0)1279 623623
Web: www.pearson.com/uk
First published 1999 (print)
Second edition 2002 (print)
Third edition 2004 (print)
Fourth edition 2008 (print)
Fifth edition 2011 (print)
Sixth edition 2014 (print and electronic)
Seventh edition published 2017 (print and electronic)
© Pearson Education Limited 1999, 2002, 2004, 2008, 2011 (print)
© Pearson Education Limited 2014, 2017 (print and electronic)
The rights of Christine P. Dancey and John Reidy to be identified as authors of this work have been asserted
by them in accordance with the Copyright, Designs and Patents Act 1988.
The print publication is protected by copyright. Prior to any prohibited reproduction, storage in a retrieval
system, distribution or transmission in any form or by any means, electronic, mechanical, recording or
otherwise, permission should be obtained from the publisher or, where applicable, a licence permitting
restricted copying in the United Kingdom should be obtained from the Copyright Licensing Agency Ltd,
Barnard’s Inn, 86 Fetter Lane, London EC4A 1EN.
The ePublication is protected by copyright and must not be copied, reproduced, transferred, distributed,
leased, licensed or publicly performed or used in any way except as specifically permitted in writing by the
publishers, as allowed under the terms and conditions under which it was purchased, or as strictly permitted
by applicable copyright law. Any unauthorised distribution or use of this text may be a direct infringement of
the authors’ and the publisher’s rights and those responsible may be liable in law accordingly.
All trademarks used herein are the property of their respective owners. The use of any trademark in this text
does not vest in the author or publisher any trademark ownership rights in such trademarks, nor does the
use of such trademarks imply any affiliation with or endorsement of this book by such owners.
The screenshots in this book are reprinted by permission of Microsoft Corporation.
Pearson Education is not responsible for the content of third-party internet sites.
ISBN: 978-1-292-12885-6 (print)
978-1-292-12889-4 (PDF)
978-1-292-13027-9 (ePub)
British Library Cataloguing-in-Publication Data
A catalogue record for the print edition is available from the British Library
Library of Congress Cataloging-in-Publication Data
Dancey, Christine P., author. | Reidy, John, author.
Statistics without maths for psychology / Christine P. Dancey, University of East London,
John Reidy, Sheffield Hallam University.
Seventh Edition. | New York : Pearson, [2017] | Revised edition of the authors'
Statistics without maths for psychology, 2014.
LCCN 2016059329| ISBN 9781292128856 (print) | ISBN 9781292128894 (pdf)
ISBN 9781292130279 (epub)
LCSH: SPSS for Windows. | Mathematical statistics. | Psychology--Statistical methods.
LCC BF39 .D26 2017 | DDC 150.1/5195--dc23
LC record available at />10 9 8 7 6 5 4 3 2 1
21 20 19 18 17
Print edition typeset in 10/12pt Times New Roman PS Pro by SPi Global
Printed in Slovakia by Neografia
NOTE THAT ANY PAGE CROSS REFERENCES REFER TO THE PRINT EDITION
Christine would like to dedicate this book to Donna Wiles and Linda Perkins. Our close friendship
and support for each other is very important to me. You are both strong, beautiful and fantastic
people. Thanks a million, for everything.
John would like to dedicate this book to Ollie … super schnotz (100% Schnauzer)
Brief contents
1
2
3
4
5
6
7
8
9
10
11
12
13
14
15
16
Preface
Guided tour
Acknowledgements
xvi
xx
xxii
Variables and research design
Introduction to SPSS
Descriptive statistics
Probability, sampling and distributions
Hypothesis testing and statistical significance
Correlational analysis: Pearson’s r
Analyses of differences between two conditions: the t-test
Issues of significance
Measures of association
Analysis of differences between three or more conditions
Analysis of variance with more than one IV
Regression analysis
Analysis of three or more groups partialling out effects of a covariate
Introduction to factor analysis
Introduction to multivariate analysis of variance (MANOVA)
Non-parametric statistics
1
25
42
97
134
174
217
246
265
298
328
377
414
446
481
516
Answers to activities and SPSS exercises
Appendix 1: Table of z-scores and the proportion of the standard normal
distribution falling above and below each score
Appendix 2: Table r to zr
551
592
595
Index
597
Contents
Preface
Guided tour
Acknowledgements
1 Variables and research design
1.1
1.2
1.3
1.4
1.5
Chapter overview
Why teach statistics without mathematical formulae?
Variables
Levels of measurement
Research designs
Between-participants and within-participants designs
Summary
Multiple choice questions
References
Answers to multiple choice questions
2 Introduction to SPSS
2.1
2.2
2.3
2.4
2.5
2.6
2.7
Chapter overview
Basics
Starting SPSS
Working with data
Data entry
Saving your data
Inputting data for between-participants and within-participants designs
Within-participants designs
Summary
SPSS exercises
3 Descriptive statistics
3.1
3.2
Chapter overview
Samples and populations
Measures of central tendency
xvi
xx
xxii
1
1
1
3
7
8
16
20
21
24
24
25
25
25
25
30
31
34
36
39
40
40
42
42
42
45
x
Contents
3.3
3.4
3.5
3.6
3.7
3.8
3.9
3.10
3.11
Sampling error
SPSS: obtaining measures of central tendency
Graphically describing data
SPSS: generating graphical descriptives
Scattergrams
SPSS: generating scattergrams
Sampling error and relationships between variables
The normal distribution
Variation or spread of distributions
SPSS: obtaining measures of variation
Other characteristics of distributions
Non-normal distributions
SPSS: displaying the normal curve on histograms
Writing up your descriptive statistics
Summary
SPSS exercises
Multiple choice questions
References
Answers to multiple choice questions
4 Probability, sampling and distributions
4.1
4.2
4.3
4.4
4.5
4.6
4.7
4.8
Chapter overview
Probability
The standard normal distribution
Applying probability to research
Sampling distributions
Confidence intervals and the standard error
SPSS: obtaining confidence intervals
Error bar charts
Overlapping confidence intervals
SPSS: generating error bar charts
Confidence intervals around other statistics
Summary
SPSS exercises
Multiple choice questions
References
Answers to multiple choice questions
5 Hypothesis testing and statistical significance
5.1
5.2
5.3
5.4
5.5
5.6
5.7
Chapter overview
Another way of applying probabilities to research: hypothesis testing
Null hypothesis
Logic of null hypothesis testing
The significance level
Statistical significance
The correct interpretation of the p-value
Statistical tests
50
53
56
66
68
70
71
73
76
80
81
82
88
90
90
91
92
95
96
97
97
97
101
108
108
111
120
121
122
124
127
127
128
130
133
133
134
134
134
139
140
142
144
146
147
Contents
5.8
5.9
5.10
5.11
5.12
Type I error
Type II error
Why set α at 0.05?
One-tailed and two-tailed hypotheses
Assumptions underlying the use of statistical tests
SPSS: Statistics Coach
Summary
SPSS exercises
Multiple choice questions
References
Answers to multiple choice questions
6 Correlational analysis: Pearson’s r
6.1
6.2
6.3
Chapter overview
Bivariate correlations
SPSS: bivariate correlations – Pearson’s r
SPSS: obtaining a scattergram matrix
First- and second-order correlations
SPSS: partial correlations – Pearson’s r
Patterns of correlations
Summary
SPSS exercise
Multiple choice question
References
Answers to multiple choice questions
7 Analyses of differences between two
conditions: the t-test
7.1
Chapter overview
Analysis of two conditions
SPSS: for an independent t-test
SPSS: two samples repeated-measures design – paired t-test
Summary
SPSS exercise
Multiple choice questions
References
Answers to multiple choice questions
8 Issues of significance
8.1
8.2
8.3
8.4
Chapter overview
Criterion significance levels
Effect size
Power
Factors influencing power
xi
148
150
151
151
156
163
167
167
169
172
173
174
174
175
188
197
200
201
208
209
210
211
215
216
217
217
218
228
234
239
240
241
245
245
246
246
246
251
251
252
xii
Contents
8.5
8.6
Calculating power
Confidence intervals
Summary
Multiple choice questions
References
Answers to multiple choice questions
9 Measures of association
9.1
9.2
9.3
9.4
Chapter overview
Frequency (categorical) data
One-variable x2 or goodness-of-fit test
SPSS: one-variable x2
SPSS: one-variable x2 – using frequencies different from those expected
under the null hypothesis
x2 test for independence: 2 * 2
SPSS: 2 * 2 x2
x2 test of independence: r * c
Summary
SPSS exercises
Multiple choice questions
References
Answers to multiple choice questions
10 Analysis of differences between three
or more conditions
10.1
10.2
10.3
10.4
10.5
10.6
10.7
Chapter overview
Visualising the design
Meaning of analysis of variance
SPSS: performing a one-way ANOVA
Descriptive statistics
Planned comparisons
Controlling for multiple testing
Post-hoc tests
Repeated-measures ANOVA
SPSS: instructions for repeated-measures ANOVA
Summary
SPSS exercises
Multiple choice questions
References
Answers to multiple choice questions
11 Analysis of variance with more than one IV
11.1
11.2
11.3
Chapter overview
Introduction
Sources of variance
Designs suitable for factorial ANOVA
256
258
259
260
263
264
265
265
265
267
269
273
276
279
285
290
290
292
297
297
298
298
299
300
305
307
308
309
309
312
313
319
320
321
327
327
328
328
328
329
331
Contents
11.4
11.5
11.6
11.7
ANOVA terminology
Two between-participants independent variables
SPSS: analysis of two between-participants factors
Two within-participants variables
SPSS: ANOVA with two within-participants factors
One between- and one within-participants variable
SPSS: ANOVA with one between-participants factor and one within-participants factor
Summary
SPSS exercises
Multiple choice questions
References
Answers to multiple choice questions
12 Regression analysis
12.1
12.2
Chapter overview
The purpose of linear regression
SPSS: drawing the line of best fit
SPSS: linear regression analysis
Multiple regression
Summary
SPSS exercises
Multiple choice questions
References
Answers to multiple choice questions
13 Analysis of three or more groups partialling
out effects of a covariate
13.1
13.2
Chapter overview
SPSS: obtaining a chart of regression lines
Pre-existing groups
Pretest–posttest designs
SPSS: obtaining output for an ANCOVA
Summary
SPSS exercise
Multiple choice questions
References
Answers to multiple choice questions
14 Introduction to factor analysis
14.1
14.2
14.3
14.4
14.5
Chapter overview
What is the purpose of factor analysis?
The two main types of factor analysis
Use of factor analysis in psychometrics
Visualising factors
Conceptualising factor analysis
xiii
332
333
346
351
359
362
368
370
370
372
376
376
377
377
377
380
391
398
407
407
409
413
413
414
414
416
422
428
432
440
440
441
445
445
446
446
446
448
448
449
450
xiv
Contents
14.6
14.7
14.8
14.9
14.10
14.11
14.12
14.13
14.14
Naming the factors
Loadings of variables on factors
The correlational matrix
The unrotated and rotated matrices
Plotting the variables in factor space
Rotating the matrix
Steps taken in performing a factor analysis
Use of factors or components in further analyses
The meaning of negative loadings
SPSS: factor analysis – principal components analysis
Summary
Multiple choice questions
References
Answers to multiple choice questions
15 Introduction to multivariate analysis of
variance (MANOVA)
15.1
15.2
15.3
15.4
15.5
15.6
15.7
15.8
15.9
15.10
Chapter overview
Multivariate statistics
Why use multivariate analyses of variance?
Multivariate analysis of variance
Logic of MANOVA
Assumptions of MANOVA
Which F-value?
Post-hoc analyses of individual DVs
Correlated DVs
How to write up these analyses
SPSS: conducting MANOVA with one between-participants IV and two DVs
Within-participants designs
SPSS: one within-participants IV and two DVs
Summary
SPSS exercises
Multiple choice questions
References
Recommended texts
Answers to multiple choice questions
16 Non-parametric statistics
16.1
16.2
Chapter overview
Alternative to Pearson’s r: Spearman’s rho
SPSS: correlational analysis – Spearman’s rho
SPSS exercise
Alternatives to the t-test: Mann–Whitney and Wilcoxon
SPSS: two-sample test for independent groups – Mann–Whitney
SPSS exercise
SPSS: two-sample test for repeated measures – Wilcoxon
SPSS exercise
452
453
455
456
457
459
462
466
467
468
476
476
480
480
481
481
481
482
482
483
485
489
490
492
493
494
496
503
506
506
508
515
515
515
516
516
517
517
521
521
523
527
530
535
Contents
16.3
xv
Alternatives to ANOVA
SPSS: independent samples test for more than two conditions – Kruskal–Wallis
SPSS exercise
SPSS: repeated-measures test for more than two conditions – Friedman’s test
SPSS exercise
Summary
Multiple choice questions
References
Answers to multiple choice questions
535
536
540
542
544
545
545
550
550
Answers to activities and SPSS exercises
Appendix 1: Table of z-scores and the proportion of the standard normal
distribution falling above and below each score
Appendix 2: Table r to zr
551
Index
597
Companion Website
For open-access student resources specifically written
to complement this textbook and support your learning,
please visit www.pearsoned.co.uk/dancey
ON THE
WEBSITE
Lecturer Resources
For password-protected online resources tailored to support the
use of this textbook in teaching, please visit
www.pearsoned.co.uk/dancey
592
595
Preface
It seems incredible to us that it is now 18 years since our book was first published. We have
been amazed at how well the book has been received and thankful for the kind words tutors and
students alike have said about it. In this seventh edition of the book we have kept true to our
vision for the book to provide conceptual explanations of statistical concepts without making
you suffer through the formulae. We have built upon the strengths of the previous editions and
updated our examples from the literature, updated some of the practical exercises, provided
reflections from authors of published research and responded, with revised explanations, to a
number of reviewers who kindly provided feedback on the sixth edition.
We wrote this book primarily for our students, most of whom disliked mathematics, and could
not understand why they had to learn mathematical formulae when their computer software
performed the calculations for them. They were not convinced by the argument that working
through calculations gave them an understanding of the test – neither were we. We wanted them
to have a conceptual understanding of statistics and to enjoy data analysis. Over the past 20 years
we have had to adapt our teaching to large groups of students, many of whom have no formal
training in mathematics. We found it was difficult to recommend some of the traditional statistics
textbooks – either they were full of mathematical formulae, and perceived by the students as dull
or boring, or they were simple, statistical cookbook recipes, which showed them how to perform
calculations, but gave them no real understanding of what the statistics meant. We therefore
decided to write this book, which seeks to give students a conceptual understanding of statistics
while avoiding the distraction of formulae and calculations.
Another problem we found with recommending statistics textbooks was the over-reliance on
the probability value in the interpretation of results. We found it difficult to convince them to
take effect size, and confidence intervals, into consideration when the textbooks that were
available made no mention of the debates around hypothesis testing, but simply instructed
students to say p 6 0.05 is significant and p 7 0.05 is not significant! We hope in writing this
book that students will become more aware of such issues.
We also wanted to show students how to incorporate the results of their analysis into
laboratory reports, and how to interpret results sections of journal articles. Until recently,
statistics books ignored this aspect of data analysis. Of course, we realise that the way we have
written our example ‘results sections’ will be different from the way that other psychologists
would write them. Students can use these sections to gain confidence in writing their own
results, and hopefully they will build on them, as they progress through their course.
We have tried to simplify complex, sometimes very complex, concepts. In simplifying, there
is a trade-off in accuracy. We were aware of this when writing the book, and have tried to be as
accurate as possible, while giving the simplest explanation. We are also aware that some students
do not use SPSS (an IBM company*) for their data analysis. IBM® SPSS® Statistics, however,
*
SPSS was acquired by IBM in October 2009.
Preface
xvii
is the most commonly used statistical package for the social sciences, and this is why the text
is tied so closely to SPSS. Students not using this package should find the book useful anyway.
This edition of the book has been updated for use with SPSS version 23 and earlier.
As with the sixth edition of the book we have included information about the authors of
articles which we have drawn upon in the writing of this book – and have included photos of
them where possible – strictly with their permission, of course. We also asked them why they
had chosen their particular research topic, and whether they had encountered any problems in
the running of the experiment/study. We thought this would enrich the text. Although we have
updated many examples from the literature, we have left in some early studies because they
illustrate exactly the points made in the text. Some reviewers thought there should be more
challenging activities and/or multiple choice questions. Therefore, we have added activities
which are based on examples from the literature, and require students to interpret the material,
in their own words. They can then compare their interpretation with the authors’
interpretation.
We hope that students who read the book will not only learn from it, but also enjoy our
explanations and examples. We also hope that as a result of reading this book students will feel
confident in their ability to perform their own statistical analyses.
How to use this book
To help you get the most from this book we thought that it would be useful to provide a brief
overview of the book and of the structure of the chapters. The best way to use the book if you
are new to statistics in psychology or if you have been away from statistics for a long while is
to work your way through the chapters from Chapter 1 onwards. The most important chapters
to read and ensure that you understand fully are the first five chapters as these provide you with
the core concepts for comprehending the main statistical techniques covered later in the book.
If you spend the time and effort on these opening chapters then you will be rewarded by having
a better understanding of what the statistical tests are able to tell us about our data. We cannot
stress enough the importance of such an understanding for appropriate use of statistical
techniques and for your ability to understand and critique others’ use of such techniques.
The chapters that follow these opening chapters generally explain the concepts underlying
specific types of tests as well as how to conduct and interpret the findings from these. We start
off with the more basic tests which look at the fewest possible variables (‘variables’ will be
explained in Chapter 1) and then using these as a basis we move on to the more complex tests
later in the book. In some ways it might be better to read about a basic type of test, say simple
correlations (see Chapter 6), and then move on to the more complex versions of these tests, say
regression and multiple regression (see Chapter 12). As another example, start with simple tests
of differences between two groups (in Chapter 7) and then move on to tests of differences
between more than two groups (Chapters 10 and 11). However, often statistics modules don’t
follow this sort of pattern but rather cover all of the basic tests first and only then move on to
the complex tests. In such a learning pattern there is the danger that to some extent some of the
links between the simple and complex tests may get lost.
Rather disappointingly we have read some reviews of the book which focus entirely on the
step-by-step guides we give to conducting the statistical analyses with SPSS for Windows (now
called SPSS Statistics). We would like to stress that this book is not simply a ‘cookbook’ for
how to run statistical tests. If used appropriately you should come out with a good understanding
of the statistical concepts covered in the book as well as the skills necessary to conduct the
analyses using SPSS Statistics. If you already have a conceptual understanding of the statistical
techniques covered in the book then by all means simply follow the step-by-step guide to
carrying out the analyses, but if you are relatively new to statistics you should ensure that you
read the text so that you understand what the statistical analyses are telling you.
xviii
Preface
There are a number of features in this book to help you learn the concepts being covered
(in technical terms these are called ‘pedagogic’ features). These are explained below, but before
we explain these we will give you a general overview of what to expect in each chapter.
In each chapter we will highlight what is to come and then we will explain the statistical
concepts underlying the particular topics for that chapter. Once we have covered the statistical
concepts you will be given step-by-step guides to conducting analyses using SPSS Statistics.
Towards the end of each chapter you will be provided with a means of testing your knowledge,
followed by some pointers to further reading. We will now describe some of the features found
in the chapters in more detail.
At the beginning of every chapter there is a Chapter overview. These overviews provide you
with information about what is contained in each chapter and what you should have achieved
from working through it. Sometimes we will also highlight what you need to know beforehand
to be able to get the most from the chapter. You should make sure that you read these (it is very
easy to get into the habit of not doing this) as they will set the scene for you and prepare your
mind for the concepts coming up in the book.
At the end of each chapter there are Summaries which outline the main concepts that were
covered. These are important for consolidating what you have learnt and help put the concepts
learnt later in the chapter back in the context of the earlier concepts. You will also find SPSS
Statistics exercises, activities and multiple choice questions. We cannot stress enough the
importance of working through these when you finish each chapter. They are designed to test
your knowledge and to help you actively work with the information that you have learnt.
The best way to learn about things is to do them. The answers to the multiple choice questions
are also provided at the very end of each chapter so that you can check your progress. If you
have answered questions incorrectly go back and read the relevant part of the chapter to ensure
that you have a good understanding of the material. The answers to the SPSS Statistics exercises
are provided at the end of the book. Check these and if you have different answers go back and
try to work out where you might have gone wrong. Often it might be that you have input the
data incorrectly into SPSS Statistics. There are additional multiple choice questions and SPSS
Statistics exercises on the companion website and so please do make use of these also.
Within each chapter there are a number of features designed to get you thinking about what
you have been reading. There are Discussion points which help you to explore different ideas
or theories in more detail. There are also a number of Activity boxes which provide additional
opportunities for you to test your understanding of the theories and ideas being discussed. It is
important to complete the activities as we have placed these to ensure that you are actively
engaging with the material. Our experience has shown that actively working with material helps
learning (and makes reading more enjoyable). You will also find a number of Example boxes
where we provide a concrete example of what we are discussing. Providing such concrete
examples helps students understand the concepts more easily. There are also lots of examples
from the psychological literature which show how active psychology researchers use the
statistical techniques which have been covered in the chapters.
Where appropriate we have included as many diagrams and pictures as we can as these
will help you to understand (and remember) the text more easily. The thought of giving you
endless pages of text without breaking it up is not worth thinking about. This would probably
lead to a lot of Zzzzzz. On a serious note though, remember that the pictures are not there to
be pretty nor just to break up the text. Please consult these along with reading the text and this
will help you learn and understand the concept under discussion. Occasionally in the book you
will come across Caution boxes. These are there to warn you of possible problems or issues
related to certain techniques or statistical concepts. These are useful in many ways as they are
designed to help you to understand some of the limits of statistical tests and they serve as a
reminder that we have to think carefully about how we analyse our data.
Where in a chapter we want to show you how to use SPSS Statistics we provide annotated
screenshots. These will show you which buttons to click in SPSS Statistics as well as how and
where to move information around to get the analyses that you want. Finally, at the end of each
Preface
xix
chapter there is a Reference section. In this we will provide details of all the other authors’
works that we have mentioned within the chapter. This is pretty much what you should do when
writing up your own research. Some of the references will provide the details of the examples
from the literature that we have presented and some will be examples of potentially useful
further reading. You can follow up these as and when you choose to. Sometimes it is good to
follow up the examples from the research literature as you can then see the context to the example analyses that we present. Also, by looking at how the experts present their research you can
better learn how to present your research.
Companion website
We would urge you to make as much use as possible of the resources available to you on the
companion website. When you get on to the site you will see that it is broken down into
resources for each chapter. For each chapter you will find SPSS Statistics dataset files which
are simply the data for the examples that we provide in each chapter. You can access these to
ensure that you have input data correctly or so that you can carry out the same analyses that we
present in each chapter to make sure that you get the same results. Also, on the website you will
find additional multiple choice questions. If you find that you have made mistakes in the
multiple choice questions provided in the book you should go back through the chapter and try
to make sure that you fully understand the concepts presented. It wouldn’t make sense for you
to then test yourself using the same multiple choice questions and so we have provided the
additional ones on the companion website. As another means of testing yourself and to help
you actively learn we provide additional SPSS Statistics exercises for each chapter and a
step-by-step guide to the analysis to conduct on this data and how to interpret the output.
Finally, you will find links to interesting and useful websites which are relevant to the
concepts being covered in each chapter.
Guided tour
The chapter overview gives you a feel for what
will be covered and what you should have learnt
by the end of the topic.
Caution boxes highlight possible problems you may
encounter or issues for consideration.
284
Statistics without maths for psychology
CONFIDENTIAL: Uncorrected WIP proof, NOT for circulation or distribution. © Pearson Education.
The emboldened row shows the probability of obtaining a value of 0.94 when the null
hypothesis is assumed to be true - 66% for a two-tailed hypothesis, and 31% for a one-tailed
hypothesis.
Measures of association
CHAPTER OVERVIEW
9
Earlier, in Chapter 6, you learnt how to analyse the relationship between two variables, using Pearson’s
r. This test was useful in giving a measure of the association between two continuous variables. You
have seen how to represent such relationships on scattergrams, or scatterplots. You learnt what was
meant by a correlation coefficient, and that r is a natural effect size. This chapter also discusses
relationships, or associations, but this time we are going to discuss how to analyse relationships
between categorical variables.
The measure of association that we are going to discuss in this chapter, x2 or chi-square (pronounced
kye-square), measures the association between two categorical variables. You also learnt about
categorical variables (in Chapter 1). If, for instance, we classify people into groups based on which
colour blouse or shirt they are wearing, this is a categorical category. In the same way, if we classify
people by ethnic group, religion or the country in which they live, these are all categorical judgements;
it does not make sense to order them numerically. In this chapter then, you will learn how to:
■
■
■
analyse the association between categorical variables
report another measure of effect (Cramer’s V)
report the results of such analyses.
Symmetric Measures
Nominal by Nominal
N of Valid Cases
Value
Approximate
Significance
Phi
2.097
.332
Cramer’s V
.097
.332
This is the
measure of effect
100
The textual part of your report might read as follows:
Since 50% of the cells had an expected frequency of less than 5, the appropriate statistical
test was Fisher’s Exact Probability. This gave p = 0.66 for a two-tailed hypothesis. The value
of Cramer’s V was 0.10, showing that the relationship between smoking and drinking was
almost zero. The conclusion, therefore, is that there is no evidence to suggest an association
between drinking and smoking.
A 2 * 2 x2 square is easy to work out by hand once you are used to it, but we will not ask
you to do it. The instructions on how to perform a 2 * 2 x2 analysis on SPSS were given earlier
(see page 301).
Caution!
You cannot tell how many people are going to fall into each category when you start your study,
so you need to obtain far more participants than you think you need, to make sure you have
enough participants in each cell.
x2 is always positive (because a squared number is always positive).
Whereas DF roughly equates to the number of participants in most statistical analyses, it does
not in x2, as DF is calculated by number of rows minus 1 (r - 1) multiplied by number of
columns minus 1 (c - 1). In this case, you can see that a 2 * 2 x2 will always have DF = 1
because (r - 1) = (c - 1) = (2 - 1) = (2 - 1) = 1.
The analyses of the relationships between categorical variables include the following:
■
■
■
Frequency counts shown in the form of a table – explained later in the book.
Inferential tests, which show us whether the relationship between the variables is likely to have been due
to sampling error, assuming the null hypothesis is true.
Effect size: x2 can be converted to a statistic called Cramer’s V – this is interpreted in the same way as any
other correlation coefficient. Luckily, this is available through SPSS.
9.1 Frequency (categorical) data
Activity 9.5
Cramer’s V is:
(a)
(b)
(c)
(d)
A measure of difference
A correlation coefficient
An equivalent statistic to Fisher’s Exact Probability Test
A CV value
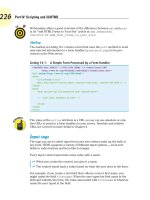
The tests you have used so far have involved calculations on sets of scores obtained from participants. Sometimes, however, we have categorical data (i.e. data in the form of frequency
counts). For example, let’s imagine that we ask a sample of farmers (actually 544 of them) which
of four pig pictures they prefer for a ‘save our bacon’ campaign. We would simply record how
many chose picture 1, how many chose picture 2, and so on. The data would be frequency
counts. Table 9.1 shows the sort of results we might obtain.
CONFIDENTIAL: Uncorrected WIP proof, NOT for circulation or distribution. © Pearson Education.
56
Statistics without maths for psychology
Then you need to click on the Statistics button and select the mode from the next dialogue box along
with any other measures of central tendency you require – see the screenshot below:
Activity boxes provide you with opportunities to
test your understanding as you go along.
SPSS sections guide you through how to use the
software for each process, with annotated, fullcolour screenshots to demonstrate what should be
happening on screen.
3.4 Graphically describing data
Once you have finished a piece of research, it is important that you get to know your data. One
of the best ways of doing this is through exploratory data analyses (EDA). EDA essentially
consist of exploring your data through graphical techniques. It is used to get a greater understanding of how participants in your study have behaved. The importance of such graphical
techniques was highlighted by Tukey in 1977 in a classic text called Exploratory Data Analysis.
Tukey considered exploring data to be so important that he wrote 688 pages about it! Graphically illustrating your data should, therefore, be one of the first things you do with it once you
have collected it. In this section we will introduce you to the main techniques for exploring your
data, starting with the frequency histogram. We will then go on to explain stem and leaf plots
and box plots.
Definition
Exploratory data analyses are where we explore the data that we have collected in order to describe it
in more detail. These techniques simply describe our data and do not try to draw conclusions about any
underlying populations.
3.4.1 Frequency histogram
The frequency histogram is a useful way of graphically illustrating your data. Often researchers
are interested in the frequency of occurrence of values in their sample data. For example, if you
collected information about individuals’ occupations, you might be interested in finding out how
many people were in each category of employment. To illustrate the histogram, consider a frequency histogram for the set of data collected in a study by Armitage and Reidy (unpublished).
Definitions explain the key terms you need to
understand statistics.
Guided tour
Personal reflection boxes bring statistics to life through
interviews with researchers, showing their important role
in psychological discoveries.
CHAPTER 3 Descriptive statistics
Statistics without maths for psychology
Manna Alma, PhD
University Medical Center Groningen, Department of Health Sciences, Community and Occupational Medicine, The Netherlands
ARTICLE: The effectiveness of a multidisciplinary group rehabilitation program
on the psychosocial functioning of elderly people who are visually impaired
Manna Alma says:
‘
Vision loss and its consequences on daily functioning require substantial psychosocial adjustment,
a process many visually impaired persons are struggling with. The psychosocial impact of vision loss is
profound, evidenced by deleterious effects on emotional adaptation, an elevated risk for depression, a
high level of emotional distress, reduced mental health and a decline in life satisfaction. The psychosocial needs of those who are visually impaired should be part of their rehabilitation. Therefore, we developed a multidisciplinary group rehabilitation program, Visually Impaired Elderly Persons Participation
– VIPP, which aims to promote adaptation to vision loss and to improve social functioning. In that paper,
we described the results of a pilot study on the impact of VIPP on psychosocial functioning of the visually impaired elderly. For a convincing estimation of the change in psychosocial functioning a randomized controlled trial is preferable. Since the pilot study was a first step in investigating the
effectiveness of the VIPP-program, we used a single group pretest–posttest design. The results showed
an increase in psychosocial functioning directly after the program. For some of the outcome measures
the improvement appeared to be a temporary effect and was followed by a decline during the six
months following the intervention. However, the six-months follow-up measure still indicated positive
effects compared to baseline. This pilot study was a first step toward documenting the effect of VIPP
on psychosocial functioning. Although the results are preliminary because of the small sample size and
the research design, the results are promising.
’
Example from the literature
The effectiveness of a multidisciplinary group rehabilitation program on
the psychosocial functioning of elderly people who are visually impaired
Alma et al. (2013) carried out a group rehabilitation programme for visually impaired older people. They
measured 29 people on psychosocial variables before an intervention. The intervention consisted of 20
weekly meetings which included practical training and education. The participants were measured at
three time-points (baseline, halfway, immediately after the completion of the intervention, and at sixmonth follow-up). This, then, is a pre-post design, suitable for repeated-measures ANOVA. The authors
state that they used Eta squared as a measure of effect size (ES).
The table of results is reproduced below. Note that the second column shows whether the overall
ANOVAs are statistically significant. The five columns to the right shows the F values and effect sizes
for pairwise comparisons.
Numerous examples in each chapter illustrate the
key points.
CHAPTER 15 Introduction to multivariate analysis of variance (MANOVA)
487
Example
Let us assume that we have conducted the well-being study described earlier in this chapter but we have
decided to use only two indices of well-being, Happiness and Optimism. We have then obtained the
appropriate data (see Table 15.1) from 12 people who are regular churchgoers and 12 who are atheists.
Table 15.1 Data for the well-being experiment
Churchgoers
Atheists
Happiness
Optimism
Happiness
4.00
3.00
5.00
5.00
4.00
4.00
Optimism
4.00
5.00
8.00
8.00
5.00
3.00
6.00
7.00
9.00
4.00
6.00
6.00
7.00
2.00
6.00
5.00
6.00
3.00
7.00
6.00
7.00
4.00
7.00
6.00
5.00
3.00
7.00
5.00
6.00
2.00
8.00
5.00
4.00
4.00
8.00
7.00
5.00
5.00
9.00
4.00
6.00
3.00
X = 6.50
X = 5.5
X = 6.00
X = 3.50
SD = 1.45
SD = 1.45
SD = 1.54
SD = 1.00
95% CI = 5.58–7.42
95% CI = 4.58–6.42
95% CI = 5.02–6.98
95% CI = 2.86–4.14
Before we conduct the MANOVA we need to look at descriptive statistics in order to ensure that the
assumptions for MANOVA are not violated.
We should initially establish that the data for each DV for each sample are normally distributed. For
this we can get SPSS to produce box plots, histograms or stem and leaf plots. The box plots for the data
in Table 15.1 are presented in Figure 15.1.
You can see from these box plots that for both DVs in both conditions the distributions are approximately normal. These findings, along with the fact that we have equal numbers of participants in each
condition, mean that we can continue with our MANOVA with some confidence that we do not have
serious violations of the assumption of multivariate normality.
The second assumption, that of homogeneity of variance–covariance matrices, is assessed by looking
at the MANOVA printout, and therefore we will go through this shortly.
Before we conduct the MANOVA it is instructive to look at the plots of the means and 95% confidence
intervals around the means for the two DVs separately (see Figure 15.2).
93
5. The standard deviation is equal to:
CONFIDENTIAL: Uncorrected WIP proof, NOT for circulation or distribution. © Pearson Education.
Personal reflection
Examples from the literature highlight a key piece
of research in the area.
CONFIDENTIAL: Uncorrected WIP proof, NOT for circulation or distribution. © Pearson Education.
Multiple choice questions at the end of each chapter
allow you to test your knowledge.
(a) The variance
(b) The square root of the variance
(c) The variance squared
(d) The variance divided by the number of scores
6. What is the relationship between sample size and sampling error?
(a)
(b)
(c)
(d)
The larger the sample size, the larger the sampling error
The larger the sample size, the smaller the sampling error
Sample size equals sampling error
None of the above
7. The mode is:
(a)
(b)
(c)
(d)
The frequency of the most common score divided by the total number of scores
The middle score after all the scores have been ranked
The most frequently occurring score
The sum of all the scores divided by the number of scores
8. In box plots, an extreme score is defined as:
(a)
(b)
(c)
(d)
A score that falls beyond the inner fence
A score that falls between the hinges and the inner fence
A score that falls between the inner fence and the adjacent score
A score that falls between the two hinges
9. A normal distribution should have which of the following properties?
(a)
(b)
(c)
(d)
Bell-shaped
Symmetrical
The tails of the distribution should meet the x-axis at infinity
All of the above
10. If you randomly select a sample of 20 pandas (sample A), then select a sample of 300 pandas
(sample B) and calculate the mean weight for each sample, which is likely to give a better estimate of
the population mean weight?
(a) Sample A
(b) Sample B
(c) Both will give equally good estimates of the population mean
(d) Neither will give a good estimate of the population mean
11. What sort of relationship is indicated by a scattergram where the points cluster around an imaginary
line that goes from the bottom left-hand corner to the top right-hand corner?
(a)
(b)
(c)
(d)
Positive
Negative
Bimodal
Flat
Chapter summaries enable you to revise the main points
of the chapter after you’ve read it.
40
CONFIDENTIAL: Uncorrected WIP proof, NOT for circulation or distribution. © Pearson Education.
CONFIDENTIAL: Uncorrected WIP proof, NOT for circulation or distribution. © Pearson Education.
318
xxi
Statistics without maths for psychology
You might be wondering why we have to input the data differently for different designs. The
reason is that each row on the data input screen represents the information from one participant.
If you have a between-participants design, you need to let SPSS know what each participant’s
score was and also which group they were in. When you have a within-participants design, each
participant performs under two conditions and therefore has two scores. You need to let SPSS
know what both of these scores are. Because each participant performs in both groups, you do
not need to let SPSS know their group with a grouping variable. You can therefore tell the difference between within- and between-participants designs by looking for a grouping variable.
If there is one, then it is a between-participants design.
You should notice from the screenshot that we have set up two variables, one for the dog
condition and one for the no-dog condition. Also, because we do not have a grouping variable,
we do not have to give group ‘value’ labels for any variables in the Variable View screen. Setting
up the variables with such a design is therefore more straightforward than with betweenparticipants designs.
Summary
In this chapter we have introduced you to the SPSS
statistical package. You have learnt:
• how to use the tutorials
• how to set up variables in the Variable View part
of the interface.
• about using Labels and Value Labels to make the
output clearer.
• how to input data for correlational, withinparticipants and between-participants designs.
• that the use of a grouping variable is important
for between-participants designs.
Discover the website at www.pearsoned.co.uk/dancey where you can test your knowledge with multiple
choice questions and activities, discover more about topics using the links to relevant websites, and
explore the interactive flowchart designed to help you find the right method of analysis.
SPSS exercises
The answers to all exercises in the book can be found in the Answers section at the end of the book.
Exercise 1
Dr Genius has conducted a study comparing memory for adjectives with that for nouns. She randomly
allocates 20 participants to two conditions. She then presents to one of the groups of 10 participants a
list of 20 adjectives and to the other group a list of 20 nouns. Following this, she asks each group to try
to remember as many of the words they were presented with as possible. She collects the following data:
Adjectives: 10, 6, 7, 9, 11, 9, 8, 6, 9, 8
Nouns: 12, 13, 16, 15, 9, 7, 14, 12, 11, 13
1. What is the IV in this study?
2. What is the DV?
SPSS exercises at the end of each chapter give you an
opportunity to test yourself using real data.
Acknowledgements
Our grateful thanks go to the reviewers of this seventh edition of the book for their time and
valuable help:
Paul Warren - University of Manchester
Richard Rowe - Sheffield University
Jennifer Murray - Edinburgh Napier University
We are grateful to the following for permission to reproduce copyright material:
Screenshots
Screenshots on pages 26, 27, 28, 29, 30, 31, 32, 33, 34, 35, 36, 37, 38, 39,53, 54-55, 66, 70, 88,
89, 120, 124, 125, 157, 158, 159, 160, 163, 164, 165, 166, 188, 189, 197, 198, 201, 202, 228,
229, 234, 235, 235, 269, 270, 271, 273, 274, 275, 279, 280, 305, 306, 313, 314, 315, 346, 347,
348, 349, 350, 351, 359, 360, 361, 368, 369, 380, 381, 382, 391, 392, 416, 417, 418, 419, 420,
432, 433, 468, 469, 470, 473, 495, 496, 503, 504, 505, 517, 518, 523, 524, 530, 531, 537, 538,
542 from International Business Corporation, Reprint Courtesy of International Business
Machines Corporation, © International Business Machines Corporation. IBM, the IBM logo,
ibm.com, PASW and SPSS are trademarks or registered trademarks of International Business
Machines Corporation, registered in many jurisdictions worldwide. Other product and service
names might be trademarks of IBM or other companies. A current list of IBM trademarks is
available on the Web at “IBM Copyright and trademark information” at www.ibm.com/legal/
copytrade.shtml]www.ibm.com/legal/copytrade.shtml.
Tables
Table on page 259 from Health complaints and unemployment: the role of self-efficacy in a
prospective cohort study, Journal of Social and Clinical Psychology, 32, 97–115 (Zenger, M.,
Berth, H., Brähler, E. and Stöbel-Richter, Y. 2013), republished with permission of Guilford
Press, permission conveyed through Copyright Clearance Center, Inc.; Table on page 289
adapted from Everyday memory in children with developmental coordination disorder (DCD),
Research in Developmental Disabilities, 34, pp. 687–94 (Chen, I. C., Tsai, P. L., Hsu, Y. W.,
Ma, H. I. and Lai, H. A. 2013), Copyright © 2013, with permission from Elsevier; Table on
page 311 from Differential effects of age on involuntary and voluntary autobiographical
memory, Psychology and Aging, 24, pp. 397–411 (Schlagman, S., Kliegel, M., Schulz, J. and
Kvavilashvili, L. 2009), Copyright © 2009 American Psychological Association.
Acknowledgements
xxiii
Text
Extract on page 2 from Statistics Commission Report No. 38 – Official Statistics: Value and
Trust, page 38, © Crown copyright. Contains public sector information licensed under the Open
Government Licence (OGL) v3.0. Extract on page 15 from Perceptual biases in relation to paranormal and
conspiracy beliefs, PLoS ONE, 10 (van Elk M. 2015), reproduced with permission; Extract on
page 101 from No regrets? Measuring the career benefits of a psychology placement year,
Assessment & Evaluation in Higher Education, 37, Iss. 5 (Moores, E. and Reddy, P. 2012),
reprinted by permission of Taylor & Francis Ltd, , Copyright ©
2012 Routledge; Quote on page 141 from Geoffrey R. Loftus reproduced with permission;
Extract on page 149 from Politicians and trustworthiness: acting contrary to self-interest
enhances trustworthiness, Basic and Applied Social Psychology, 32, pp. 328–39 (Combs, D. J.
and Keller, P. S. 2010), Copyright © 2010 Routledge. Reprinted by permission of Taylor &
Francis Ltd, ; Extract on page 204 from Evaluation of a new measure of mood intolerance, the Tolerance of Mood States Scale (TOMS): Psychometric properties
and associations with eating disorder symptoms, Eating Behaviors, 13, Iss. 4 (Allen, K.L.,
Mclean, N.J. and Byrne, S.M. 2012), Copyright © 2012, with permission from Elsevier; Extract
on page 207 from Age-related differences in recognition memory for items and associations:
contribution of individual differences in working memory and metamemory, Psychology &
Aging, 27 (Bender, R. and Raz, N 2012), reprinted by permission of Taylor & Francis Ltd,
; Extract on pages 203–04 from Sexting as an intervention: relationship, satisfaction and motivation considerations, The American Journal of Family Therapy, 41
(Parker, T.S. Blackburn, K.M., Perry, M.S. and Hawks, J.M. 2013), Copyright © 2013 Routledge, reprinted by permission of Taylor & Francis Ltd, ; Extract
on page 233 from A comparative study on the attitudes and uses of music by adults with visual
impairments and those who are sighted — JVIB Abstract, Journal of Visual Impairment &
Blindness, 109 (Park, H.Y., Chong, H.J. and Kim, S.J. 2015), republished with permission of
American Foundation for the Blind; permission conveyed through Copyright Clearance Center,
Inc.; Extract on page 247 from Beyond the null ritual: Formal modeling of psychological processes, Journal of Psychology, 217 (Marewski, J. N., and Olsson, H. 2009), Copyright © 2009
American Psychological Association; Quote on page 247 from Statistical procedures and the
justification of knowledge in psychological science, American Psychologist, 44 (Rosnow, R.J.
and Rosenthal, R. 1989), Copyright © 1989 American Psychological Association; Extract on
page 247 from On statistical testing in psychology, British Journal of Psychology, 88
(Macdonald, R.R. 1997), British journal of psychology by BRITISH PSYCHOLOGICAL
SOCIETY Reproduced with permission of CAMBRIDGE UNIVERSITY PRESS. in the format
Book via Copyright Clearance Center; Extract on page 288 from Collectivism and the meaning of
suffering, Journal of Personality and Social Psychology, 103 (Sullivan, D., Landau, M. J., Kay, A. C.
and Rothschild, Z. K. 2012), Copyright © 2012 American Psychological Association; Extract on
page 358 from A quick eye to anger: An investigation of a differential effect of facial features in
detecting angry and happy expressions, International Journal of Psychology (Lo, L. Y., and
Cheng, M. Y. 2015), International journal of psychology by INTERNATIONAL UNION OF
PSYCHOLOGICAL SCIENCE Reproduced with permission of PSYCHOLOGY PRESS in the
format Book via Copyright Clearance Center; Extract on page 367 from Smartphone applications utilizing biofeedback can aid stress reduction, Frontiers in Psychology, 7, 832 (Dillon, A.,
Kelly, M., Robertson, I. H., & Robertson, D. A. 2016), Copyright © 2016 Dillon, Kelly,
Robertson and Robertson.
xxiv
Acknowledgements
Picture Credits
The publisher would like to thank the following for their kind permission to reproduce their
photographs:
(Key: b-bottom; c-centre; l-left; r-right; t-top)
Dr Karina Allen: 204; Manna Alma: 318tl; Ellen Boddington: 464l; Jonathan Lent: 405r;
Geoffrey Loftus: 247b; Professor Mark McDermott: 464r; Dr Liz Moores: 100br; Peter
Reddy: 100r; Robert Rosenthal: 249br; Sarah Partington: 84b; Daniel Sullivan: 287tr.
Cover images: Front: Getty Images
All other images © Pearson Education.