Nghiên cứu đề xuất giải pháp phòng cháy cho rừng thông ba lá (pinus kesiya) tại vườn quốc gia bidoup núi bà, tỉnh lâm đồng tt tiếng anh
Bạn đang xem bản rút gọn của tài liệu. Xem và tải ngay bản đầy đủ của tài liệu tại đây (893.72 KB, 27 trang )
MINISTRY OF EDUCTION AND TRAINING
MINISTRY OF AGRICULTURE AND RURAL DEVELOPMENT
VIETNAM NATIONAL FORESTRY UNIVERSITY
Le Van Huong
RESEARCH OF WILDFIRE AND PREVENTING SOLUTIONS
FOR PINUS KESIYA FORESTS AT BI DOUP-NUI BA NATIONAL
PARK IN LAM DONG PROVINCE
Major: Forest Resource Management
Code: 962021
SUMMARY OF DOCTORAL DISSERTATION IN FORESTRY
MINH CHAU
HANOI, 2019
The research has been completed at:
The Vietnam National Forestry University, Xuan Mai, Chuong My, Hanoi
Scientific instructors:
1. Assoc. Prof. Be Minh Chau
2. Assoc. Prof. Tran Ngoc Hai
Examiner 1: ..............................................................................................................
Examiner 2: ..............................................................................................................
Examiner 3: ..............................................................................................................
This doctoral dissertation will be defended at the VNUF-level Board of
Examiners at
………………………………………………………………….......
…………………………………………at………on………………
This doctoral dissertation can be found at:
-
National Library of Vietnam
-
Library of Vietnam National University of Forestry, Hanoi
ABSTRACT
1. Necessity
Combustion is a physicochemical process that produces heat energy through the oxidation of organic
matter [83]. A fire can only occur when there is a simultaneous combination of three basic elements that
make up the fire triangle, namely oxygen, burning materials and heat sources [11]. In nature, the process of
wildfire is more complicated than that of a simple burning of single organic matter, because all three factors
(oxygen, flammable material and heat source) change rapidly over time and space. When the fire reaches a
certain intensity and magnitude, the fire spreads across the entire landscape, burning most of the biomass of
vegetation on the surface of the forest land.
In recent years, wildfire continuously occur in the United States, Russia, Greece, Australia, Brazil,
Indonesia, etc. leaving enormous socio-economic and environmental consequences. In Vietnam, wildfire also
occurs frequently, but the extent of damage is often not fully documented. Lam Dong province is located in
the crucial region where wildfire mostly takes place. With the characteristic climate
of the Central
Highlands of Vietnam, wildfire often occur in the dry season from November to April each year. Lam Dong
Provincial FPD reported 544 wildfire from 2001 to 2017 that caused loss of 1,413.96 ha of forest of various
types [12]. Bidoup Nui Ba National Park (BNBNP), a member of Vietnam’s national park network, covers
an area of 70,038 ha. The park is the core zone of the World’s Lang Biang Biosphere Reserve and it is also
recognized as an ASEAN heritage park where has global values of biodiversity. However, one of the biggest
challenges that BNBNP currently faces is wildfire. According to the 2014 forest inventory results [34], the
total area of flammable forest in BNBNP 30,930 ha. The statistics also show that from 2005 to 2017, 84
wildfire happened in BNBNP with the damaged area of 229.4 ha, mainly pine forest. Since the landscape
consists of typical climatic factors of three-needled pine trees, think grasses, flammable material of up to 20
ton per ha after years without wildfire, fire is likely to occur any time. When wildfires take place on a large
scale, globally significant biodiversity and landscape values can be severely damaged and difficult to be
recovered.
Many scientific studies on wildfire prevention and fighting have been conducted in the world and in
Vietnam. The research targets how to minimize the damage caused by wildfire. Many countries have applied
modern technologies in wildfire prevention. However, wildfires are still frequent around the world as well as
in Vietnam and they are also considered one type of natural disaster in the context of global climate change.
Thus, there are still many challenges in the study of wildfire. Currently, research results still fail to meet the
objectives of wildfire prevention and fighting at management levels and managers, including BNBNP. It
raises the question on how to minimize possible damage caused by wildfire in BNBNP where is considered
at hot spot of wildfires in Lam Dong province. For such reasons, the selection and implementation of the
Research on Wildfire and Preventing Solutions for Pinus kesiya forest at Bidoup – Nui Ba National Park, in
Lam Dong province is highly necessary.
2. Goals of the research
2.1. General goals
A scientific research to propose effective solutions for fire prevention and fighting in three-needled
pine (Pinus kesiya) forest at Bidoup – Nui Ba National Park, in Lam Dong province.
2.2. Specific goals
(1) Identify the major characteristics of the three-needled pine Pinus kesiya forest in related to
wildfire.
1
(2) Determine the composition of flammable material of the three-needled pine forest and their
relationships in the forest environment.
(3) Identify scientific foundations for wildfire prevention.
(4) Propose effective solutions for fire prevention and fighting in three-needled pine forest at Bidoup –
Nui Ba National Park.
3. Objects and Scale of the study
3.1. Objects
Three-needled pine planted forest and natural forest of BNBNP, in Lam Dong province.
3.2. Scale
The study focuses on four areas at different altitudes, including: Dung Kno; Dung Iar Jieng, Cong Troi
and Bidoup in BNBNP of Lam Dong province.
4. Contributions of the study
Theorically, the thesis has quantified and developed mathematical models on the correlation between
flammable material, temperature, humidity of forest environment and possibilities of wildfire as a basis for
forecasting the danger of wildfire.
Practically, the thesis has:
- Proposed a new method of classification of flammable material and the burning coefficient K in
assessing and forecasting the danger of wildfire.
- Determined wildfire season and classifying wildfire dangers by univariate and multivariate
statistical models.
- Determined objects, intensity and time of prescribed burning;
- Proposed effective solutions of preventing wildfire for BNBNP based on scientific and practical
foundations.
5. Scientific and practical values
5.1. Scientific values
The thesis studies the correlation between factors related to wildfire, quantifies them as a basis for
building models of forecasting dangers and season of wildfire, and provides sound foundations for treating
flammable material and prescribed burning in three-needled pine forests in BNBNP.
5.2. Practical values
The thesis has proposed methods for forecasting wildfire dangers and season and effective solutions
for wildfire prevention in three-needled pine forests in BNBNP.
Chapter 1. OVERVIEW
Based on our review of 95 nationally and internationally published papers related to the following
topics: (1) Distribution characteristics of the three-needled pine forest and wildfire; (2) Characteristics of
flammable material and the danger of wildfire; (3) Methods for forecasting wildfire and (4) Technical
measures for wildfire prevention, the following conclusions are confirmed:
(1) The distribution area, ecological conditions, biological characteristics of the species show that the
formation and existence of three-needled pine forest are related to the occurrence of wildfire.
Studies have also confirmed that the three-needled pine forest is annually flammable (in the dry
season).
2
(2) Flammable material (fuel) is one of three factors formulating the wildfire triangle. Flammable
material is connected with wildfire under the following indicators: Ingredients and types of
material, height, weight, size, spatial arrangement on the forest ground and moisture. Other
environmental impacting factors are exposure direction, wind speed, temperature, humidity and
forest environment temperature,. If oxygen and heat are excluded, flammable material has been
the main objective of research on wildfire prevention and fight.
(3) Aridity is often used to determine the wildfire season, possibly for a specific area. They are
usually set by rainfall, temperature, humidity and evaporation.
(4) Wildfire danger indices are often used to predict the likelihood of wildfire. They are different
from the aridity indices, which are often set on meteorological factors. Some fire danger
indicators also take into account the volume, humidity, accumulation ability of flammable
material, etc. of target forests.
(5) Remote sensing technology is increasingly widely used in forecasting and detecting wildfire.
However, early detection of wildfire by remote sensing technology for fire fighting is very
challenging due to the nature of forestry. The industry manages a large forest area, so it is
difficult to access the fire site immediately when wildfire occurs.
(6) Traditional measures of wildfire prevention including clearings, green belt, guarding, awareness
of forest visitors have been continuously utilized by foresters.
(7) In addition to traditional measures, prescribed burning is widely applied. This is an effective
approach to reduce the volume of flammable material that causes wildfire. However, there have
been no quantitative studies to acknowledge the timing and intensity of, and status of forest
suitable for prescribed burning for effective prevention and fighting. Answering the above
questions is scientifically sound to propose burning solutions for fire protection in BNBNP and
different fired-forest ecosystems.
Chapter 2. METHODOLOGY
2.1. Contents
(1) Characteristics of three-needled pine forests and wildfire in BNBNP;
(2) Characteristics of flammable material in three-needled pine forests;
(3) Modeling the correlation among components of flammable material;
(4) Forecast of wildfire danger in BNBNP;
(5) Proposed solutions for wildfire prevention in three-needled pine forests in BNBNP.
2.2. Approaches
The study applies systematic and ecosystem approaches.
2.3. Approach chart
Major
ecological
factors
Causes of
wildfire
Identification of
independent and
dependent
variables
Environmental
factors and
flammable
material
Algorithms
Proposal of
solutions
2.4. Research methodology
2.4.1. Database
(i) The 1st field survey collected data in 150 plots to serve the author’s Masters degree. Results are
presented as one of crucial parts in this dissertation.
3
Table 2.1. Time, location and types of forest in the 1st field survey
No
Sub-zone
Date of survey
Type of forest/year of
plantation
Level of
aging
Number of
plots
1
2
4
5
3
148B
58
26
125
129 and 130
15/12/2009
30/01/2010
05/02/2010
07/02/2010
01/02/2010
Planted forest (PR) 1997
PF 2001
PF 1997
PF 1998
Natural forest
III
II
II
III
30
30
30
30
30
Total
150
(ii) The 2nd field survey collected data in 340 plots, directly serving this study.
Table 2.2. Time, location and types of forest in 340 plots
No.
Sub-zone
Date of survey
Type of forest/year of
plantation
Level of
aging
Number of
plots
1
2
3
4
5
6
7
8
9
10
11
12
13
14
26
103
76
59
80
96C
100
102A
75B
93
145A
27
145A
124
31/12/2015
17/01/2016
25/01/2016
01/02/2016
28/02/2016
06/03/2016
30/11/2016
18/02/2017
19/02/2017
19/02/2017
20/11/2015
29/12/2015
30/01/2016
23/03/2016
PF 2002
PF 2002
PF 1996
PF 1998
PF 1996
PF 1997
PF 2011
TR 1999
PF 1999
PF 1998
Natural forest
Natural forest
Natural forest
Natural forest
III
III
IV
IV
IV
IV
I
III
III
III
40
30
30
30
15
35
45
15
15
15
3
10
27
30
340
Total
(iii) Data collected from 25 verification plots in Cong Troi Area.
Table 2.3. Database of verification experiments for forecasting models
Month
T (oC)
H (%)
m1 (Kg)
K
Nov
Dec
Jan
Feb
Mar
27
29.26
25.04
25
30.24
51.4
55.14
73.66
53.4
28.12
0.85
1.58
2.4
5.93
1.54
0.141346
0.652034
0.542221
0.85001
0.52215
2.4.2. Methodologies of field survey and data treating.
2.4.2.1. Methodology of field survey and experiment
- Study forests are categorized by altitude and origin of forests. Planted forest is classified by age level
of I, II, III and IV, five year for each level.
- 1st survey: 150 round-shaped were systematically sampled to inventory basic parameters of forests
of the level of age I, II, III and IV using the 6-tree methods. Within these plots, 150 subplots of 4 m2 (2m x
4
2m) each were surveyed for floristic composition and burning material and burned to collect basic variables
related to wildfire.
- 2nd survey: 340 round-shaped plots and subplots were additionally experimented in the same manner
for the same parameters and variables, including temperature and moisture.
The experimental layout is as follows:
Figure 2.2. Experiment layout
2.4.2.2. Data collection
- In round-shaped plots, trees were surveyed with D1,3, Hvn and N using the 6-tree method, where r6
= a6 + d6/2 (r6 is plot radius, a6 distance from plot center to the 6th tree and d6 tree diameter at breast height).
Data collected were to understand the structural characteristics of three-needled pine forest that are related to
wildfire in BNBNP.
- In the 4 m2 experimental plots, surveys were focused on plant composition to find out the origin of
burning material and their classification and volume, measuring temperature, humidity and conducting
experimental burning to collect data for modeling possibilities of wildfire. The collected data are as follows:
+) Height measurement, identification and sampling of plants under forest canopy.
+) Survey weight and composition of flammable material: Separating naturally dried flammable
material with size ≤ 1 cm collected by scraping and measuring (to the nearest of 0.1 g) the weight of original
natural dry material (m1, kg/4m2). Living material (shrubs with a root diameter of less than 1 cm, grass,
vines) were cut at the base by sickles and the weight of the original living material was measured (m2,
kg/4m2). The total weight of flammable material under the forest canopy (denoted as M, kg / 4m2) is
calculated as follows: M = m1 + m2. The inflammability index or flammability index K is calculated by the
formula K = m1/ M.
+) Mix well the pile and burn to record the burning time, denoted as Tc. after burning, collect and
weigh the remaining material, and determine the percentage of burned material, denoted as Pc.
+) Use portable PCE-HT110 measuring device to measure the temperature (T, oC) and the humidity
in the experimental plot (H,%) to determine the temperature and humidity in the environment at research
time.
The data is only collected from 10 am to 14 pm on non-rainy days and does not record the
temperature and humidity directly in the sun light.
2.4.2.3. Data treating methods
5
- Identification of plant species
The data and samples collected in the field were identified using Pham Hoang Ho's Flora of Vietnam
(1999)[18] with assistance from forest plant experts.
- Modeling the correlation among components of flammable material.
Based on the collected data of the indicators m1, m2, M, Tc, Pc and K, modelling is made using the
correlation matrix of components to choose the best model, following Nguyen Ngoc Kieng (1993),
(1996)[24], [25].
- Determining wildfire season and forecasting wildfire dangers
+ Analysis of meteorological database
Meteorological parameters by monthly average (from January to December) such as temperature (T,
o
C), maximum temperature (Tmax, oC), minimum temperature (Tmin, oC), air humidity (H,%), rainfall (P,
mm), sunshine hours (Sm, hours) in the period of 1978 - 2014 provided by Da Lat Meteorological Station.
The heat amplitude (dT, oC) is calculated using the formula dT = Tmax - Tmin and sunshine hours in a day
(S, hours) by the formula S = Sm / N, where N is the number of days of the months.
+ Gaussen - Walter chart (based on P and T) with additional meteorological factors including, H, dT
and S.
+ Calculation of aridity indexes [75]:
+
Lang Index: LANG = P / T
+
De Martonne Index: DEMA = 12 * P / (T + 10)
+
Selyaninov index: SELY = P / (0.1 *
+
Ivanov Index: IVA = P / E, with E = 0.0018 * (25 + T) 2 * (100 - H)
+
Thornthwaite Index: THORW = P / PET, with PET = 16 * (10 * T / I) a * (S / 12) * (N / 30),
T), where
T is the total temperature of the month
where:
and a = 6,75*10-7*I3 – 7,71*10-5*I2 + 1,792*10-2*I + 0,49239
+ The wildfire danger index is calculated as following:
(1) Angstrom Index: ANGS = (H / 20) + (27 - T) / 10
(2) Sharples Index: SHAR = 10 - 0.25 * (T - H)
(3) Cheney-Sullivan Index: SUL = 9,668 - 0,207 * T + 0,137 * H
(4) Viney index: VIN = 5,658 + 0.0465 * H + 3,151 * 10-4 * H3 * T-1 - 0,1854 * T0,77
- Multivariate statistics:
+ To determine the wildfire season, the following methods were used: Principal Component
Analysis (PCA), Factor Analysis (FA), Multi-Dimensional Scaling Analysis (MDSA) and Cluster Analysis
(CA).
+ Establishing the set of independent variables {T, H, m1, K} and of dependent variables {Tc, Pc}
in Canonical Correlation Analysis (CCA) to determine the canonical correlation coefficient R (R =
with
is eigenvalue) and probability level of significance P.
+ Discriminant Functions Analysis (DFA): Establishing the Canonical Discriminant Functions CDF
and Fisher Classification Functions FCF and calculating Mahalanobis distances with database. Wildfire
danger was predicted using Mahalanobis distance and Fisher classification function models.
Chapter 3. RESULTS AND DISCUSSION
3.1. Some characteristics of three-needled pine forest and wildfire status in BNBNP
6
3.1.1. Three-needled pine forest distribution in BNBNP
Analysis of input database of BNBNP shows 23,545 ha of three-needled pine forest, including
21,498 ha of natural forest and 2,047 ha of planted forest. The lowest point with the appearance of threeneedled pine is 646 m, the highest point 2,200 m. Natural three-needled pine forest is distributed in 70 subzones while planted forest covers 2,047 ha scattered in 30 sub-zones. Three-needled pine forest is classified
into four areas with different altitudes:
(1) Dung K’no area: altitude from 630 - 1,000 m, areas of 2,016 ha;
(2) Dung Iar Jieng area: height from 1,000 m to 1,400 m, area of 10,012 ha;
(3) Cong Troi area: height from 1,400 m - 1,900 m, area of 10,970 ha;
(4) Bidoup area: altitude of 1,900 m - 2,087 m, areas of 541 ha.
3.1.2. Some characteristics of the planted three-needled pine forest
Analysis results from 290 plots of three-leaf pine planted forest from age I to age IV in BNBNP
draw the following results:
- Planted forests at the age I to IV have distinct differences in height, diameter and density. This shows
that the uneven quality of planted forest in BNBNP.
- The height difference of grass at all ages is insignificant, so planted forest at all age levels are
equally flammable.
- There is a correlation between the density of planted forests and the height of grass, usually where
with high density and low grass and vice versa.
3.1.3. Some characteristics of the natural three-needled pine forest
Analysis of 100 plots of natural three-needled pine forests shows that natural three-needled pine
forests are rather even and rich in forest stock. This is also consistent with the results of the 2014 forest
inventory database in BNBNP with the total areas of rich and average coniferous forest to be up to 60% of
the total coniferous forest areas. The same holds true for planted forests as analysis shows a correlation
between height of grass and density of forest trees. If density is high, the height of the grass is low and vice
versa.
3.1.4. Wildfire in Bidoup-Nui Ba National Park
Records by Lam Dong Forest Protection Department [12] in the period of 2005-2017 in Lam Dong
province show 544 fires, damaging 1,413.96 ha of forest of all kinds. According to the Forest Protection
Department of BNBNP, from 2005 to 2017, 84 wildfire happened in BNBNP, damaging and affecting 229.4
ha of natural and planted forests.
3.1.5. Causes of wildfire
The results of semi-oriented interviews show that causes of wildfire in BNBNP include: burning
farms accounting for highest proportion (24.6%), followed by flammable material burning/irregualry
prescribed burning (23.5%). Accidental fire by foresters or tourists account for the lowest (6.5%).
3.2. Characteristics of flammable material
3.2.1. Definition, classification and basic properties of flammable material
Based on a ecological factor viewpoint, the concept, classification and properties of flammable
material are proposed as follows:
(1) Concept: flammable material are all plants and their fallen objects.
(2) Classification: flammable material are divided into the following two categories:
- Dry material includes:
7
+ Dried up trunks, branches and leaves of the vegetation.
+ Falling objects of the forest.
+ Surface soil which is yet decomposed
- Living material includes all species included in the living composition of the vegetation.
(3) Properties of flammable material:
Flammable material has the following remarkable properties:
(i) dry material and living material are related to each other according to the growing season,
biological characteristics of the species.
(ii) flammable material continuously changes under direct or indirect impacts of ecological factors,
in which the meteorological and hydrological factors are decisive to the flammability of the material.
(iii) When a new fire emerges, living materials prevent the possibility of wildfire.
(iv) When a wildfire occurs at a certain intensity, living materials will change into dry material and
the whole material will burn.
3.2.2. Composition of flammable material
The survey shows that 288 vascular plant species belonging to 76 families are part of flammable
material in three-needled pine forest and such plants have many different growth forms. Based on the
biological characteristics of each species and the objectives of fire prevention, criteria of classifying threeneedled pine forest plants are classified into three groups: (1) fire-resistant species, (2) flammable species
and (3) highly flammable species. The results of the analysis are compiled into a list of all plants involved in
the fire.
3.2.3. Flammable plants
Based on the established plant list, criteria for classifying less flammable species, flammable species
and highly flammable species. The study has cataloged 39 species of highly flammable plant species in
three-leaved pine forests in BNBNP.
3.2.4. Weight and flammability of flammable material
The composition of the weight of flammable material including weight of dry material (m1), weight of
living material (m2) total weight of combustible material (M) and Inflammability index (K ) from 490 study
plots for forests of age groups I, II, III and IV were aggregated into tables as input database to analyze their
correlation with the possibility of wildfire.
3.2.5. Correlation matrix of components of flammable material.
The correlation matrix of components of flammable material in three-needled pine forest has been
established. Analyzing the matrix shows that:
(i) m1 and m2 show a negative correlation (in Cong Troi: r = - 0.66653; P = 0,0001 << 0.05).
(ii) m1 and M show a positive correlation, highest in Dung K’no (r = 0.77845; P = 0,0000 << 0.05);
whereas at this correlation is not clear in Cong Troi.
(ii) m2 and M show a positive correlation, the highest is in planted forest in Bidoup (r = 0.9306; P =
0.0000 << 0.05) and the lowest in Cong Troi (r = 0.6873, P = 0.0000 << 0.05).
(iii) K and m1 show a positive correlation, the highest in Cong Troi (r = 0.9040; P = 0.0000 << 0.05)
and the lowest in Bidoup. (r = 0.4450, P = 0.0137 <0.05).
(iv) K and m2 show a negative correlation, the highest in Cong Troi (r = -0.8859; P = 0.0000 <<
0.05) and the lowest in Bidoup (r = -0,3806, P = 0.0380 <0.05).
(v) K and Pc show a positive correlation, the highest in Cong Troi (r = 0.5725, P = 0,0009 << 0.05).
8
(vi) Tc shows a positive correlation with m1, m2 and M, the highest in Dung Kno: Tc with m1 (r =
0.6407; P = 0.0001 << 0 , 05) and Tc with M (r = 0.7733; P = 0.0000 << 0.05).
(vii) Pc and m1 show a positive correlation in Cong Troi at the beginning of the dry season (r =
0.6051, P = 0.0004 << 0.05), while Pc and m2 show the negative correlation in Bidoup (r = - 0.4357; P =
0.0161 <0.05).
3.3. Modelling the correlation among components of combustion materials
3.3.1. Modelling the correlation among m1 and m2 and M.
(a) Correlation between m1 and m2 in planted forest at Cong Troi.
The research results show that the best model among experimental models is
m2 = exp(a + b*m12), where a = 1,05388 , b = -0,14732, r = 0,69621, P = 1,93*10-5<< 0.05 (3.1)
Model (3.1) shows that the correlation between m1 and m2 is negative.
b) Correlation between m1 and M
(i) Mathematical model for planted forest at Dung K’no:
The research results show that the best model among experimental models is
M = (a + b*lnm1) ^2, where a = 1,74026, b = 0,6926, r = 0.84465 and P = 4,4*10-9<< 0.05
(3.2)
(ii) Mathematical model for natural forest at Bidoup:
Research results show that the best model reflecting the correlation between m1 and M in the natural
forest is as follows:
M = exp (a + b*lnm1), where a = 1.1868, b = 0.55254, r = 0.771913 and P = 5,88*10-7<< 0.05
(3.3)
From model (3.2) and model (3.3), it shows that the correlation between M and m1 is positive.
(c) Correlation between m2 and M
(i) Planted forest at Bidoup
The research results show that the best model among experimental models is
M = sqrt (a + b*m2^2), where a = 5.2131, b = 1,71263, r = 0.93504 and P = 3.9*10-14<< 0.05
(3.4)
b) Natural forest at Bidoup
The research results show that the best model among experimental models is
M = sqrt (a + b*m2^2), where a = 2.41762, b = 1.94021, r = 0.89808 and P = 1.7*10-11<< 0.05 (3.5)
From model (3.4) and model (3.5), the correlation between m2 and M is positive.
3.3.2. Modelling the correlation among K and m1 and m2
(a) Correlation between K and m1:
(i) Mathematical model for planted forest in Cong Troi:
The research results show that the best model among experimental models is
K = m1 / (A + B*m1), where A = 2.902691, B = 0.46979, r = 0.94778 and P = 1.99*10-15<< 0.05
(3.6)
(ii) Mathematical model for natural forest at Bidoup:
The research results show that the best model among experimental models is
K = sqrt [1/ (a +b * lnm1)], where a = 11.64198, b = - 8.71205, r = 0.73523 and P = 3.7*10-6<< 0.05
(3.7)
9
The established models of (3.6) and (3.7) show that the correlation between weight of dry material m1
and Inflammability index K is positive.
(b) Correlation between K and m2:
(i) Mathematical model for planted forest at Cong Troi:
The research results show that the best model among experimental models is
K 3
A B * m2
m2
, where A = 0.38386, B = -0.08532, r = 0.94611 and P = 3.06*10-15<< 0.05
(3.8)
(ii) Mathematical model for natural forest at Bidoup:
The research results show that the best model among experimental models is
K = cubrt (a + b/m2^3), where a = 0.03453, b = 0.1071, r = 0.66261 and P = 6.6*10-5<< 0.05
(3.9)
The established models of (3.8) and (3.9) show that the correlation between weight of living material
m2 and Inflammability index K is negative.
3.3.3. Modelling the correlation among Tc and m1, m2 and M
(a) Correlation between Tc and m1
The analysis results show that, for Dung K’no planted forest, the best model among the experimental
models is as follows:
Tc = exp (a + b/m1), where a = 2.1063, b = -1.2498, r = 0.7411 and P = 2.8*10-6<< 0.05
(3.10)
The established model (3.10) shows that the correlation between burning time Tc and weight of dry
material m1 is positive.
(b) Correlation between Tc and m2
The analysis results show that, for Dung K’no planted forest, the best model among the experimental
models is as follows:
Tc = sqrt (1/ (a + b/m2^3), where a =0.03287, b = 0.47662, r = 0.73751 and P = 3.3*10-6<< 0.05
(3.11)
The established model (3.11) shows that the correlation between burning time Tc and weight of living
material m2 is positive.
(c) Correlation between Tc and M
(i) Mathematical model for Dung K’no planted forest:
The research results show that the best model among experimental models is
Tc = sqrt [1/ (a + b* M^3)], where a = 0.01578, b = 4.38594, r = 0.91723 and P = 1.01*10-12<< 0.05
(3.12)
(ii) Mathematical model for natural forest at Bidoup:
The research results show that the best model among experimental models is
Tc = cubrt (a + b* M^3), where a = 45.79195, b = 5.38806, r = 0.606254 and P = 0.000384 << 0.05
(3.13)
The established models of (3.12) and (3.13) show that the correlation between burning time Tc and
total weight of materials is positive.
3.3.4. Modelling the correlation among Pc and m1, m2 and K
(a) Correlation between Pc and m1:
The analysis results show that, for Cong Troi planted forest, the best model among the experimental
models is as follows:
10
Pc = exp [ (A + B*m12) / m12], where A = -0.20409, B = 4.58433, r = 0.96292 and P = 1.81*10-17<< 0.05
(3.14)
The established model (3.14) shows that the correlation between burning percentage Pc and weight of
dry material m1 is positive.
(b) Correlation between Pc and m2:
The analysis results show that, for Bidoup planted forest, the best model among the experimental
models is as follows:
Pc = a+b* m2 where a = 102.5273, b = - 1.93756, r = 0.43567 and P = 0.01611< 0.05
(3.15)
The established model (3.15) show that the correlation between burning percentage Pc and weight of
living material m2is negative.
(c) Correlation between Pc and K:
The analysis results show that, for Cong Troi planted forest, the best model among the experimental
models is as follows:
Pc = exp (a + b / K3), a = 4.54792, b = -0.00245, r = 0.95909 and P = 7.02*10-17<< 0.05
(3.16)
From model 3.16 shows that the correlation between% of exhausted Pc and the Inflammability index K is
positive.
3.3.5. Modeling the correlation between K and m1 with Pc
The analysis results show that, for Cong Troi planted forest, the best model among the experimental
models is as follows:
m1 + b /K + b /m + b * K 3
Pc = exp[ b0 + b1*K + b2*m1 + b3*ln K + b4*ln(m1) + b5* K + b6*
7
8
1
9
+ b10*m12 + b11/K2 + b12/m12 ] , with a multiple correlation coefficient R = 0.98038 and a probability level of
significance Pmodel = 1.39*10-9<< 0.05 and Pbi< 0.05 ; i = 1, 2,…, 12 (3.17)
(Table 3.9)
Table 3.9. The value of the block index b0 and the regression coefficients bi
b0
31391.9
P
P
b1
29467.55
0.048
b7
1081.74
0.042
b2
-2059.32
0.012
b8
-1511.61
0.007
b3
12933.96
0.044
B9
-6660.97
0.0498
b4
-4730.09
0.009
b10
52.64
0.015
b5
-62842.1
0.046
b11
-30.73
0.0397
b6
10959.25
0.0104
b12
153.67
0.00656
From the established model (3.17), the abridged mathematical model of Pc = f (K, m1) can be
interpreted as follows: The causal factors are weight of dry material m1 and the inflammability index K result
in burning percentage of Pc, which helps to establish a scientific basis in wildfire prevention and fighting.
3.4. Forecast of wildfire dangers in BNBNP
3.4.1. Forecast of wildfire danger is based on univariate statistical models
3.4.1.1. Assessing the dangers of wildfire based on the weight of flammable material and the inflammability
index K
From the established model (3.6) which shows the correlation between the inflammability index K
and the weight of dry material m1, it is possible to calculate the inflammability index or flammability index
K by the weight of dry material m1 of flammable material, enabling to calculate the weight of living material
m2 by the correlation equation between m1 and m2 (model 3.1) and the total weight of material M = m1 + m2.
It means that if other factors affecting the burning are ignored, a fire shall require a sufficient amount of dry
material m1, the weight m2 at a corresponding level as well as the ratio between m1 and M at certain level.
Calculation of experimental results are shown in table 3.10.
11
Table 3.10. Forecast of wildfire danger is based on K index and weight of flammable material
K
0.1
0.2
0.29
0.3
0.4
0.49
0.5
0.6
0.69
0.7
0.8
0.9
m1 (ton/ha)
0.76
1.6
2.44
2.53
3.57
4.62
4.74
6.06
7.41
7.57
9.3
11.32
m2 (ton/ha)
6.85
6.41
5.96
5.91
5.36
4.81
4.74
4.04
3.33
3.24
2.33
1.26
M (ton/ha)
7.61
8.01
8.4
8.45
8.94
9.43
9.48
10.11
10.74
10.81
11.63
12.57
Flammability
Very less likely
flammable
Less likely
flammable
Likely flammable
Very likely
flammable
3.4.1.2. Forecast of wildfire based PC and m1
The established model (3.14) shows the correlation between burning percentage Pc and weight of
dry material m1. Using the model (3.1), it is possible to calculate m2 and the total M = m1 + m2. The result is
shown in Table 3.11.
Table 3.11. The result of calculating the burning percentage Pc and weight of flammable material
PC
10
20
30
40
50
60
70
80
85
90
95
97
97.5
m1(ton/ha)
0.75
0.9
1.04
1.19
1.38
1.61
1.95
2.51
3
3.88
6.47
11.51
16.88
m2(ton/ha)
2.64
2.55
2.45
2.33
2.17
1.96
1.64
1.13
0.76
0.31
0.01
0
0
M(ton/ha)
3.39
3.45
3.49
3.52
3.55
3.57
3.59
3.64
3.76
4.19
6.48
11.51
16.88
(m1/M) *100
22.1
26.1
29.8
33.8
38.9
45.1
54.3
69
79.8
92.6
99.8
100
100
Note: (m1 / M) * 100 is the percentage of dry material m1 compared with weight of total material M.
3.4.1.3. Calculating burning percentage Pc from the inflammability index K and the weight of flammable
material
From the established model (3.17) showing the correlation between K and m1 and Pc, and using the
model (3.1), it is possible to calculate m2 and the total M = m1 + m2 from which to tabulate the fire
possibility PC% from K index and weight of flammable material as shown in table 3.12.
Table 3.12. Calculating burning percentage PC from K index and weight of flammable material
Pc (%)
K
m1 (ton/ha)
m2 (ton/ha)
M (ton/ha)
72
0.32
3.68
8.01
11.7
85
0.52
7.44
6.97
14.4
90
0.6
8.06
5.32
13.38
12
90
90
95
0.7
0.82
0.82
7.78
7.77
8.02
3.4
1.73
1.74
11.18
9.5
9.76
3.4.1.4. Summary of criteria for forecast of wildfire dangers based on forest types
After summarizing calculated results of tables 3.10, 3.11 and 3.12, in combination with data
collected from different forest types in BNBNP, wildfire dangers can be forecasted based on the
inflammability index K, weight of dry material m1 and weight of total material M. Because m2 can be
calculated indirectly from the formula m2 = M - m1, it is not necessary to include it in the table. Results are
presented in Table 3.13.
Table 3.13. Summary of criteria for forecast of wildfire dangers based on forest types
Group
I
II
III
Forest status
Large natural pine
forest and plantation
pine forest > 10 years
old
Plantation pine forest
from 5 - 10 years old.
Plantation pine forest
<5 years old
Weight of flammable
material (ton / ha)
Inflammability
index K
Danger and fire levels
m1
M
< 0.3
< 2.5
< 8.5
Less dangerous
0.3-0.5
2.5- 4.6
8.5 - 9.4
Dangerous
> 0.5
> 4.6
> 9.4
Very dangerous
< 0.3
< 2.5
< 8.5
Less dangerous
0.3-0.5
2.5- 4.6
8.5 - 9.4
Dangerous
0.51 - 0.70
4.7 - 7.5
9.5-10.7
Very dangerous
> 0.7
> 7.5
> 10.7
Very dangerous
< 0.3
< 2.5
< 8.5
Dangerous
0.3-0.7
2.5- 7.5
8.5 – 10.7
Very dangerous
> 0.7
> 7.5
> 10.7
Very dangerous
The results shown in Table 3.13 can be used as a basis for proposing an effective fire preventing
solution in BNBNP. The content can also be used as a scientific basis to propose prescribed burning solution
in combination with biodiversity conservation activities in BNBNP. It means that prescribed burning should
be conducted only in natural and planted forests when the inflammability index K and the weight of dry
flammable material m1 are at dangerous and very dangerous levels.
3.4.2. Danger prediction of wildfire based on the statistical multivariate model
3.4.2.1. Determining wildfire season
(i) Data analysis results of meteorological variables:
Data analysis results of meteorological variables: rainfall (P), air humidity (H), temperature (T), heat
amplitude (dT) and sunshine hours (S) in the target area (from 1978 to 2009) are presented in Table 3.14.
Table 3.14. Data treating results of meteorological factors
Month Jan Feb Mar
Apr
May
Jun
Jul
P
8.9 19.7 76.4 179.7 216.2 201.7 222.2
H
81.4 78.3 79.7
84.9
86.9
89.7
90
T
15.8 16.8 17.9
19
19.5
19.1
18.7
dT
17.6 17.4 17.4
15
12.4
11
10.8
S
7.8 8.2
7.8
6.7
6.1
5
4.7
(ii) Multivariate approach of Gaussen-Walter diagram
13
Aug
242.1
90.9
18.6
10.5
4.4
Sep
277.6
90.5
18.5
10.8
4.2
Oct
246
89
18.1
12
4.5
Nov
99.5
85.6
17.5
12.7
5.6
Dec
32
83.9
16.3
14.8
6.5
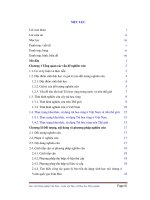
Multivariate approach of Gaussen - Walter diagram, with 5 elements (P, T, H, dT & S) corresponding to
5-dimensional space is be shown in 2-dimensional space as follows (Figure 3.18):
Figure 3.18. Gaussen - Walter diagram with 3 additional meteorological factors including H,
dT and S.
From the results in Figure 3.18, it is possible to identify the wildfire season in the target area.
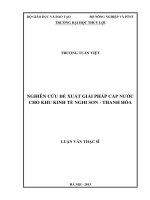
(ii) Data analysis results of meteorological variables using multivariate statistical methods:
Results of data analysis of meteorological factors (P, H, T, dT and S) of Table 3.14 on SPSS and
Statgraphics softwares are as follows (Figure 3.19 (a) & Figure 3.19). (b)):
Biplot
1.9
T
1.4
T4
Component 2
T3
T5
S
0.9
dT
P
0.4 T2
T6
-0.1
-0.6
T7
T9
T8
T1
T10
T11
T12
H
-1.1
-3.2
-2.2
-1.2
-0.2
Component 1
0.8
1.8
2.8
Figure 3.19 (a). Results of multi-dimensional
Figure 3.19 (b). Results of analysis of
scaling analysis (MDSA) of meteorological
principal component analysis
factors (P, H, T, dT and S) of Table 3.4.2.1.1
(PCA) of meteorological factors
on SPSS software
(P, H, T, dT and S) of Table 3.4.2.1.1 on
Statgraphics software.
Results of factor analysis (FA) and cluster analysis (CA) of meteorological factors (P, H, T, dT and S)
of Table 3.14 on SPSS and Statgraphics software show similarity (Annex 10).
(iv) Data analysis of meteorological variables by multivariate statistical methods:
Calculation results of variable values of aridity indices (Lang, De Martonne, Selyaninov, Ivanov &
Thornthwaite: LANG, DEMA, SELY, IVA & THORW) are as follows (Table 3.15):
Table 3.15. Calculation results of variable values of aridity indices from meteorological data of Table 3.13
Month
Jan
Feb
Mar
Apr
May
Jun
Jul
Aug
Sep
Oct
Nov
Dec
LANG
0.6
1.2
4.3
9.5
11.1
10.5
11.9
13
15
13.6
5.7
2
DEMA
4.1
8.9
32.8
74.5
88
83.1
92.8 101.7 116.8 105.2
43.4
14.6
SELY
0.2
0.4
1.4
3.2
3.6
3.5
3.8
4.2
5
4.4
1.9
0.6
IVA
0.2
0.3
1.1
3.4
4.6
5.6
6.5
7.8
8.6
6.7
2.1
0.7
THORW
0.3
0.5
1.7
4.4
5.4
6.5
7.7
9.1
11.4
9.5
3.4
1
14
Applying the multivariate statistical methods, data analysis of aridity index variables (LANG, DEMA,
SELY, IVA & THORW) of Table 3.15 in the Statgraphics and SPSS softwares produces the following
results (Figure 3.20 (a), Figure 3.20 (b)):
Scatterplot
0.11
T9
T8
0.07
T1
Factor 2
0.03
T7
T12
T2
T10
T6
T11
-0.01
T3
-0.05
-0.09
T5
T4
-0.13
-7
-4
-1
2
5
8
Factor 1
Figure 3.20 (a). Results of multi-dimensional
analysis (MDSA) of drought index variables of
Table 3.15 on SPSS software.
Figure 3.20 (b). Results of factor analysis FA
from aridity index variables on Statgraphics
software.
(v) Data analysis of the wildfire danger indices by the multivariate statistical method:
Calculation results of variable values of wildfire danger indices (Angstrom, Sharples, CheneySullivan and Viney: ANGS, SHAR, SUL and VIN) in Table 3.16 as follows:
Table 3.16. Calculation results of variable values of wildfire danger indices from meteorological data
Month
Jan
Feb
Mar
Apr
May
Jun
Jul
Aug
Sep
Oct
Nov
Dec
ANGS
5.2
4.9
4.9
5.1
5.1
5.3
5.3
5.4
5.4
5.3
5.2
5.3
SHAR
26.4
25.4
25.5
26.5
26.9
27.6
27.8
28.1
28.0
27.7
27.0
26.9
SUL
17.6
16.9
16.9
17.4
17.5
18.0
18.1
18.3
18.2
18.1
17.8
17.8
VIN
18.7
16.7
16.6
18.0
18.5
19.9
20.3
20.9
20.7
20.4
19.3
19.4
Applying the multivariate statistical methods, data analysis of wildfire danger indices (ANGS, SHAR,
SUL & VIN) of Table 3.16 on Statgraphics and SPSS software. The results are shown in figures 3.21 (a),
B ip lo t
3.21 (b), 3.21 (c) & 3.21 (d).
0 .6
AN G S
T1
T 12
Com ponent 2
0 .4
0 .2
T2
T 11
T 10
V IN
S UL
0
T3
-0 .2
T8
T9
T4
T7
T5
T6
-0 .4
S HAR
-0 .6
-3 .5
Figure 3.21 (a). Results of multi-dimensional
analysis MDSA of wildfire danger index variables
on SPSS software.
-1 .5
0 .5
Com ponent 1
2 .5
4 .5
Figure 3.21 (b). Results of principal component
analysis PCA of wildfire risk index variables on
Statgraphics software.
Dendrogram
Ward's M ethod,Squared Euclidean
50
D istance
40
30
20
10
T9
T8
T7
T10
T6
T3
T2
T12
T5
T11
T4
T1
0
Figure 3.21 (c). Results of factor analysis FA of
15 Figure 3.21 (d). Results of cluster analysis CA of
wildfire danger index variables (ANGS, SHAR, SIL wildfire danger index variables (ANGS, SHAR,
& VIN) on SPSS software.
SUL & VIN) on Statgraphics software.
From the analytical results mentioned above, wildfire seasons and months with high danger of
wildfire are identified as follows:
- Wildfire coincides with the dry season from November to the end of April every year.
- February and March are within the dry season and have a high level of wildfire dangers, showing a
distinct locating time compared to other months on the graph. Meanwhile, the first months of dry season
including November, December and January have lower dangers than February and March.
- In April, the end of the dry season, there is a high possibility of wildfire due to the heat
accumulation effect of flammable material in previous months.
- June, July, August, September and October are the months coinciding with the rainy season so
there is no possibility of wildfire.
3.4.2.2. Predicting wildfire danger by discriminant functions analysis DFA
(a) Determining the set of independent variables and that of dependent variables
(i) Correlation between temperature (T) and humidity (H)
To prove the scientific basis of the correlation between temperature (T) and humidity (H) and the
wildfire danger, the data of 340 plots in BNBNP was processed in Statgraphics software and results are as
follows:
H = (14.2545 - 0.261584*T)2(3-1)
The nonlinear correlation coefficient R = 0.784535 and the probability level of significance P = 3.89 * 10 -72
<< 0.05 (Figure 3.22).
Figure 3.22. The mathematical model H = (14.2545 - 0.261584 * T) ^2 describes the correlation between
temperature T and air humidity H in BNBNP.
(ii) Set of independent variables and set of dependent variables
Pc and Tc are defined as variables describing the outcome of a fire, so it is called a set of dependent
variables. At the same time, T, H, m1 and K are the causes of a fire, and called a set of independent variables.
(iii) Results of canonical correlation analysis between the independent and dependent variables:
To prove that the independent variable {T, H, m1, K} and the dependent variable {Pc, Tc} have a
statistically reliable correlation, canonical correlation analysis CCA is applied to process research data.
The results of canonical correlation analysis CCA between the set of independent variables X = {T,
H, m1, K} and of dependent variable Y = {Pc, Tc} on Statgraphics software are as follows (equation 3.19
and 3.20):
16
The positioning function on the horizontal axis of the independent variable set {T, H, m1, K} (set 1)
is as follows:
X = - 0.101853*T’ + 0.500137*H’ + 0.417125*m1’ - 0.988273*K’ (3.19)
where T ', H', m1 'and K' are standardized variables from initial variables T, H, m1 and K.
The positioning functions on the vertical axis of the dependent set {Pc, Tc} (set 2) is as follows:
Y= 0.52714*Tc’ - 0.838798*Pc’ (3.20)
where Tc 'and Pc' are the standardized variables from the initial variables Tc and Pc,.
[Converting variables T, H, m1 and K into normalized variables T, H ', m1' and K 'by: T' = (T-mT) / ST, where
mT is the average of T, and ST is the standard deviation for T; similar to the standardized variables H ’, m1’
and K ’]
With the canonical correlation coefficient R between the independent variable X = {T, H, m1, K}
and the dependent variable Y = {Pc, Tc} is R = 0.675581, with probability significance level P = 3.17 * 10 -58
<< 0.05 (fig 3.23).
Plot of Canonical Variables #1
4.6
3.6
Set 2
2.6
1.6
0.6
-0.4
-1.4
-2.1
-1.1
-0.1
0.9
1.9
2.9
3.9
Set 1
Figure 3.23. Results show the canonical correlation between the independent variables and the dependent
variables.
The results of the canonical correlation analysis CCA between the independent variables {T, H, m 1,
K} and the dependent variables {Pc, Tc} have proven that the correlation between the independent variable
{T, H, m1, K} and the dependent variable set {Pc, Tc} are quite high and statistically significant (R =
0.675581 and P = 3.17 * 10-58 << 0.05 ). Therefore, it is visible that the inclusion of variables T, H, m1 and K
in forecasting wildfire danger is correct and objective.
b) Results of setting up the canonical discriminant functions and Fisher classification
functions:
(i) Result of establishing canonical discriminant functions CDF:
The canonical discriminant functions (CDF) or discriminant functions (DF), is the function
established with non-normalized variables, derived from the qualifying function with normalized variables.
Applying discriminant functions analysis DFA in Statgracphics software to process research data of 340
plots in BNBNP, the results of establishing canonical discriminant functions CDF1, CDF2 and CDF3 are as
follows:
CDF1 = -17.3958+0.164511 *T+ 0.197994*H+0.129297*m1+4.08328*K
(3.21)
With canonical correlation coefficient R = 0.92635 and the probability level of significance P = 0.0000 =
2.09 * 10-259 << 0.05
CDF2= -3.26996+ 0.0414209*T-0.0335306*H+0.777781*m1+3.79532*K (3.22)
17
With canonical correlation coefficient R = 0.8367 and probability level of significance P = 0.0000 = 7.82 *
10-126 << 0.05
CDF3 = -13.1619+0.322924*T+0.049452*H-1.03335*m1+6.72089*K (3.23)
With canonical correlation coefficient R = 0.68081 and the probability level of significance P = 0.0000 =
5.55 * 10-44 << 0.05.
Figure 3.24. Map of location and classification of wildfire danger levels
The results of the discriminant function analysis DFA showed that all three functions of CDF1,
CDF2 and CDF3 (3.21, 3.22 and 3.23) are statistically significant (P << 0.05), accounting for a very high
proportion (99.99%), and the CDF4 is not. (Because the canonical correlation coefficient R = 0.02569 is very
low, with a probability level that is not statistically significant P = 0.6384 >> 0.05, only accounting for
0.01%, it should be excluded from the calculation process). Therefore, only three functions (3.21, 3.22 and
3.23) are used in forecasting wildfire danger in BNBNP (Appendix 10).
(ii) Results of establishing Fisher classification functions FCF:
The Fisher Classification Functions FCF have also been established based on the results of the
discriminant functions analysis DFA as follows:
FCF1 = -389.679 + 15.3838*T + 5.50726*H + 0.146984*m1 + 124.026*K (3.24)
(function of class 1 wildfire classification. denoted as C1)
FCF2 = -414.731+16.0966*T+5.39905*H+0.626486*m1+148.486*K (3.25)
(function of class 2 wildfire classification. denoted as C2)
FCF3 = -461.368+16.3613*T+5.99709*H+1.25086*m1+153.093*K (3.26)
(function classification of wildfire level 3. denoted C3)
FCF4 = -422.074+15.5836*T+5.52072*H+5.54201*m1+145.743*K (3.27)
(function of class 4 wildfire classification. denoted as C4)
FCF5 =-334.679+15.029*T+4.55343*H+*1.25505m1+122.319*K (3.28)
(function of class 5 wildfire classification, denoted as C5)
These Fisher classification functions are used in predictive calculations to determine the danger of
wildfire when we provide input data (T, H, m1 and K). The wildfire danger level is forecasted with the
18
calculated value of the Fisher classification functions FCFi (i = 1,2,3,4,5) corresponding to the Ci wildfire
danger level (i = 1,2,3, 4.5) to be the highest.
c) Forecasting wildfire danger based on discriminant functions analysis DFA
(i) Forecast of wildfire danger based on the multivariate Mahalanobis distance:
Based on the established canonical discriminant functions CDF, it is possible to calculate the
multivariate Mahalanobis distance. The multivariate Mahalanobis distance D2 in discriminant function
analysis DFA is the squared Euclidean multivariate distance from the locating coordinates of the set of
variables introduced into {T, H, m1, K} to the positioning coordinates of the center wildfire (C1, C2, C3, C4
and C5). The danger of wildfire is forecasted with the shortest multivariate Mahalanobis distance. Using the
database of variables introduced in Table 3.16, and the canonical discriminant functions CDF, the
multivariate Mahalanobis distance is calculated and presented as follows:
Time
Nov
Dec
Jan
Feb
Mar
Table 3.17. Results of wildfire danger forecasted by multivariate Mahalanobis distance
Input variables
The shortest multivariate Forecasting
Mahalanobis distance
level
T(oC)
H (%)
m1(Kg/4m2)
K
27
51.4
0.85
0.141346
8.138987295
C1
29.26
55.14
1.58
0.652034
2.041961204
C2
25.04
73.66
2.4
0.542221
1.023242522
C3
25
53.4
5.93
0.85001
2.46465901
C4
30.24
28.12
1.54
0.52215
0.433095744
C5
From the results of table 3.17, it is concluded that:
- In November, the danger level of wildfire C1 is forecasted to be very low.
- In December, the danger level of wildfire C2 is forecasted to be low.
- In January, the danger level of wildfire C3 is forecasted to be medium.
- In February, the danger level of wildfire C4 is forecasted to be high.
- In March, the danger level of wildfire C5 is forecasted to be very high.
(ii) Forecasting wildfire danger based on Fisher classification function:
The wildfire danger level is forecasted with the calculated value of the Fisher classification functions
FCFi (i = 1,2,3,4,5) corresponding to the Ci wildfire danger level (i = 1,2,3,4,5) to be the highest. Using the
database of the variables included in Table 3.16, based on the 5 Fisher classification functions FCF1, ...,
FCF5 in the prediction model to calculate classification values, the results are as follows (Table 3.18)
Table 3.18. The results of forecasting wildfire danger are based on the Fisher classification functions FCF
Ti me
Nov
Dec
T01
T02
T03
Input variables
2
T(oC)
H (%)
m1(Kg/4m )
K
27
29.26
25.04
25
30.24
51.4
55.14
73.66
53.4
28.12
0.85
1.58
2.4
5.93
1.54
0.141346
0.652034
0.542221
0.85001
0.52215
Highest values of
the Fisher function
326.4121135
451.7668692
476.0768522
419.0418106
313.6420237
Forecasting
level
C1
C2
C3
C4
C5
Calculation results from the forecasting wildfire model based on Fisher classification function FCF also
produce results as same as those forecasting wildfire model based on Mahalanobis distance. In order to avoid
systematic errors, both Mahalanobis multivariate distance model and Fisher classification function model
should be applied to forecast wildfire danger at BNBNP.
3.5. Proposing some solutions to prevent wildfire in three-needled pine forest at BNBNP
19
3.5.1. Determine the wildfire season and the time of wildfire
Determining the wildfire season and the key months of wildfire is very important in fire prevention.
Research results can be used to make a plan for wildfire prevention and fighting for BNBNP. Firstly,
resources should be allocated to implement fire prevention during the annual dry season. Second, it is to
decide when to have flammable material and prescribed burning.
From the research results, the thesis proposes:
- The plan for wildfire prevention and fighting in BNBNP must be developed for 6 months in the dry
season, from November of the previous year to the end of April of the following year.
- Implementation of fire prevention works during the early dry season: November, December and
January.
- February, March and the first half of April require intensive resources to control the source of fire
as well as to prevent possible big fires.
3.5.2. Classification of objects of fire prevention in BNBNP
The purpose of classifying fire prevention objects is to apply appropriate solutions in forest
management. As the three-needled pine forest has been identified as a flammable forest, and pine forest is
widely distributed in the 70,000 ha of BNBNP, the classification is very crucial. On the other hand, resources
for fire prevention are often inadequate to implement solutions for all forest objects. From the research
results, fire prevention objects are classified into the following groups:
(1) Planted forest in tending period or planted forest at age I
(2) Planted forest at caring stage (age level II)
(3) Landscaping forests for tourism
(4) Natural pine forest and planted forest older than 10 years
The identification of priority objects and areas must be based on wildfire dangers and management
objectives.
3.5.3. Solution to process flammable material to prevent wildfire
This solution is recommended for planted forest at caring stage (age level I), Planted forest at
nurturing stage (age level II) and landscaping forest for tourism.
At the beginning of the fire season, collect weight of flammable material m1, m2 and calculate the
danger of wildfire based on the inflammability index K and weight of total material. Refer to Table 3.10 to
divide the forest into four levels: Very likely flammable, likely flammable, flammable and highly flammable.
All forests with K index ≥ 0.3 must be applied with early fire prevention measures to ensure safety in dry
season.
For planted forest at caring stage (age level II), cleaning and burning flammable material in
combination with tending activities twice a year. For the nurturing forests and landscaping forests, clearing
grass and piling for burning in the early time of dry season. Before burning, check Table 3.10 to determine
the likelihood of complete burning of the pile. After burning, check Table 3.10 to return the forest to less
likely flammable stage, if K index is still greater than 0.3, continue burning is needed to make K index below
0.3. This solution is only implemented at the beginning of the annual dry season in November, December
and January which are relevant to the wildfire danger of level 1, level 2 and level 3. Treating flammable
material is an effective solution in fire prevention. The limitation of this solution is that it requires the
clearing and cleaning of biomass, piling and burning that result in high cost.
3.5.4. Prescribed burning for wildfire prevention in BNBNP.
20
3.5.4.1. Scientific basis
The scientific basis for the prescribed burning is rooted from handling flammable material at certain
level when there is a fire source, there will be no fire during the dry season. However, prescribed burning is
different from treating flammable material to prevent fire. The former is to make fire in natural environment
by designated plans, no treating on vegetation, only piling for burning to reduce the volume of flammable
material.
As shown in the overview, prescribed burning is defined by FAO (2003) [57] as “specified firing
under specific environmental conditions, allowing fire to be restricted to a prescribed area and at the same
time to create the heat intensity and spread rate needed to achieve the planned resource management goal ”.
In other words, the prescribed burning must be done in the right amount of flammable material and in
suitable weather to create a low intensity fire that reach the goal of reducing flammable material thereby
reducing the danger of wildfire at high intensity. To solve the above problem, the questions include: (1) what
are forest objects of prescribed burning (2) how much fire intensity to achieve the fire prevention goals
without causing wildfire and (3) when is the appropriate time of prescribed burning? So far, the above
questions have remained unanswered in research on wildfire prevention. The thesis uses research results to
address these issues as follows.
3.5.4.2. Identifying the designated burning forest
For prescribed burning to achieve the fire prevention target, there are three conditions: (1) When the
fire is specified, the forest may burn; (2) Prescribed burning without causing wildfire; (3) Reduce volume of
flammable material in forest with higher danger of wildfire to secure the safety in dry season. Those are
conditions of flammable material before conducting prescribed burning. Research results in section 3.4.1
could be considered to check the qualification of such requirements.
Based on Table 3.10 on the forecast of wildfire danger based on the K index and the flammable
material determined when K index > 0.5 m1 volume equal to 4.74 tons / ha, the forest is easily flammable
(condition 1)
Based on Table 3.11 on the burning percentage Pc and flammable material, when the percentage
between m1 / M is 45.1%, the percentage of flammable material is 60% (condition 2).
Based on Table 3.13 of the summary of criteria for forecasting the danger of wildfire based on forest
status when natural forest and planted forest greater than 10 years old has K index > 0.5, the danger and fire
intensity is very dangerous (condition 3).
In summary, it is concluded that: planted forests >10 year old and natural three needle-leaved pine
forests have portion of dry material over total material > 45%, weight of dry material m1 > 4.74 ton/ha,
inflammability index of flammable material > 0.5 are stands with high danger of high fire intensity that
requires prescribed burning to prevent wildfire.
3.5.4.3. Determine the burning intensity in the prescribed burning
Using Table 3.11 on the result of calculating the burning percentage Pc and weight of flammable
material, the following criteria are presented:
Pc from 10 to 40%, m1 / M ≤34%, weak fire intensity.
Pc from 50 to 70%, m1 / M from 39 to 54%, average fire intensity.
Pc ≥80%, m1 and m ≥ 69%, high intensity.
Thus it is visible that when the fire intensity is weak, the prescribed burning is not effective. When
the fire intensity is high, the prescribed burning can cause wildfire. Therefore, the optimal option is
21
prescribed burning at medium fire intensity when dry material over total material is about 39 to 40% to
achieve a reduced flammable material volume of 50 to 70%.
3.5.4.4. Specifying the time of prescribed burning
Using the discriminant functions analysis DFA results to predict the danger of wildfire based on the
mineral Mahalanobis and Fisher classification functions, it is proposed that the best time to conduct the
indicated burn in BNBNP is December and January when the level of wildfire danger level is at II (C2) and
III (C3). If burning is carried out in November, the wildfire danger is at level I (C1), the forest will not be
burned or will be burned very little, so it does not meet the fire prevention goals. If burning is carried out in
February and March, the wildfire danger is at level IV (C4) and V (C5), it causes forest fire.
3.5.4.5. Determining the prescribed burning cycle
To design prescribed burning cycle, data of forecasting dangers of wildfire for the entire forest area
requiring prevention should be formulated. Make annual and 5-year plans. After burning, it is recommended
to monitor the accumulation level of flammable material until it reaches K> 0.5 m1> 4.6 tons / ha, M> 9.4
tons / ha. Or until danger levels reach level 4 and level 5 based on the results of forecasting wildfire danger
from Mahalanobis distance and Fisher classification functions, the cycle of prescribed burning restarts. Thus,
the prescribed burning cycle is based on changes of flammable material, either on 5 year of 10 years basis,
rather than depending on the annual plan of the forest management bodies.
The identification of the prescribed burning cycle is very important in conserving biodiversity in
BNBNP and reducing greenhouse emission to the environment.
3.5.5. Warning about the danger of wildfire.
From the research results, it is proposed to establish a warning system of wildfire danger for BNBNP.
Model of the wildfire danger forecast system will be operated during the annual dry season. This model will
provide information on the level of wildfire danger based on the overall calculation of the system and
identify specific levels of wildfire forecast. To avoid systematic errors in the calculation process, it is
proposed to use both Mahalanobis distance and Fisher classification functions.
In reality of natural environment, wildfire depends on many factors, in other words, there are many
variables related to the possibility of wildfire. However, temperature, humidity, forest environment, mass
and inflammability index are the four determinants of the most likely to be used as a set of input variables
{T, H, m1, K} to be included in the calculation of the wildfire danger forecast system. The set of input
variables {T, H, m1, K} allows us to access the forecast data collection for each specific forest lot, which will
enhance the reliability of the results of forecasting wildfire danger. Database of identifying prescribed
burning cycle can be used to develop a warning system of wildfire danger for BNBNP.
CONCLUSION, SHORT-COMINGS AND RECOMMENDATIONS
1. Conclusion
1.1. Some characteristics of three-needled pine forest and wildfire
The three-needled pine forest in BNBNP has an area of 23,545 ha, including natural 21,948 ha and
planted 2,047 ha. The lowest altitude where the three-needled pine species appears is 630 m a.s.l., the highest
point is 2,200 m, the natural pine forest of the three-needled pine forest grows in pure concentration
concentrated from 1,000 m to 2,200 m distributed in 70 sub-zone, scattered planted forest in 30 sub-zone.
For planted forests of age I to IV, there is a high degree of differentiation demonstrated by diameter, height
and density. The rich and medium natural forest covers 60% of distribution area. The data analyzed in Tables
22
3.1a, b, c and 3.1d show a correlation between the height of grass and the density of forest. If density is high,
grass is low and vice versa.
1.2. Characteristics of flammable material
- From the ecological point of view, the thesis has proposed a new classification of flammable
material, determining their properties and correlation, proposed an Inflammability index K. From this
classification result, the thesis has identified the variables m1, m2, M, Tc, Pc and K to model and show the
correlation among components of flammable material.
- The thesis surveyed and cataloged 288 vascular plant species belonging to 76 families of flammable
material in three-needled pine forest with many different growth forms. They are classified into three groups:
less likely flammable, flammable and highly flammable. 39 highly flammable plant species were identified
in the three-needled pine forests of BNBNP.
- Results of surveying flammable material including m1, m2, M, K, Pc and Tc of the research forests
have been aggregated into data in Tables 3.7a, b, c, d and 3.7e. A matrix of correlation among components of
flammable material is presented in table 3.8.
1.3. Model the correlation among components of flammable material
Using the collected database, the thesis has built mathematical models showing the correlation among
components of flammable material as follows:
- Correlation between m1 and m2 and M: mathematical models (3.1), (3.2), (3.3), (3.4) and (3.5).
- Correlation between K and m1 and m2: mathematical models of (3.6), (3.7), (3.8) and (3.9).
- Correlation between Tc and m1, m2 and M: mathematical models of (3.10), (3.11), (3.12) and (3.13).
- Correlation between Pc and m1, m2 and K: mathematical models of (3.14), (3.15) and (3.16).
- Correlation between K several m1 and Pc: numerical mathematical model (3.17)
1.4. Forecast of wildfire danger
1.4.1. Forecast of wildfire danger based on univariate statistical models:
- A table of wildfire danger forecasted by K index and weight of flammable material (Table 3.10);
- Results of calculating the percentage of burning Pc and flammable material (table 3.11);
- Calculating Pc flammability % based on K index and weight of flammable material (Table 3.12).
- Summary of criteria for forecasting wildfire danger based on forest status (Table 3.13)
Results of Tables 3.10; 3.11; 3.12 and 3.13 are the scientific bases to propose effective fire prevention
solutions for three-needled pine forests in BNBNP.
1.4.2. Forecast wildfire danger from multivariate statistical models.
1.4.2.1. Determining wildfire season
+) The wildfire season in BNBNP lasts from November to the end of April every year.
+) February and March are the months between the dry season and have a high danger of wildfire.
The first months of dry season including November, December and January have lower dangers than
February and March.
- In April, the end of the dry season, there is a high possibility of wildfire due to the heat
accumulation effect of flammable material in previous months.
- June, July, August, September and October are the months coinciding with the rainy season so
there is no possibility of wildfire.
1.4.2.2. Forecast wildfire danger by discriminant function analysis DFA
(a) Define the set of independent variables and the set of dependent variables:
23