Nghiên cứu giá trị cận lâm sàng trong tiên lượng và theo dõi hiệu quả điều trị ung thư gan nút mạch hóa chất kết hợp đốt sóng cao tần tt tieng anh
Bạn đang xem bản rút gọn của tài liệu. Xem và tải ngay bản đầy đủ của tài liệu tại đây (430.31 KB, 27 trang )
MINISTRY OF EDUCATION AND TRAINING
MINISTRY OF HEALTH
HANOI MEDICAL UNIVERSITY
**********
DANG TRUNG THANH
SUBCLINICAL VALUES IN PROGNOSIS AND
MONITORING OF TREATMENT FOR HEPATOCELLULAR
CARCINOMA WITH TRANSARTERIAL
CHEMOEMBOLIZATION COMBINED WITH
RADIOFREQUENCY ABLATION
Major
Code
: Gastroenterology
: 62.72.01.43
ABSTRACT OF DOCTORAL DISSERTATION
HANOI - 2020
THE WORK ARE COMPLETED AT
BACH MAI HOSPITAL AND
HANOI MEDICAL UNIVERSITY HOSPITAL
Supervisor: Assoc. Prof. Tran Ngoc Anh
Reviewer 1: Tran Viet Tu, M.D, Ph.D
Reviewer 2: Le Chinh Dai, M.D, Ph.D
Reviewer 3: Vu Truong Khanh, M.D.
The dissertation is going to be defended in front of the doctoral thesis
evaluation committee at Hanoi Medical University
The thesis can be found at:
Vietnamese National Library
Library of Hanoi Medical University
1
INTRODUCTION
Hepatocellular carcinoma (HCC) is the 3rd most severe
malignancy in terms of mortality in all cancers with approximately
787,200 deaths per year. Vietnam is one of the countries with the
highest HCC incidence with over 10,000 new cases each year.
Multidisciplinary treatment of HCC has been gaining attention in
recent years, including transarterial chemoembolization (TACE)
combined with radiofrequency ablation (RFA). To study the
effectiveness of combination therapy, clinicians also combine
imaging diagnosis to monitor treatment efficacy, along with the use
of tumor markers, which also play an important role in diagnosing,
evaluating treatment results and monitoring the recurrence of HCC.
In Vietnam, a new set including three markers of AFP, AFPL3 and PIVKA-II was put into use in the diagnosis and evaluation of
HCC treatment results. To data, very little study in Vietnam reported
on the role of these 3 markers, especially the use of GALAD and
BALAD models in HCC diagnosis and evaluation. Hence, this study
was conducted with the aims of:
1.
To evaluate diagnostic values of AFP, AFP-L3, PIVKA II
and GALAD in HCC
2. To evaluate the values of AFP- L3, PIVKA-II and BALAD in
the prognosis and monitoring of treatment outcomes of HCC
with
transarterial
chemoembolization
radiofrequency ablation
combined
with
2
IMPORTANCE OF DOCTORAL DISSERTATION
Investigation of the value of AFP, AFP-L3 and PIVKA II
markers in HCC patients. This study identified cut-off threshold
values of AFP, AFP-L3 and PIVKA II markers, GALAD scale for
HCC diagnosis. Evaluate the values of AFP, AFP-L3 and PIVKA-II,
BALAD scale was in prognosis and monitor the effectiveness of
treatment
of
liver
tumors
by
combining
transarterial
chemoembolization (TACE) with radiofrequency ablation (RFA). We
also initially determined the values of AFP-L3, PIVKA II, BALAD,
GALAD scores in estimating the life expectancy and treatment
response of HCC patients. Thereby, the assessment of the response of
treatment was according to the Japan Hepatobiliary Association, in
Fwhich the proportion of patients responding to treatment was
68.9%.
FINDINGS OF DOCTORAL DISSERTATION
We examined important values of AFP, AFP-L3, and PIVKA
II in hepatocellular carcinoma (HCC). To explore cut-off points of
AFP, AFP-L3, PIVKA-II, and GALAD in the diagnosis of HCC. To
evaluate the values of AFP- L3, PIVKA-II and BALAD in the
prognosis and monitoring of treatment outcomes of HCC with
transarterial chemoembolization combined with radiofrequency
ablation. The life expectancy of patients with HCC was estimated
based on the values of AFP-L3, PIVKA-II, BALAD, and GALAD.
The proportion of patients responding to treatment was 68.9%
according to the Japan Society of Hepatology.
3
THESIS STRUCTURE
The thesis consists of 140 pages including 02-page introduction, 37page overview, 25-page methods, 37-page results,
36-page
discussion, 02-page conclusions, and 01-page recommendation. The
thesis has 52 tables, 25 illustrations, 9 figures. There are 182
references, of which 17 are Vietnamese.
Chapter 1
OVERVIEW
1.1 Diagnosis and treatment of HCC
1.1.1 Diagnostic criteria of HCC
- American Gallbladder Association
- European Hepatobiliary Association
- Asian and Pacific Liver Association
- Japanese Gallbladder Association
- Diagnostic criteria for HCC according to the Ministry of Health of
Vietnam
1.1.2 Diagnostic criteria of liver hemangioma
Hepatic hemangiomas are divided into two main types:
cavernous hemangioma and capillary hemangioma, in which most
Hepatic hemangiomas are cavernous hemangioma
1.2 Treatment methods of HCC
1.2.1 Liver resection/ liver transplantation
Liver resection is the optimal choice for cases of AF, with
good liver function even on cirrhosis (Stage T1-3, N0, M0). The
4
widely accepted criteria for liver transplantation is that Child C
cirrhosis has 1 liver tumor less than 5cm or has up to 3 tumors with a
size of less than 3cm each and has no invasive vascular invasion or
extrahepatic metastases (Milan criteria).
1.2.2 Destroy the tumor on the spot
Methods to destroy the tumor on the spot include: absolute
alcohol injection, high frequency (RFA), and microwave heating.
1.2.3 Cut off the tumor blood supply
The tumor does not cut or many 2 lobes. There may be small
portal venous thrombosis. Overall score (PS) = 0-2. Child Pugh A, B.
No distant metastasis.
1.3. Subclinical methods used in the diagnosis and monitoring of
patients with primary HCC
1.3.1. Image diagnostic methods
Ultrasound, CT - scanner, computerized tomography (CT)
scan / magnetic resonance imaging (MRI) play the important role in
the diagnosis and monitoring of disease status.
1.3.2. Markers
The tumor markers in HCC are used for the purpose of early
diagnosis, prognosis of extra survival and monitoring of treatment. It
is common to divide tumor markers over several research stages
before being routinely used in clinical practice (Phase 1: preclinical
studies; Phase 2: clinical trials and cut-off score determination. ;
Phase 3: retrospective research and vertical tracking; Phase 4:
prospective studies; Phase 5: case studies).
5
1.4. The values of AFP-L3, PIVKA II and GALAD model in
monitoring treatment of primary HCC
1.4.1 The effectiveness of HCC treatments combines RFA and
TACE
TACE in conjunction with RFA. TACE is a local destruction
therapy by obstructing the blood vessels that feed the tumor and
providing local chemotherapy. TACE can reduce the cooling effect
of large vessels adjacent to the UTBMTBG, resulting in a significant
increase in the excision region. TACE may also be effective in
treating small undetected metastases adjacent to the primary tumor.
1.4.2 The values of AFP-L3, PIVKA II and GALAD model
Pathogenesis of HCC complex is influenced by many factors,
besides the markers being studied in phase 1 and phase 2. Another
approach scientists are taking is to combine existing cancer markers
in the GALAD or BALAD model to provide better diagnostic and
follow-up values.
Chapter 2
METHODS
2.1. Research objects
2.1.1. Location and time
The study was conducted at the Center for Nuclear Medicine
and Oncology at Bach Mai Hospital and Hanoi Medical University
Hospital from June 2016 to September 2019.
2.1.2
Patients
The patients were diagnosed with HCC and hepatic
hemangiomas.
6
2.1.2.1. Selection criteria
Diagnosis of HCC following treatment guidelines of the
Ministry of Health in 2012.
2.1.2.2. Exclusion criteria
The patient is contraindicated to treat with HCC following
RFA and TACE therapy.
2.2. Methodology
2.2.1 Study design
Progressive study.
2.2.2 Sample
n = Z2(1-α/2)(pxq)/d2
p = 0.1 (with Cut-off AFP value - L3 10%, in patients with small
tumors <3cm, the sensitivity and specificity results are 77% and 95%,
according to the author Oka H et al. the). Replace the formula and
add a 15% prophylaxis to the error we have n = 90 patients.
2.2.3
Instruments
Máy ALLURA XPER FD 20 for TACE, The New Cool-tip
RFA System E Series 2011 for RFA.
2.2.4 Data analysis
The research data was coded, entered, processed and
analyzed on computers using SPSS 22.0 medical statistics software.
Probability of extra time based on Kaplan-Meier. The cumulative
probability of survival (overall, not progressing) according to
Kaplan-Meier. Descriptive statistics were applied. Statistical tests
were used for quantitative variables Mann - Whitney test and Kruskal
7
Wallis test were applied; For qualitative variables we used fisher’s
exact test. The difference was considered to be statistically
significant with p <0.05.
2.4.5 Ethics
All clinical investigations were conducted according to the
principles expressed in the Declaration of Helsinki. Hanoi Medical
University Institutional Review Board Committee approved the study
protocol. Informed consents were obtained from all individual
participants included in the study.
Chapter 3
RESULTS
3.1. GENERAL CHARACTERISTICS
3.1.1. Age
Table 3.1. Number patients according to age
Hepatic
Age groups
HCC (n=90)
hemangiomas
(n=90)
p
n
%
n
%
≤50
9
10,0
49
54,4
<0,05*
51 – 60
29
32,2
20
22,2
>0,05*
61 – 70
36
40,0
16
17,8
<0,05*
>70
16
17,8
5
5,6
<0,05*
Total
90
100
90
100
Mean±SD
61,9±9,9
48,3±13,7
* Chi-squared test ** Mann – Whitney test
<0,05**
8
The average age of HCC group in the study is 61.9 ± 9.9
years. There was a difference in the average age of HCC and hepatic
hemangiomas (p <0.05).
Table 3.2. Gender characteristics
Hepatic
Gender
HCC (n=90)
hemangiomas
(n=90)
n
%
n
%
Male
82
91,1
34
37,8
Female
8
8,9
56
62,2
Total
90
* Chi-squared test
100
90
100
p
<0,05*
The gender difference between HCC group and hepatic
hemangioma group was statistically significant (p <0.05).
3.1.2. Subclinical characteristics
Table 3.1. Risk factors
The percentage of hepatitis B accounts for the highest with
67.5%.
9
Table 3.3. Tumor characteristics
Tumor characteristics
n
%
Right lobe
76
84,4
Left lobe
10
11,2
4
4,4
1 block
62
68,9
2 blocks
22
24,4
>3 blocks
6
6,7
Invasive vena cava
Yes
5
5,6
(bundle thrombosis)
No
85
94,4
<2 cm
3
3,3
2-5 cm
32
35,6
5 - 10 cm
42
46,7
>10 cm
13
14,4
Location
Both two
lobes
Tumor numbers
Tumor size
Most patients had 1 mass in the right lobe. The proportion of
tumor size 5-10 cm accounted for the highest proportion with 46.7%.
3.2. VALUES OF AFP, AFP-L3 PIVKA II, GALAD IN
DIAGNOSIS OF HCC
10
Table 3.4. Values of AFP, AFP-L3, PIVKA II and GALAD
between HCC and hepatic hemangioma
HCC
(n=90)
Hepatic
hemangiomas
p
(n=90)
AFP (ng/ml)
40,3(1,5 – 78165)
2,4(0,1 – 120)
<0,001*
AFP-L3 (%)
22,7(0,5 – 93,6)
0,5(0,1 – 31,1)
<0,001*
530,8(12,5 – 47499)
19(10 – 370)
<0,001*
-4,5(-8,7 – 2,3))
<0,001*
PIVKAII
(mAU/ml)
GALAD
2,9(-3,4 – 13,3)
* Mann – Whitney test
The average concentration of AFP was 40.3 (1.5 - 78165),
AFP-L3 was 22.7 (0.5 - 93.6), PIVKA II was 530.8 (12.5 - 47499),
GALAD was 2.9 (-3.4 - 13.3).
3.2.1. Correlation between tumor size and AFP-L3, PIVKA II
and GALAD values
The mean value of AFP-L3 (29.13%), PIVKA-II (378 mAu /
ml) in HCC patients with tumor size <2 cm was significantly lower
than that of HCC with size. > 5cm AFP –L3 (32, 2%); PIVKA-II
(1212 mAu / ml) (p <0.05). There was a positive correlation between
tumor size and AFP-L3, PIVKA II concentration values and GALAD
score.
3.2.2. The calues of AFP, AFP-L3, PIVKA II and GALAD in the
diagnosis
11
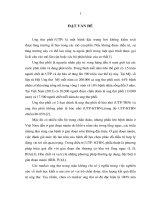
Figure 3.2. Characteristic ROC curves of AFP, AFP-L3, PIVKA II,
GALAD in the diagnosis of HCC
AFP-L3 ratio has: J = max (Se + Sp) - 1 = 0.666. The optimal
cutting value is 10.0%. AFP ratio has: J = max (Se + Sp) - 1 = 0.311. The
optimal shear value is 12.6 (ng / ml). PIVKA II ratio has: J = max (Se +
Sp) - 1 = 0.556. The optimal shear value is 42.5 (mAU / ml). GALAD
ratio has: J = max (Se + Sp) - 1 = 0.822. The optimal cutoff value is -1.90.
Table 3.5. HCC diagnostic value of AFP, AFP-L3, PIVKA II and
GALAD score
Markers
Cut-off
AUROC
95%CI
AFP
12,6 (ng/ml)
0,805
0,743 – 0,867
AFP-L3
10%
0,872
0,822 – 0,922
PIVKA-II
42,5 (ng/ml)
0,875
0,826 – 0,924
GALAD
-1,90
0,969
0,949 – 0,990
12
The area under the ROC curve of the individual markers and
when combined all have good diagnostic values for patients with
TBoma (over 0.8). The highest diagnostic value is based on the
GALAD score. The lowest diagnostic value is based on AFP.
Figure 3.3. Characteristic ROC curves of AFP-L3, PIVKA II,
GALAD in the diagnosis of AFP with AFP <20ng / ml
AFP-L3 ratio had: J = max (Se + Sp) - 1 = 0.664. The
optimal cutting value was 10.0%. PIVKA-II ratio had: J = max (Se +
Sp) - 1 = 0.533. The optimal shear value was 25 (mAU / ml).
GALAD ratio had: J = max (Se + Sp) - 1 = 0.868. The optimal shear
value was -2.27.
13
Table 3.6 Diagnostic values for AFP - L3 and PIVKA-II, GALAD
in AFP group <20ng / ml
Cut-off
AFP-L3 (%)
PIVKAII
(mAU/ml)
≥10
≥25
≥-2,27
GALAD
Sensi
Specifi
tivity
city
Positive Negative
predictive predictio
value
n value
83,6%
74,4%
87,9%
68,9%
60,8%
89,1%
95,1%
91,4%
93,5%
Area under the
curve
0,857
80,6
%
83,3
%
(0,779 – 0,933)
0,795
(0,703 – 0,887)
0,980
91,7
%
(0,955 – 1,000)
The cut-off point of value of AFP-L3 value was 10%. The
cut-off point of PIVKA II value was 25 mAU / m and the cut-off of
the GALAD value was -2.27.
3.3 VALUES OF AFP-L3, PIVKA II, BALAD, AND GALAD IN
MORNITORING OF TREATMENT OUTCOME OF HCC
WITH TACE COMBINED WITH RFA
3.3.1. Treatment outcome
Table 3.7. Results of treatment over time
Survival
Time after
Death
treatment
n
%
n
%
3 months
90
100
0
0
6 months
90
100
0
0
End
70
77,8
20
22,2
14
No patients died within 3 months and 6 months. At the end
of the study, the number of patients died was 20/90, accounting for
22.2%.
Table 3.8. Value makers at the time of follow-up treatment
Markers
3 months
6 months
p
AFP ng/ml
85,4(1,6 – 121000)
40,5(1,5 – 26366)
<0,001*
AFP-L3 (%)
12,9(0,5 – 69,5)
8,4(0,5 – 89,7)
<0,001*
479,0(6,5 – 43000)
154,5(2,8 – 14242)
<0,001*
GALAD
2,8(-2,8 – 13,9)
1,7(-3,2 – 10,0)
<0,001*
BALAD
1,8(-1,9 – 2419,9)
0,6(-3,9 – 527,9)
<0,001*
PIVKA II
(mAU/ml)
*Sign test
After treatment, there were significant differences at 3
months and 6 months after treatment for the diagnostic marker values
AFP, AFP-L3, PIVKA II, GALAD, and BALAD (p <0.001).
Table 3.9. Classification of BALAD values at the time of
monitoring after treatment
BALAD
Discharge
After 3 months
After 6 months
N
%
n
%
n
%
Level 1
4
4,4
4
4,4
6
6,6
Level 2
9
10,0
12
13,3
15
16,7
Level 3
24
26,7
18
20,0
17
18,9
Level 4
53
58,9
56
62,3
52
57,8
Total
90
100
90
100
90
100
15
After treatment, BALAD level classification did not differ
significantly at time of discharge, after 3 months and after 6 months.
Table 3.10. mResist classification after 3 months and 6 months of
treatment
mResist
classification
After 3 months
n
%
p
After 6 months
n
%
Full response
5
5,5
0
0
>0,05*
Partial response
29
32,2
45
50,0
<0,05*
Progressive
15
16,7
12
13,3
>0,05*
Stable
41
45,6
33
36,7
>0,05*
Total
90
100
90
100
*McNemar test
After treatment, there was a significant difference after 3
months and after 6 months in the partial response group (p <0.05).
Figure 3.4. The proportion of patients who responded to treatment
according to the Japan Hepatobiliary Society
According to the classification of the Japan Hepatobiliary
Society, 62 patients with HCC responded to treatment (68.9%).
16
Figure 3.5 Overall survival rates over time
After 600 days, the cumulative survival rate was 68%.
Table 3.11. Average additional survival time according to AFP-L3
classification
Extra time by day
AFP-L3
n
<10%
15
708,1 (645,8 – 770,5)
10-15%
10
704,0 (581,3 – 826,7)
>15%
65
615,2 (581,7 – 648,6)
(95% CI)
The patient group with AFP-L3 value <10%, the highest
survival time was 708.1 days.
Table 3.12. Average survival time according to PIVKA II
Extra time by day
PIVKA II (mAU/ml)
n
≤40
13
723,5 (668,1 – 778,9)
>40
77
584,8 (522,8 – 646,7)
(95% CI)
17
The patients with PIVKA II value ≤40, the highest survival
time was 723.5 days.
Table 3.13. Average survival time according to BALAD
classification
Extra time by day
BALAD
n
Level 1
4
741,3 (655,7 – 827,0)
Level 2
9
736,5 (616,4 – 856,6)
Level 3
24
606,9 (556,0 – 657,8)
Level 4
53
572 23,2 – 609,3)
(95% CI)
In group BALAD patients level 1, the highest survival time
was 741.3 days.
Table 3.14. Average survival time according to GALAD
classification
GALAD
Cut-off (-1,90)
Cut-off (-0,36)
n
Extra time by day
(95%CI)
<-1,90
7
718,8(664,7 – 772,8)
≥-1,90
83
623,0(587,4 – 664,7)
<-0,36
10
802,0(756,5 – 848,9)
≥-0,36
80
714,7(659,3 – 770,0)
Following the cut-off of -1.90, the group with the GALAD
score <-1.90 had the highest extra life time. According to the cut
18
threshold of -0.36, the group with the GALAD score <-0.36 had the
highest extra time.
Table 3.15. Extra time in the treatment response group according to
the classification of the Japan Hepatobiliary Society
Extra time by day
Treatment outcome
n
Response
62
731,6 (668,1 – 795,1)
No response
28
678,6 (613,7 – 743,5)
(95%CI)
For patients who responded to treatment, the extra time was
731.6 days higher than the group of patients did not respond, the
extra time was 678.6 days.
Chapter 4
DISCUSSION
4.1. CHARACTERISTICS OF THE PATIENTS
In our study, the majority of patients in the HCC group were
over 50 years old (90.0%). Meanwhile, the patients in liver
hemangioma group were mostly under 50 years old (54.4%). In terms
of gender, the study found that the proportion of male patients in the
HCC group (91.1%) was significantly higher than that of the male
patients in the group of liver tumors (37.8%). In general, the rate of
HCC was higher for males than for females. This result was similar
to previous studies of Tran Van Huy and Vu Manh Duy.
The most common symptom patients were pain in the right
upper quadrant pain (48.9%), in addition to other non-specific
symptoms such as fatigue (33.3%), anorexia. (32.2%) and up to
19
14.4% of patients with digestive disorders. Compared to the study of
Vu Van Khien, the study had similarities.
In terms of physical symptoms, 40.0% of patients had
enlarged spleen, 34.4% of patients had enlarged liver and only 1.1%
of patients had jaundice. The patients in the study of Vuong Thu Ha
had similar physical symptoms as in our study, mainly hepatomegaly,
splenomegaly. By stage of Child Pugh cirrhosis, the majority of
patients were at Child Pugh A stage (81.1%). 10.0% of patients were
in Child Pugh B phase and 3.3% were in Child Pugh C. Among 33
patients in the study of Vuong Thu Ha, most was stage Chil-pugh A
(97%), while stage B was only one patient (3%).
4.2.
DIAGNOSTIC VALUES OF AFP, AFP-L3, PIVKA II
AND GALAD IN PRIMARY HCC
4.2.1. Change of HCC markers
In our study, the average AFP, AFP-L3 and PIVKA-II
concentrations in our study were 326.2 ng / ml, 24.5%, 513.3 mAu /
mL, respectively. Statistical significance compared to the group of
liver hemangiomas. Differences were also observed between the two
groups of breast cancer and those with chronic liver disease without
liver cancer. This result was similar to the study of Durazo et al.,
Author Marrero et al. Also found that the concentration of 3 markers
was higher in the HCC group than the average level in cirrhotic
patients. In the study of Best et al., the average concentration of
markers in the HCC group, AFP value was 39.35 ± 12,329.3, AFPL3 value was 16.15 ± 21.3, and the value of PIVKA-II is 13,82 ±
20
1,768,6, which were significantly higher than the control group of
benign liver diseases.
In our study, there was also a statistically significant
difference between the average concentration of tumor markers by
the stage of HCC - Barcenola classification (stage O and A - early
stage) and late stage. (stage B, C, D according to Barcenola
classification) except AFP imprint (pAFP = 0,50; pAFP-L3< 0,001; pPIVKA
II
< 0,001). This result was similar to the research results of Marrero
et al, Park et al.
4.2.2. The value and cut-off threshold of the markers in the
diagnosis
At the AFP cut-off point was 12.6%, the sensitivity and
specificity for diagnosis of HCC were 66.7% and 64.4%,
respectively. At the AFP-L3 cut-off point of 10.0%, the sensitivity
and specificity for diagnosing HCC was at 83.3%. At the cut-off
point of PIVKA II was 42.5%, the sensitivity and specificity for
diagnosis of HCC were 85.6% and 70.0%, respectively. This result
showed that the use of AFP-L3 and PIVKA II was valuable in
disease diagnosis. The results were similar to the studies of Sang
Joon Park et al. When conducting a direct comparison of the
usefulness of AFP, AFP-L3 and PIVKA-II both individually and in
combination in HCC diagnosis.
We also looked at HCC diagnostic values of AFP-L3,
PIVKA-II and GALAD scores in patients with AFP levels <20 ng /
mL. The highest diagnostic value for PIVKA-II markers, with the
area under the AUROC curve in diagnosing patients with HCC was
21
0.8749. The area under the AUROC curve corresponding to the
marks AFP and AFP-L3 were 0.805 and 0.8723. Notably, the area
under the AUROC curve of the individual markers and when
combined all have good diagnostic value for patients with HCC
(above 0.8). In our study, the highest diagnostic value was based on
the GALAD score (combined model of AFP, AFP-L3, and PIVKAII). Lowest diagnostic value based on AFP, GALAD ratio had J =
max (Se + Sp) - 1 = 0.822. The optimal cutoff value was -1.90. At the
GALAD cut-off point was -1.90, the sensitivity and specificity of
HCC diagnosis were 93.3% and 88.9%, respectively.
4.3.
THE VALUES OF AFP- L3, PIVKA-II AND BALAD IN
THE PROGNOSIS AND MONITORING OF
TREATMENT
OUTCOMES OF HCC
Our study supports that BALAD provides an extremely good
indication of the prognosis of patients with HCC regardless of its
cause and size. This has been confirmed in a recent nationwide study
from Japan conducted by Toyoda and colleagues. For BALAD
patients group level 1, the extra time was 741.3 days (95% CI 655.7 827.0). For BALAD patients with level 2, the extra time was 736.5
days (95% CI 616.4 - 856.6). For BALAD patients with level 3, the
extra time was 606.9 days (95% CI 556.0 - 657.8). For BALAD
patients with level 4, the extra time was 572 days (95% CI 523.2 609.3).
In this study, to evaluate the results of treatment for patients
with HCC using RFA, we used the Clinical practice guidelines for
hepatocellular carcinoma management (updated 2014). According to
22
this classification, 62 patients with HCC responded to treatment
(68.9%), and 28 patients with HCC did not respond to treatment
(31.1%).
CONCLUSIONS
From the study on 90 patients with hepatocellular carcinoma
at Bach Mai Hospital and 90 patients with liver hemangioma at
Hanoi Medical University Hospital, we have several conclusions:
1. To evaluate diagnostic values of AFP, AFP-L3, PIVKA II and
GALAD in HCC
Physicians can use cut-off points in our findings to diagnose
HCC patients, contributing to improved treatment and management.
The optimal cut-off threshold of AFP, AFP-L3, PIVKA-II in HCC
diagnosis was 12.6 ng/ml, 10%, and 42.5 mAU/ml respectively. The
area under the ROC curve (AUC) value for AFP was 0.805
(sensitivity [Se]: 66.7%, specificity [Sp]: 64.4%); Positive forecast
value: 65.2%; Negative forecast value: 65.9%. The AUC value for
AFP-L3 was 0.872 (Se: 83.3%, Sp: 83.3%); Positive forecast value:
83.3%; Negative forecast value: 83.3%. The AUC value for PIVKAII was 0.874 (Se: 85.6%, Sp: 70.0%); Positive forecast value: 74.0%;
Negative forecast value: 82.9%. The GALAD model had the highest
HCC diagnostic value compared with each marker. The optimum
diagnostic value of GALAD was -1.90; The AUC value was 0.969.
For patients with AFP <20ng/ml, the optimal cut-off values of AFPL3, PIVKA-II and GALAD were 10.0%, 25 mAU/ml and -2,27
respectively.
23
2.
To evaluate the values of AFP- L3, PIVKA-II and BALAD
in the prognosis and monitoring of treatment outcomes of HCC
with
transarterial
chemoembolization
combined
with
radiofrequency ablation
AFP-L3 was valuable in predicting the prognosis and
monitoring the effectiveness of HCC treatment with transarterial
chemoembolization combined with radiofrequency ablation. The
higher the AFP-L3 value was, the shorter the survival time was.
Extra life time was 708.1 days with AFP-L3 <10%. Extra life time
was 704.0 days with AFP-L3 from 10-15%. Extra life time is 615.2
days with AFP-L3 >15%. PIVKA-II was valuable in predicting the
prognosis and monitoring the effectiveness of HCC treatment with
transarterial chemoembolization combined with radiofrequency
ablation. The higher the PIVKA-II value was, the shorter the survival
time was. Extra life time was 723.5 with PIVKA-II ≤40, while the
extra life was 584.8 days with PIVKA-II >40. The BALAD model
was valuable in predicting the prognosis and monitoring the
effectiveness of HCC treatment with transarterial chemoembolization
combined with radiofrequency ablation. The additional life time
decreased with the BALAD classification from level 1 to 4.
Estimated survival time of HCC patients according to cut-off
GALAD was at -1.90. The GALAD patient group <-1.9 (718.8 days)
had longer life time compared to the GALAD group >1.9 (623.0
days). The prognosis of treatment response was that according to the
Japan Hepatobiliary Association, 62 patients responded to treatment
(68.9%), and 28 patients did not respond to treatment (31.1%); with