Tài liệu Excel 2010 part 19 doc
Bạn đang xem bản rút gọn của tài liệu. Xem và tải ngay bản đầy đủ của tài liệu tại đây (927.26 KB, 10 trang )
180
22
33
44
55
11
2
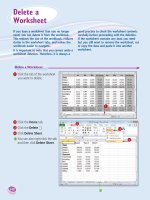
Select the range that includes
the input values and the
formula.
3
Click the Data tab.
4
Click What-If Analysis ( ).
5
Click Data Table.
1
Type the input values:
To enter the values in a
column, start the column one
cell down and one cell to the
left of the cell containing the
formula, as shown here.
To enter the values in a row,
start the row one cell up and
one cell to the right of the cell
containing the formula.
Create a Data Table
If you are interested in studying the effect a
range of values has on the formula, you can set
up a data table. This is a table that consists of
the formula you are using, and multiple input
values for that formula. Excel automatically
creates a solution to the formula for each
different input value.
Do not confuse data tables with the Excel
tables that you learned about in “Convert
a Range to a Table.” A data table is
a special range that Excel uses to calculate
multiple solutions to a formula.
Create a
Data Table
12_577639-ch10.indd 18012_577639-ch10.indd 180 3/15/10 2:46 PM3/15/10 2:46 PM
181
Analyzing Excel Data
CHAPTER
10
66
77
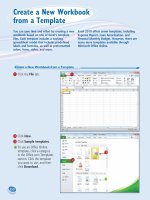
The Data Table dialog box
appears.
6
Specify the formula cell you
want to use as the data table’s
input cell:
If the input values are in a
column, enter the input cell’s
address in the Column input
cell text box.
If you entered the input values
in a row, enter the input cell’s
address in the Row input cell
text box.
7
Click OK.
•
Excel displays the results.
What is what-if analysis?
The technique called what-if analysis is perhaps
the most basic method for analyzing worksheet
data. With what-if analysis, you first calculate a
formula D, based on the input from variables A,
B, and C. You then say, “What happens to the
result if I change the value of variable A?”, “What
happens if I change B or C?”, and so on.
When I try to delete part of the data
table, I get an error. Why?
The data table results are created as an
array formula, which is a special formula
that Excel treats as a unit. This means that
you cannot move or delete part of the
results. If you need to work with the data
table results, you must first select the
entire results range.
12_577639-ch10.indd 18112_577639-ch10.indd 181 3/15/10 2:46 PM3/15/10 2:46 PM
182
22
11
33
2
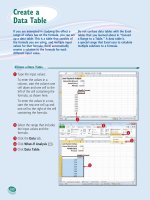
Click the Data tab.
3
Click Subtotal ( ).
1
Click a cell within the range
you want to subtotal.
Summarize Data with Subtotals
When you need to summarize your data, Excel
offers a feature that enables you to quickly and
easily add subtotals to a range of data.
Although you can use formulas and worksheet
functions to summarize your data in various
ways, including sums, averages, counts,
maximums, and minimums, if you are in a
hurry, or if you just need a quick summary of
your data, you can get Excel to do most of the
work for you. The secret here is a feature called
automatic subtotals, which are formulas that
Excel adds to a worksheet automatically.
Summarize Data
with Subtotals
12_577639-ch10.indd 18212_577639-ch10.indd 182 3/15/10 2:46 PM3/15/10 2:46 PM
183
Analyzing Excel Data
CHAPTER
10
44
66
55
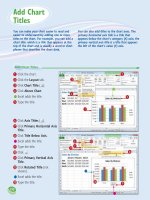
The Subtotal dialog box
appears.
4
Click the At each change in
and then click the column
you want to use to group the
subtotals.
5
In the Add subtotal to list,
click the check box for
the column you want to
summarize (
changes to ).
6
Click OK.
•
Excel calculates the subtotals
and adds them into the range.
•
Excel adds outline symbols to
the range.
Do I need to prepare my worksheet to use
subtotals?
Excel sets up automatic subtotals based on data
groupings in a selected field. For example, if you
ask for subtotals based on the Customer field,
Excel runs down the Customer column and
creates a new subtotal each time the name
changes. To get useful summaries, then, you
need to sort the range on the field containing
the data groupings you are interested in.
Can I only calculate totals?
No. The word “subtotal” here is a bit
misleading because you can summarize
more than just totals. You can also count
values, calculate the average of the values,
determine the maximum or minimum
value, and more. To change the summary
calculation, follow Steps 1 to 4, click the
Use function
, and then click the
function you want to use for the summary.
12_577639-ch10.indd 18312_577639-ch10.indd 183 3/15/10 2:46 PM3/15/10 2:46 PM
Chapter
Chapter
11
1111
11
Visualizing Data
with Excel Charts
You can take a worksheet full of
numbers and display them as a
chart. Visualizing your data in
this way makes the data easier
to understand and analyze. To
help you see your data exactly
the way you want, Excel offers
a wide variety of chart types,
including pie charts, column
charts, and stock charts. Excel
also offers a large number of
chart options that enable you to
add chart titles and data labels,
control the chart legend and
gridlines, format the chart layout
and style, change the chart type,
and more.
13_577639-ch11.indd 18413_577639-ch11.indd 184 3/15/10 2:47 PM3/15/10 2:47 PM